

PDF: 4209 KB - Bureau of Infrastructure, Transport and Regional ...
PDF: 4209 KB - Bureau of Infrastructure, Transport and Regional ...
PDF: 4209 KB - Bureau of Infrastructure, Transport and Regional ...

You also want an ePaper? Increase the reach of your titles
YUMPU automatically turns print PDFs into web optimized ePapers that Google loves.
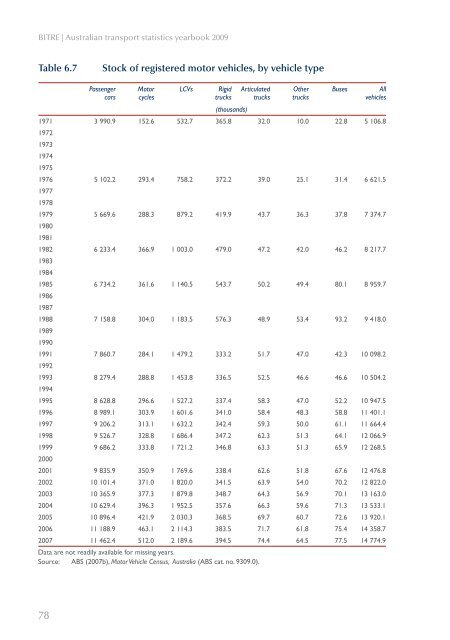
BITRE | Australian transport statistics yearbook 2009<br />
Table 6.7<br />
Stock <strong>of</strong> registered motor vehicles, by vehicle type<br />
Passenger<br />
cars<br />
Motor<br />
cycles<br />
LCVs<br />
Rigid<br />
trucks<br />
(thous<strong>and</strong>s)<br />
Articulated<br />
trucks<br />
Other<br />
trucks<br />
Buses<br />
All<br />
vehicles<br />
1971 3 990.9 152.6 532.7 365.8 32.0 10.0 22.8 5 106.8<br />
1972<br />
1973<br />
1974<br />
1975<br />
1976 5 102.2 293.4 758.2 372.2 39.0 25.1 31.4 6 621.5<br />
1977<br />
1978<br />
1979 5 669.6 288.3 879.2 419.9 43.7 36.3 37.8 7 374.7<br />
1980<br />
1981<br />
1982 6 233.4 366.9 1 003.0 479.0 47.2 42.0 46.2 8 217.7<br />
1983<br />
1984<br />
1985 6 734.2 361.6 1 140.5 543.7 50.2 49.4 80.1 8 959.7<br />
1986<br />
1987<br />
1988 7 158.8 304.0 1 183.5 576.3 48.9 53.4 93.2 9 418.0<br />
1989<br />
1990<br />
1991 7 860.7 284.1 1 479.2 333.2 51.7 47.0 42.3 10 098.2<br />
1992<br />
1993 8 279.4 288.8 1 453.8 336.5 52.5 46.6 46.6 10 504.2<br />
1994<br />
1995 8 628.8 296.6 1 527.2 337.4 58.3 47.0 52.2 10 947.5<br />
1996 8 989.1 303.9 1 601.6 341.0 58.4 48.3 58.8 11 401.1<br />
1997 9 206.2 313.1 1 632.2 342.4 59.3 50.0 61.1 11 664.4<br />
1998 9 526.7 328.8 1 686.4 347.2 62.3 51.3 64.1 12 066.9<br />
1999 9 686.2 333.8 1 721.2 346.8 63.3 51.3 65.9 12 268.5<br />
2000<br />
2001 9 835.9 350.9 1 769.6 338.4 62.6 51.8 67.6 12 476.8<br />
2002 10 101.4 371.0 1 820.0 341.5 63.9 54.0 70.2 12 822.0<br />
2003 10 365.9 377.3 1 879.8 348.7 64.3 56.9 70.1 13 163.0<br />
2004 10 629.4 396.3 1 952.5 357.6 66.3 59.6 71.3 13 533.1<br />
2005 10 896.4 421.9 2 030.3 368.5 69.7 60.7 72.6 13 920.1<br />
2006 11 188.9 463.1 2 114.3 383.5 71.7 61.8 75.4 14 358.7<br />
2007 11 462.4 512.0 2 189.6 394.5 74.4 64.5 77.5 14 774.9<br />
Data are not readily available for missing years.<br />
Source: ABS (2007b), Motor Vehicle Census, Australia (ABS cat. no. 9309.0).<br />
78


