Chevron 2006 Annual Report
Chevron 2006 Annual Report
Chevron 2006 Annual Report
Create successful ePaper yourself
Turn your PDF publications into a flip-book with our unique Google optimized e-Paper software.
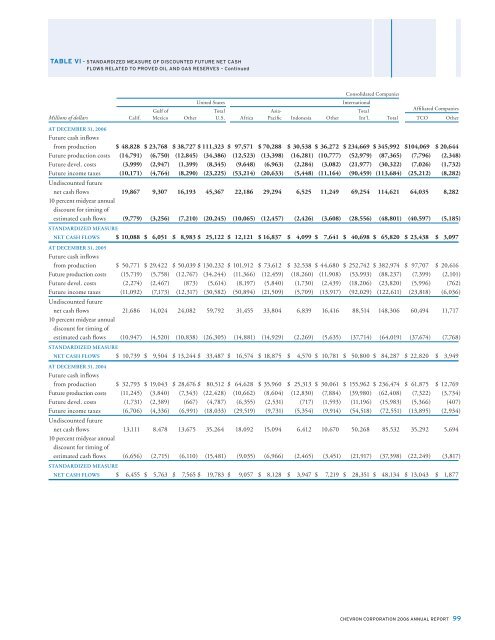
TABLE VI – STANDARDIZED MEASURE OF DISCOUNTED FUTURE NET CASH<br />
FLOWS RELATED TO PROVED OIL AND GAS RESERVES – Continued<br />
Consolidated Companies<br />
United States<br />
International<br />
Gulf of Total Asia- Total<br />
Affi liated Companies<br />
Millions of dollars Calif. Mexico Other U.S. Africa Pacific Indonesia Other Int’l. Total TCO Other<br />
AT DECEMBER 31, <strong>2006</strong><br />
Future cash inflows<br />
from production $ 48,828 $ 23,768 $ 38,727 $ 111,323 $ 97,571 $ 70,288 $ 30,538 $ 36,272 $ 234,669 $ 345,992 $ 104,069 $ 20,644<br />
Future production costs (14,791) (6,750) (12,845) (34,386) (12,523) (13,398) (16,281) (10,777) (52,979) (87,365) (7,796) (2,348)<br />
Future devel. costs (3,999) (2,947) (1,399) (8,345) (9,648) (6,963) (2,284) (3,082) (21,977) (30,322) (7,026) (1,732)<br />
Future income taxes (10,171) (4,764) (8,290) (23,225) (53,214) (20,633) (5,448) (11,164) (90,459) (113,684) (25,212) (8,282)<br />
Undiscounted future<br />
net cash flows 19,867 9,307 16,193 45,367 22,186 29,294 6,525 11,249 69,254 114,621 64,035 8,282<br />
10 percent midyear annual<br />
discount for timing of<br />
estimated cash flows (9,779) (3,256) (7,210) (20,245) (10,065) (12,457) (2,426) (3,608) (28,556) (48,801) (40,597) (5,185)<br />
STANDARDIZED MEASURE<br />
NET CASH FLOWS $ 10,088 $ 6,051 $ 8,983 $ 25,122 $ 12,121 $ 16,837 $ 4,099 $ 7,641 $ 40,698 $ 65,820 $ 23,438 $ 3,097<br />
AT DECEMBER 31, 2005<br />
Future cash inflows<br />
from production $ 50,771 $ 29,422 $ 50,039 $ 130,232 $ 101,912 $ 73,612 $ 32,538 $ 44,680 $ 252,742 $ 382,974 $ 97,707 $ 20,616<br />
Future production costs (15,719) (5,758) (12,767) (34,244) (11,366) (12,459) (18,260) (11,908) (53,993) (88,237) (7,399) (2,101)<br />
Future devel. costs (2,274) (2,467) (873) (5,614) (8,197) (5,840) (1,730) (2,439) (18,206) (23,820) (5,996) (762)<br />
Future income taxes (11,092) (7,173) (12,317) (30,582) (50,894) (21,509) (5,709) (13,917) (92,029) (122,611) (23,818) (6,036)<br />
Undiscounted future<br />
net cash flows 21,686 14,024 24,082 59,792 31,455 33,804 6,839 16,416 88,514 148,306 60,494 11,717<br />
10 percent midyear annual<br />
discount for timing of<br />
estimated cash flows (10,947) (4,520) (10,838) (26,305) (14,881) (14,929) (2,269) (5,635) (37,714) (64,019) (37,674) (7,768)<br />
STANDARDIZED MEASURE<br />
NET CASH FLOWS $ 10,739 $ 9,504 $ 13,244 $ 33,487 $ 16,574 $ 18,875 $ 4,570 $ 10,781 $ 50,800 $ 84,287 $ 22,820 $ 3,949<br />
AT DECEMBER 31, 2004<br />
Future cash inflows<br />
from production $ 32,793 $ 19,043 $ 28,676 $ 80,512 $ 64,628 $ 35,960 $ 25,313 $ 30,061 $ 155,962 $ 236,474 $ 61,875 $ 12,769<br />
Future production costs (11,245) (3,840) (7,343) (22,428) (10,662) (8,604) (12,830) (7,884) (39,980) (62,408) (7,322) (3,734)<br />
Future devel. costs (1,731) (2,389) (667) (4,787) (6,355) (2,531) (717) (1,593) (11,196) (15,983) (5,366) (407)<br />
Future income taxes (6,706) (4,336) (6,991) (18,033) (29,519) (9,731) (5,354) (9,914) (54,518) (72,551) (13,895) (2,934)<br />
Undiscounted future<br />
net cash flows 13,111 8,478 13,675 35,264 18,092 15,094 6,412 10,670 50,268 85,532 35,292 5,694<br />
10 percent midyear annual<br />
discount for timing of<br />
estimated cash flows (6,656) (2,715) (6,110) (15,481) (9,035) (6,966) (2,465) (3,451) (21,917) (37,398) (22,249) (3,817)<br />
STANDARDIZED MEASURE<br />
NET CASH FLOWS $ 6,455 $ 5,763 $ 7,565 $ 19,783 $ 9,057 $ 8,128 $ 3,947 $ 7,219 $ 28,351 $ 48,134 $ 13,043 $ 1,877<br />
CHEVRON CORPORATION <strong>2006</strong> ANNUAL REPORT 99


