Chevron 2006 Annual Report
Chevron 2006 Annual Report
Chevron 2006 Annual Report
Create successful ePaper yourself
Turn your PDF publications into a flip-book with our unique Google optimized e-Paper software.
Supplemental Information on Oil and Gas Producing Activities<br />
TABLE III – RESULTS OF OPERATIONS FOR OIL AND<br />
GAS PRODUCING ACTIVITIES 1<br />
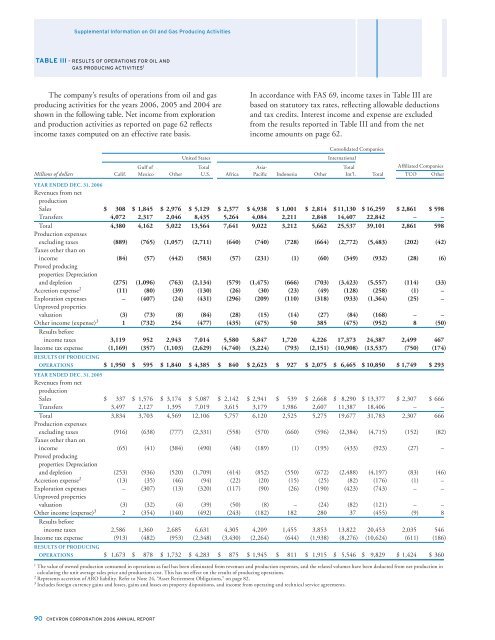
The company’s results of operations from oil and gas<br />
producing activities for the years <strong>2006</strong>, 2005 and 2004 are<br />
shown in the following table. Net income from exploration<br />
and production activities as reported on page 62 reflects<br />
income taxes computed on an effective rate basis.<br />
In accordance with FAS 69, income taxes in Table III are<br />
based on statutory tax rates, reflecting allowable deductions<br />
and tax credits. Interest income and expense are excluded<br />
from the results reported in Table III and from the net<br />
income amounts on page 62.<br />
Consolidated Companies<br />
United States<br />
International<br />
Gulf of Total Asia- Total Affi liated Companies<br />
Millions of dollars Calif. Mexico Other U.S. Africa Pacific Indonesia Other Int’l. Total TCO Other<br />
YEAR ENDED DEC. 31, <strong>2006</strong><br />
Revenues from net<br />
production<br />
Sales $ 308 $ 1,845 $ 2,976 $ 5,129 $ 2,377 $ 4,938 $ 1,001 $ 2,814 $ 11,130 $ 16,259 $ 2,861 $ 598<br />
Transfers 4,072 2,317 2,046 8,435 5,264 4,084 2,211 2,848 14,407 22,842 – –<br />
Total 4,380 4,162 5,022 13,564 7,641 9,022 3,212 5,662 25,537 39,101 2,861 598<br />
Production expenses<br />
excluding taxes (889) (765) (1,057) (2,711) (640) (740) (728) (664) (2,772) (5,483) (202) (42)<br />
Taxes other than on<br />
income (84) (57) (442) (583) (57) (231) (1) (60) (349) (932) (28) (6)<br />
Proved producing<br />
properties: Depreciation<br />
and depletion (275) (1,096) (763) (2,134) (579) (1,475) (666) (703) (3,423) (5,557) (114) (33)<br />
Accretion expense 2 (11) (80) (39) (130) (26) (30) (23) (49) (128) (258) (1) –<br />
Exploration expenses – (407) (24) (431) (296) (209) (110) (318) (933) (1,364) (25) –<br />
Unproved properties<br />
valuation (3) (73) (8) (84) (28) (15) (14) (27) (84) (168) – –<br />
Other income (expense) 3 1 (732) 254 (477) (435) (475) 50 385 (475) (952) 8 (50)<br />
Results before<br />
income taxes 3,119 952 2,943 7,014 5,580 5,847 1,720 4,226 17,373 24,387 2,499 467<br />
Income tax expense (1,169) (357) (1,103) (2,629) (4,740) (3,224) (793) (2,151) (10,908) (13,537) (750) (174)<br />
RESULTS OF PRODUCING<br />
OPERATIONS $ 1,950 $ 595 $ 1,840 $ 4,385 $ 840 $ 2,623 $ 927 $ 2,075 $ 6,465 $ 10,850 $ 1,749 $ 293<br />
YEAR ENDED DEC. 31, 2005<br />
Revenues from net<br />
production<br />
Sales $ 337 $ 1,576 $ 3,174 $ 5,087 $ 2,142 $ 2,941 $ 539 $ 2,668 $ 8,290 $ 13,377 $ 2,307 $ 666<br />
Transfers 3,497 2,127 1,395 7,019 3,615 3,179 1,986 2,607 11,387 18,406 – –<br />
Total 3,834 3,703 4,569 12,106 5,757 6,120 2,525 5,275 19,677 31,783 2,307 666<br />
Production expenses<br />
excluding taxes (916) (638) (777) (2,331) (558) (570) (660) (596) (2,384) (4,715) (152) (82)<br />
Taxes other than on<br />
income (65) (41) (384) (490) (48) (189) (1) (195) (433) (923) (27) –<br />
Proved producing<br />
properties: Depreciation<br />
and depletion (253) (936) (520) (1,709) (414) (852) (550) (672) (2,488) (4,197) (83) (46)<br />
Accretion expense 2 (13) (35) (46) (94) (22) (20) (15) (25) (82) (176) (1) –<br />
Exploration expenses – (307) (13) (320) (117) (90) (26) (190) (423) (743) – –<br />
Unproved properties<br />
valuation (3) (32) (4) (39) (50) (8) – (24) (82) (121) – –<br />
Other income (expense) 3 2 (354) (140) (492) (243) (182) 182 280 37 (455) (9) 8<br />
Results before<br />
income taxes 2,586 1,360 2,685 6,631 4,305 4,209 1,455 3,853 13,822 20,453 2,035 546<br />
Income tax expense (913) (482) (953) (2,348) (3,430) (2,264) (644) (1,938) (8,276) (10,624) (611) (186)<br />
RESULTS OF PRODUCING<br />
OPERATIONS $ 1,673 $ 878 $ 1,732 $ 4,283 $ 875 $ 1,945 $ 811 $ 1,915 $ 5,546 $ 9,829 $ 1,424 $ 360<br />
1 The value of owned production consumed in operations as fuel has been eliminated from revenues and production expenses, and the related volumes have been deducted from net production in<br />
calculating the unit average sales price and production cost. This has no effect on the results of producing operations.<br />
2 Represents accretion of ARO liability. Refer to Note 24, “Asset Retirement Obligations,” on page 82.<br />
3 Includes foreign currency gains and losses, gains and losses on property dispositions, and income from operating and technical service agreements.<br />
90 CHEVRON CORPORATION <strong>2006</strong> ANNUAL REPORT


