Chevron 2006 Annual Report
Chevron 2006 Annual Report
Chevron 2006 Annual Report
Create successful ePaper yourself
Turn your PDF publications into a flip-book with our unique Google optimized e-Paper software.
Supplemental Information on Oil and Gas Producing Activities<br />
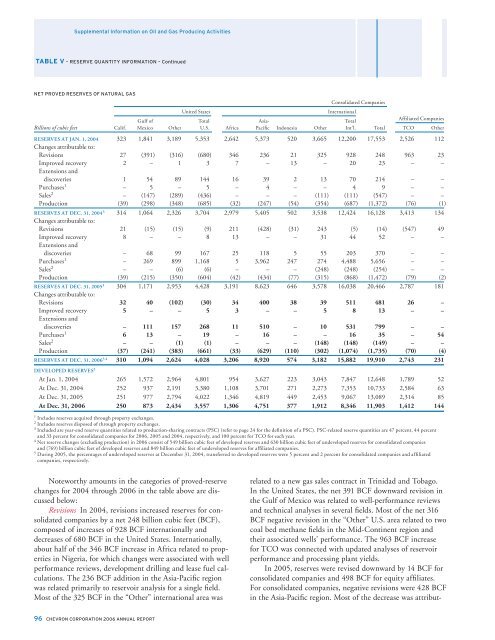
TABLE V – RESERVE QUANTITY INFORMATION – Continued<br />
NET PROVED RESERVES OF NATURAL GAS<br />
Consolidated Companies<br />
United States<br />
International<br />
Gulf of Total Asia- Total<br />
Affi liated Companies<br />
Billions of cubic feet Calif. Mexico Other U.S. Africa Pacific Indonesia Other Int’l. Total TCO Other<br />
RESERVES AT JAN. 1, 2004 323 1,841 3,189 5,353 2,642 5,373 520 3,665 12,200 17,553 2,526 112<br />
Changes attributable to:<br />
Revisions 27 (391) (316) (680) 346 236 21 325 928 248 963 23<br />
Improved recovery 2 – 1 3 7 – 13 – 20 23 – –<br />
Extensions and<br />
discoveries 1 54 89 144 16 39 2 13 70 214 – –<br />
Purchases 1 – 5 – 5 – 4 – – 4 9 – –<br />
Sales 2 – (147) (289) (436) – – – (111) (111) (547) – –<br />
Production (39) (298) (348) (685) (32) (247) (54) (354) (687) (1,372) (76) (1)<br />
RESERVES AT DEC. 31, 2004 3 314 1,064 2,326 3,704 2,979 5,405 502 3,538 12,424 16,128 3,413 134<br />
Changes attributable to:<br />
Revisions 21 (15) (15) (9) 211 (428) (31) 243 (5) (14) (547) 49<br />
Improved recovery 8 – – 8 13 – – 31 44 52 – –<br />
Extensions and<br />
discoveries – 68 99 167 25 118 5 55 203 370 – –<br />
Purchases 1 – 269 899 1,168 5 3,962 247 274 4,488 5,656 – –<br />
Sales 2 – – (6) (6) – – – (248) (248) (254) – –<br />
Production (39) (215) (350) (604) (42) (434) (77) (315) (868) (1,472) (79) (2)<br />
RESERVES AT DEC. 31, 2005 3 304 1,171 2,953 4,428 3,191 8,623 646 3,578 16,038 20,466 2,787 181<br />
Changes attributable to:<br />
Revisions 32 40 (102) (30) 34 400 38 39 511 481 26 –<br />
Improved recovery 5 – – 5 3 – – 5 8 13 – –<br />
Extensions and<br />
discoveries – 111 157 268 11 510 – 10 531 799 – –<br />
Purchases 1 6 13 – 19 – 16 – – 16 35 – 54<br />
Sales 2 – – (1) (1) – – – (148) (148) (149) – –<br />
Production (37) (241) (383) (661) (33) (629) (110) (302) (1,074) (1,735) (70) (4)<br />
RESERVES AT DEC. 31, <strong>2006</strong> 3,4 310 1,094 2,624 4,028 3,206 8,920 574 3,182 15,882 19,910 2,743 231<br />
DEVELOPED RESERVES 5<br />
At Jan. 1, 2004 265 1,572 2,964 4,801 954 3,627 223 3,043 7,847 12,648 1,789 52<br />
At Dec. 31, 2004 252 937 2,191 3,380 1,108 3,701 271 2,273 7,353 10,733 2,584 63<br />
At Dec. 31, 2005 251 977 2,794 4,022 1,346 4,819 449 2,453 9,067 13,089 2,314 85<br />
At Dec. 31, <strong>2006</strong> 250 873 2,434 3,557 1,306 4,751 377 1,912 8,346 11,903 1,412 144<br />
1 Includes reserves acquired through property exchanges.<br />
2 Includes reserves disposed of through property exchanges.<br />
3 Included are year-end reserve quantities related to production-sharing contracts (PSC) (refer to page 24 for the defi nition of a PSC). PSC-related reserve quantities are 47 percent, 44 percent<br />
and 33 percent for consolidated companies for <strong>2006</strong>, 2005 and 2004, respectively, and 100 percent for TCO for each year.<br />
4 Net reserve changes (excluding production) in <strong>2006</strong> consist of 549 billion cubic feet of developed reserves and 630 billion cubic feet of undeveloped reserves for consolidated companies<br />
and (769) billion cubic feet of developed reserves and 849 billion cubic feet of undeveloped reserves for affi liated companies.<br />
5 During 2005, the percentages of undeveloped reserves at December 31, 2004, transferred to developed reserves were 5 percent and 2 percent for consolidated companies and affi liated<br />
companies, respectively.<br />
Noteworthy amounts in the categories of proved-reserve<br />
changes for 2004 through <strong>2006</strong> in the table above are discussed<br />
below:<br />
Revisions In 2004, revisions increased reserves for consolidated<br />
companies by a net 248 billion cubic feet (BCF),<br />
composed of increases of 928 BCF internationally and<br />
decreases of 680 BCF in the United States. Internationally,<br />
about half of the 346 BCF increase in Africa related to properties<br />
in Nigeria, for which changes were associated with well<br />
performance reviews, development drilling and lease fuel calculations.<br />
The 236 BCF addition in the Asia-Pacific region<br />
was related primarily to reservoir analysis for a single field.<br />
Most of the 325 BCF in the “Other” international area was<br />
related to a new gas sales contract in Trinidad and Tobago.<br />
In the United States, the net 391 BCF downward revision in<br />
the Gulf of Mexico was related to well-performance reviews<br />
and technical analyses in several fields. Most of the net 316<br />
BCF negative revision in the “Other” U.S. area related to two<br />
coal bed methane fields in the Mid-Continent region and<br />
their associated wells’ performance. The 963 BCF increase<br />
for TCO was connected with updated analyses of reservoir<br />
performance and processing plant yields.<br />
In 2005, reserves were revised downward by 14 BCF for<br />
consolidated companies and 498 BCF for equity affi liates.<br />
For consolidated companies, negative revisions were 428 BCF<br />
in the Asia-Pacific region. Most of the decrease was attribut-<br />
96 CHEVRON CORPORATION <strong>2006</strong> ANNUAL REPORT


