English - DFDS
English - DFDS
English - DFDS

You also want an ePaper? Increase the reach of your titles
YUMPU automatically turns print PDFs into web optimized ePapers that Google loves.
<strong>DFDS</strong> annual report 2009 HEADER 1<br />
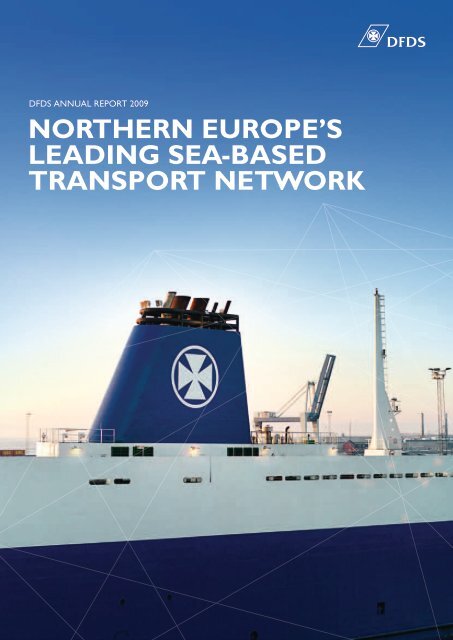
<strong>DFDS</strong> ANNUAL REPORT 2009<br />
NORTHERN EUROPE’S<br />
LEADING SEA-BASED<br />
TRANSPORT NETWORK
2 HEADER<br />
<strong>DFDS</strong> annual report 2009<br />
<strong>DFDS</strong> – Northern Europe’s leading sea-based transport network<br />
<strong>DFDS</strong>’ shipping network integrates freight and passenger services: We deliver high frequency and reliable<br />
freight services to haulage and forwarding companies. We develop and deliver industrial logistics solutions<br />
in close co-operation with producers of heavy industrial goods. For passengers, we provide transport<br />
services for passengers travelling by car and a maritime onboard experience.<br />
<strong>DFDS</strong> employs approximately 3,900 people and operates a fleet of approximately 50 ships.<br />
<strong>DFDS</strong> was founded in 1866, is headquatered in Copenhagen and listed on NASDAQ OMX Copenhagen.<br />
3<br />
4<br />
6<br />
7<br />
8<br />
10<br />
16<br />
18<br />
24<br />
28<br />
32<br />
36<br />
40<br />
42<br />
44<br />
46<br />
48<br />
50<br />
56<br />
57<br />
58<br />
60<br />
62<br />
63<br />
108<br />
109<br />
110<br />
112<br />
114<br />
116<br />
118<br />
management report<br />
<strong>DFDS</strong> 2009<br />
Route network<br />
Key Figures<br />
Foreword<br />
Vision, strategy and goals<br />
Management report<br />
<strong>DFDS</strong>’ external world<br />
Ro-Ro Shipping<br />
Container Shipping<br />
Passenger Shipping<br />
Terminal Services<br />
Trailer Services<br />
FSS – Customer focus<br />
Environment report (CSR)<br />
HR report (CSR)<br />
Shareholder information<br />
Risk factors<br />
Financial review<br />
financial statements<br />
Income statement<br />
Comprehensive income<br />
Balance sheet<br />
Statement of changes in equity<br />
Cash flow statement<br />
Notes<br />
<strong>DFDS</strong> Group Companies<br />
Statements<br />
management report, other<br />
Fleet list<br />
Commercial duties<br />
Executive management<br />
Corporate Governance in <strong>DFDS</strong><br />
Definitions and glossary
<strong>DFDS</strong> annual report 2009 HEADER 3<br />
2009 was a challenging year where dfds achieved<br />
a result that was among the best in our sector.<br />
We took a decisive step towards our vision of a<br />
European sea-based transport network through<br />
the acquisition of Norfolkline, and <strong>DFDS</strong> is<br />
now strongly positioned to fulfill the future<br />
expectations of our customers.<br />
2010 will be a challenging and exciting year with<br />
focus on navigating through continued difficult<br />
market conditions and on the first phase of<br />
integrating <strong>DFDS</strong> and Norfolkline.<br />
REVENUE<br />
(DKK BILLION)<br />
PRE-TAX PROFIT<br />
(DKK MILLION)<br />
RETURN ON INVESTED CAPITAL (ROIC)<br />
(%)<br />
10<br />
9<br />
8<br />
7<br />
6<br />
5<br />
4<br />
3<br />
2<br />
1<br />
0<br />
600<br />
500<br />
400<br />
300<br />
200<br />
100<br />
0<br />
10<br />
9<br />
8<br />
7<br />
6<br />
5<br />
4<br />
3<br />
2<br />
1<br />
0<br />
2005<br />
2006<br />
2007<br />
2008<br />
2009<br />
2005<br />
2006<br />
2007<br />
2008<br />
2009<br />
2005<br />
2006<br />
2007<br />
2008<br />
2009
<strong>DFDS</strong> annual report 2009<br />
4 HEADER<br />
ROTTERDAM<br />
RATINGEN<br />
OSLO<br />
KRISTIANSAND<br />
BREVIK<br />
IMMINGHAM<br />
DUBLIN<br />
ROTTERDAM<br />
ROTTERDAM<br />
ROTTERDAM<br />
RATINGEN<br />
OSLO<br />
KRISTIANSAND<br />
BREVIK<br />
IMMINGHAM<br />
DUBLIN<br />
MIDDLESBROUGH<br />
MIDDLESBROUGH<br />
ESBJERG<br />
ROTTERDAM<br />
OSLO<br />
KRISTIANSAND<br />
BREVIK<br />
IMMINGHAM<br />
MOSS<br />
ESBJERG<br />
ROTTERDAM<br />
ROTTERDAM<br />
ROTTERDAM<br />
OSLO<br />
KRISTIANSAND<br />
BREVIK<br />
IMMINGHAM<br />
MOSS<br />
HARWICH<br />
ESBJERG<br />
OSLO<br />
AMSTERDAM (IJMUIDEN)<br />
HARWICH<br />
ESBJERG<br />
OSLO<br />
NEWCASTLE<br />
NEWCASTLE<br />
NEWCASTLE<br />
NEWCASTLE<br />
NEWCASTLE<br />
NEWCASTLE<br />
AMSTERDAM (IJMUIDEN)<br />
ZEEBRUGGE<br />
AVONMOUTH<br />
HALDEN<br />
WATERFORD<br />
BELFAST<br />
GREENOCK<br />
BILBAO<br />
DUBLIN<br />
SKOGN<br />
AVONMOUTH<br />
LIVERPOOL<br />
LIVERPOOL<br />
HALDEN<br />
WATERFORD<br />
BELFAST<br />
GREENOCK<br />
BILBAO<br />
DUBLIN<br />
SKOGN<br />
ZEEBRUGGE<br />
KRISTIANSAND<br />
KRISTIANSAND<br />
BREVIK<br />
BREVIK<br />
OSLO<br />
OSLO<br />
MOSS<br />
MOSS<br />
ROTTERDAM<br />
ROTTERDAM<br />
ROTTERDAM<br />
ROTTERDAM<br />
IMMINGHAM<br />
IMMINGHAM<br />
HARWICH<br />
KIEL<br />
ESBJERG<br />
CUXHAVEN<br />
ROTTERDAM<br />
IMMINGHAM<br />
HARWICH<br />
FREDERICIA<br />
FREDERICIA<br />
KIEL<br />
ESBJERG<br />
CUXHAVEN<br />
ROTTERDAM<br />
IMMINGHAM<br />
BREVIK<br />
BREVIK<br />
AARHUS<br />
AARHUS<br />
HAMBURG<br />
HAMBURG<br />
GHENT<br />
GHENT<br />
COPENHAGEN<br />
COPENHAGEN<br />
GOTHENBURG<br />
GOTHENBURG<br />
SASSNITZ<br />
(MUKRAN)<br />
SASSNITZ<br />
(MUKRAN)<br />
CHATHAM<br />
CHATHAM<br />
TILBURY<br />
TILBURY<br />
4<br />
<strong>DFDS</strong> Route<br />
Network<br />
<strong>DFDS</strong> Route NETWORK<br />
Per March 2010
<strong>DFDS</strong> annual report 2009 <strong>DFDS</strong> Route NETWORK HEADER<br />
5<br />
HAMINA<br />
ST. PETERSBURG<br />
KARLSHAMN<br />
MOSCOW<br />
KLAIPEDA<br />
BALTIYSK<br />
RELIABILITY<br />
FREQUENCY<br />
CAPACITY
6 KEY FIGURES<br />
<strong>DFDS</strong> annual report 2009<br />
Key Figures <strong>DFDS</strong> Group<br />
Key Figures<br />
DKK millION 2005 2006 2007 2008 2009<br />
2009<br />
EUR miLLION 1<br />
Income statement<br />
Revenue 2 6,278 7,524 8,310 8,194 6,555 881<br />
n Ro-Ro Shipping 3,471 3,680 3,799 2,997 403<br />
n Container Shipping 1,293 1,623 1,636 1,165 157<br />
n Passenger Shipping 1,838 1,932 1,779 1,620 218<br />
n Terminal Services 706 703 647 555 75<br />
n Trailer Services 918 986 963 776 104<br />
n Tramp 117 106 38 - -<br />
n Non-allocated items 131 172 176 189 25<br />
n Eliminations -950 -892 -844 -747 -101<br />
Operating profit before depreciation (EBITDA) 2 890 1,137 1,311 1,011 786 106<br />
n Ro-Ro Shipping 794 914 784 519 70<br />
n Container Shipping 128 133 81 5 1<br />
n Passenger Shipping 242 249 194 314 42<br />
n Terminal Services 12 12 -31 -14 -2<br />
n Trailer Services 15 56 31 36 5<br />
n Tramp -4 9 8 - -<br />
n Non-allocated items -50 -62 -56 -74 -10<br />
Profit on disposal of tangible assets 29 33 37 45 18 2<br />
Operating profit (EBIT) 433 587 758 467 174 23<br />
Financing, net -202 -193 -232 -246 -154 -21<br />
Profit before tax 231 402 526 221 20 3<br />
Profit for the period 193 364 412 253 89 12<br />
Profit for the period after minority interests 175 352 400 247 86 12<br />
Profit for analytical purposes 182 348 485 227 23 3<br />
Capital<br />
Total assets 8,457 9,991 9,610 8,610 9,298 1,249<br />
<strong>DFDS</strong> A/S' share of the equity 2,803 3,154 3,538 3,414 3,641 489<br />
Total equity 2,904 3,265 3,653 3,484 3,688 496<br />
Net interest bearing debt 3,970 4,654 3,828 3,425 4,067 547<br />
Invested capital, average 6,667 7,796 8,107 7,663 7,762 1,043<br />
Average number of employees 4,215 4,346 4,427 4,301 3,924 -<br />
Cash flow<br />
Cash flow from operating activities before finance and after tax 711 1,167 1,264 983 836 112<br />
Cash flow from investments -855 -1,698 -151 -345 -1,304 -175<br />
n Acquisition of companies, activities and minority interests -328 -306 -35 -40 -39 -5<br />
n Other investments -527 -1,392 -116 -305 -1,265 -170<br />
Free cash flow -144 -531 1,113 638 -468 -63<br />
Operations and return<br />
Number of operating ships 66 68 64 60 51<br />
Revenue growth, % 9.7 19.8 10.5 -1.4 -20.0<br />
EBITDA-margin, % 14.2 15.1 15.8 12.3 12.0<br />
Operating margin, % 6.9 7.8 9.1 5.7 2.7<br />
Invested capital turnover rate, times 0.94 0.97 1.03 1.07 0.84<br />
Return on invested capital (ROIC) p.a., % 6.0 7.0 8.6 5.9 2.1<br />
Return on equity p.a., % 6.8 11.7 14.5 6.5 0.7<br />
Capital and per share<br />
Equity ratio, % 34.3 32.7 38.0 40.5 39.7<br />
Financial gearing, times 1.42 1.48 1.08 1.00 1.12<br />
Earnings per share (EPS), DKK 23 46 52 32 11<br />
Dividend per share, DKK 7.5 11.0 15.0 0.0 0.0<br />
Number of shares at the end of the period, '000 8,000 8,000 8,000 8,000 8,000<br />
Share price at the end of the period, DKK 382 680 790 399 358<br />
Market value, DKK mill. 3,056 5,440 6,320 3,192 2,864<br />
1) Applied exchange rate for euro as of 31 December 2009: 744.15<br />
2) During 2007 a new business area structure was introduced and comparative figures per business area are only available from 2006.
<strong>DFDS</strong> annual report 2009 FOREWORD 7<br />
ROUGH WATERS<br />
AND EXPANSION<br />
We achieved a result for 2009 among the best in the<br />
sector, and we took a decisive step towards our vision<br />
of a European, sea-based transport network.<br />
Early in 2009, when it became clear that the global recession would<br />
inevitably cause a significant decline in financial performance, we set<br />
ourselves the financial goal of achieving one of the best results in<br />
the sector. As a result of a great team effort, a number of significant<br />
operational adjustments and <strong>DFDS</strong>’ strategically solid market position<br />
in Northern Europe, we have met this goal.<br />
Rough waters<br />
Our business model was challenged in 2009 by the historically steep<br />
decline in freight volume at the start of the year caused by the<br />
recession. In all material respects, our strategy and business model<br />
have been validated. This applies to the value of a network of routes<br />
that reduces the vulnerability of each individual activity, and also to<br />
integrated passenger and freight routes. It applies to our capacity to<br />
secure freight volumes through long-term industrial contracts and our<br />
own trailer business, plus the insight and understanding of the freight<br />
market that follows. On top of this comes our focus on creating value<br />
for freight customers through solutions that cuts across business areas.<br />
Finally, our increasingly integrated management model has ensured an<br />
effective implementation of operational adjustments.<br />
However, the recession has also raised questions about the flexibility<br />
of our tonnage. Our business model must be able to handle the<br />
sudden fluctuations that undoubtedly from time to time will impact<br />
the market. One priority is to optimise our ability to plan and manage<br />
the balance between owned and chartered tonnage, particularly with<br />
regard to the flexibility from timing of the return or extension of<br />
chartered tonnage.<br />
Bent Østergaard<br />
CHAIRMAN OF THE BOARD<br />
NIELS SMEDEGAARD<br />
PRESIDENT AND CEO<br />
Expansion<br />
<strong>DFDS</strong>’ network strategy is the driving force behind the acquisition of<br />
Norfolkline. This acquisition will enable us to achieve significant economies<br />
of scale and make progress toward our vision of a European, seabased<br />
transport network. The merger of our companies will generate<br />
significant synergies, and we expect that the transaction will enhance<br />
our profitability as soon as the market recovers. The acquisition is still<br />
subject to approval by the relevant competition authorities.<br />
Thank you!<br />
An unusually low degree of visibility characterised 2009, and a degree<br />
of uncertainty still surrounds the future economic outlook. In this<br />
situation, we are therefore particularly grateful for the loyalty and<br />
perseverance of our staff, customers, shareholders and other partners.
8 STRATEGY<br />
<strong>DFDS</strong> annual report 2009<br />
From routes<br />
to networks<br />
<strong>DFDS</strong>’ vision<br />
n A European, sea-based transport network that provides<br />
competitive, differentiated and value-generating transport<br />
solutions to freight customers and passengers.<br />
n A challenging and attractive workplace for our staff.<br />
n A company with stable and rising profitability, which<br />
generates value for our shareholders.<br />
n A responsible, environmentally oriented company engaged<br />
in constructive dialogue with the world at large.<br />
The increasing size of freight customers encourages consolidation in<br />
order to support delivery of competitive transport solutions. These<br />
require wide market coverage, innovative customer concepts and efficient<br />
information systems. There is also a need for ongoing streamlining<br />
of operations in order to achieve lower unit costs.<br />
The process of consolidation is also underpinned by the need for<br />
risk diversification, which includes reducing dependence on individual<br />
activities. Larger units also require more resources for system and<br />
concept development, as well as the financial capacity to invest in<br />
larger, more specialised tonnage. In addition, the distribution of fixed<br />
costs across larger volumes produces financial advantages in terms<br />
of lower unit costs.<br />
Strategy<br />
A European, sea-based transport network that provides competitive,<br />
differentiated and value-generating transport solutions to freight<br />
customers and passengers.<br />
To achieve this vision, <strong>DFDS</strong> has the following key strategic objectives:<br />
1. Building the leading sea-based European transport and<br />
logistics network<br />
2. Integrating value-generating solutions for freight customers<br />
and passengers<br />
3. Securing volumes through logistics services and strategic port access<br />
4. Maintaining a constant focus on quality and efficiency of operations.<br />
Below, the market and competitive situation and the four key strategies<br />
are detailed.<br />
The market and competition<br />
The current economic slowdown has resulted in a significant decline in<br />
demand in virtually all segments of the transport market, which is generally<br />
fragmented and characterised by a high level of competition. This<br />
trend has therefore reinforced the need for consolidation of the market<br />
in order to improve operating efficiency and profitability.<br />
More fundamentally, a key driver in the market is the need to realise<br />
the advantages of greater geographic reach related to particularly<br />
four factors:<br />
n Freight customers (i.e. transport and production companies) are<br />
growing larger and developing more complex supply chains<br />
n Risk diversification<br />
n Resources for system and concept development,<br />
as well as investment in new tonnage<br />
n Reduction of unit costs.<br />
The four key strategies<br />
The vision is to position <strong>DFDS</strong> as a European, sea-based transport<br />
network, based on four key strategies:<br />
Building a European, sea-based transport network: The network<br />
will be expanded to include more regions in Northern Europe to<br />
improve the competitiveness of solutions for transport and production<br />
companies. An expanded network will also provide opportunities<br />
for operational synergies.<br />
Value-generating, integrated customer solutions for freight and<br />
passengers: Combined freight and passenger shipping enables gain<br />
of higher market shares and exploitation of synergies by using the<br />
same tonnage to transport both freight and passengers. Integrating<br />
transport systems for freight also improves competitiveness towards<br />
more customer segments.<br />
Securing volumes and port access: In order to achieve a stable, highcapacity<br />
utilisation of the route network, freight volumes are procured<br />
through longer-term partnership agreements with major manufacturers,<br />
and through shorter-term agreements with trailer operators. Capacity<br />
utilisation on selected routes is also underpinned by <strong>DFDS</strong>’ own trailer<br />
operations, which offer solutions that utilise the Group’s network. Access<br />
to and operation of own port terminals in selected locations also<br />
secures the efficiency, stability and growth potential of the network.<br />
Focus on operations: The safe, efficient operation of freight and<br />
passenger ships is a central operational competence in <strong>DFDS</strong>, and<br />
one that must be constantly maintained and developed. Maintaining<br />
competitive costs and continuous adaptation to market conditions are<br />
also key focus areas, as well as competences associated with operation<br />
of port terminals and trailer operations.
<strong>DFDS</strong> annual report 2009 STRATEGY 9<br />
Implementation<br />
GROUP MANAGEMENT<br />
Implementation of the strategy involves three primary focus areas:<br />
n Expansion of the route network to more regions in Northern Europe,<br />
particularly in and around the Baltic Sea<br />
n Integration of passenger activities in the network<br />
n Securing higher volumes.<br />
RO-RO<br />
SHIPPING<br />
CONTAINER<br />
SHIPPING<br />
PASSENGER<br />
SHIPPING<br />
TERMINAL<br />
SERVICES<br />
TRAILER<br />
SERVICES<br />
The route network will mainly be expanded through acquisitions, which<br />
will also serve to consolidate the network in selected areas. Both these<br />
objectives are supported by the acquisition of Norfolkline.<br />
Approval of the Norfolkline acquisition will limit the need to make<br />
further major acquisitions related to the United Kingdom and the<br />
North Sea. Future expansion of the route network will therefore<br />
focus on other European regions in which <strong>DFDS</strong> will be able to reap<br />
benefits from a larger network.<br />
<strong>DFDS</strong>’s passenger competences, which have been built up primarily<br />
through cruise-ferry activities, are now to a greater extent employed<br />
across both cruise-ferry and ro-pax concepts. This development will<br />
continue, and it is expected that growth within passenger activities will<br />
be driven first and foremost by ro-pax-oriented concepts.<br />
Securing volumes for the route network is done in three ways.<br />
Firstly, co-operation agreements and relationships with transport<br />
companies will continue to be developed to mutual advantage.<br />
Secondly, the aim is to continue to grow the proportion of industrial<br />
logistics through more and longlasting partnerships. Thirdly, <strong>DFDS</strong>’<br />
own trailer activities will be selectively expanded to add volume on<br />
specific routes, which the expected acquisition of Norfolkline also will<br />
contribute to.<br />
Business structure<br />
<strong>DFDS</strong>’ business structure consists of five areas: The business areas<br />
Ro-Ro Shipping, Container Shipping and Passenger Shipping are<br />
responsible for different activities on the route network as a whole,<br />
while the business areas Terminal Services and Trailer Services<br />
support the network.<br />
The sale of freight solutions across business areas and the network<br />
in general is co-ordinated by a separate organisational unit, Freight<br />
Sales Solutions.<br />
Financial targets<br />
FREIGHT SALES SOLUTIONS<br />
GROUP FUNCTIONS<br />
<strong>DFDS</strong>’ long-term financial objective is a return on invested capital<br />
(ROIC) on a level that exceeds the Group’s cost of capital by 30-50 %.<br />
The cost of capital (WACC) in the beginning of 2010 was calculated at<br />
6.5 %. This includes a risk-free interest rate of 3.75 %, equivalent to a tenyear<br />
Danish government bond, a market risk premium of 5.0 %, a beta<br />
value of 0.94, a borrowing rate before tax of 5.0 %, a tax rate of 10.5 %<br />
and a capital structure with a 50/50 distribution. The capital structure<br />
is the ratio between equity and net interest-bearing debt. The management<br />
report contained in this annual report for 2009 outlines the<br />
current and long-term achievement of these objectives.<br />
It is furthermore an objective to maintain a solidity of<br />
approximately 40 %.
10 Management Report<br />
<strong>DFDS</strong> annual report 2009<br />
Management<br />
Report<br />
n Market conditions impacted by the recession in 2009<br />
n Adjustment of activities to the market situation<br />
continued throughout the year<br />
n Acquisition of Norfolkline is initial culmination<br />
of network strategy<br />
Financial performance<br />
Financial performance in 2009 was impacted by the recession, which<br />
began with a rapid and steep decline, particularly in the freight market,<br />
at the end of Q4 2008. This caused a significant downturn in H1<br />
2009 and led to widespread uncertainty about future market trends.<br />
Visibility and consensus about expectations did not begin to improve<br />
until Q3 2009. Large fluctuations in oil prices and exchange rates also<br />
had an impact on performance.<br />
Against this background, the pre-tax profit forecast for 2009 for<br />
<strong>DFDS</strong> was set at approximately zero, a forecast that subsequently was<br />
maintained throughout the year.<br />
The full-year pre-tax profit of DKK 20 million is therefore in<br />
line with expectations. Performance in 2009 was not satisfactory<br />
compared to <strong>DFDS</strong>’ long-term financial objective, but it is considered<br />
satisfactory given the extraordinary market conditions and the performance<br />
of comparable companies.<br />
Revenue for the year was DKK 6.6 billion, down 20 % compared to<br />
2008. This was likewise in line with the latest expectations published at<br />
the end of Q3 2009. Adjusted for oil-price supplements, revenue was<br />
15 % lower than 2008.<br />
Tonnage investments increased total Group assets by 8 % to DKK 9.3<br />
billion at the end of 2009. Equity was DKK 3.7 billion, corresponding to<br />
an equity ratio of 40 %.<br />
The average number of staff fell by 9 % to 3,924 in 2009. This<br />
reduction was due to operational changes, including the full-year effect<br />
of changes made in 2008.<br />
Financial performance per business area<br />
The Group’s lower performance was primarily due to a downturn in<br />
the largest business area, Ro-Ro Shipping. Operating profit (EBIT) in<br />
this area was DKK 232 million, compared to DKK 550 million in 2008<br />
– a decrease of 58 %.<br />
The lower EBIT in Ro-Ro Shipping can be attributed to an overall<br />
volume decrease of 11 % and widespread pressure on prices. Capacity<br />
was adjusted throughout the year, but not in proportion with the<br />
decrease in volume, which reduced capacity utilisation and earnings<br />
per unit.<br />
EBIT in Container Shipping fell by DKK 6 million, which also<br />
contributed to the lower performance. The results for both 2009 and<br />
2008 contain substantial one-off items. Adjusted for these items, EBIT<br />
was reduced to DKK -8 million from DKK 9 million in 2008, primarily<br />
due to a collapse of the charter market and lower paper volumes.<br />
Despite the market conditions, financial performance for the business<br />
unit’s other activities improved as a result of changes made in 2008.<br />
Financial performance improved in the three other business<br />
units in 2009.<br />
Passenger Shipping’s EBIT improved to DKK 103 million from<br />
DKK 15 million in 2008. This was due to the full-year effect of the<br />
restructuring implemented in 2008; an increase in passenger numbers<br />
on the Amsterdam route; and lower bunker costs, including income<br />
from hedging bunkers.<br />
Terminal Services’ EBIT improved by DKK 18 million to DKK -34<br />
million in 2009. The 2008 figure contained a one-off item at DKK 33<br />
million. Adjusted for this, the result was DKK 15 million lower in 2009.<br />
The port terminals’ EBIT was negatively affe cted by lower volumes on<br />
<strong>DFDS</strong>’ own routes, as well as by lower third-party volumes.<br />
Trailer Services’ EBIT increased to DKK 11 million from DKK 7<br />
million in 2008, as a result of improved earnings by the Belgian trailer<br />
operator and progress on activities in the Netherlands, Germany and<br />
Great Britain. Lower volumes and traffic imbalances led to a considerable<br />
decline in Swedish operations.<br />
The cost of non-allocated items amounted to DKK 103 million,<br />
an increase of DKK 42 million. This can be attributed to impairment<br />
on laid-up tonnage and transaction costs for the expected acquisition<br />
of Norfolkline.<br />
Expected acquisition of Norfolkline<br />
On 17 December 2009, <strong>DFDS</strong> entered into an agreement with A.P.<br />
Moller - Maersk to acquire 100 % of the shares in Norfolk Holdings<br />
BV. Completion of the transaction remains subject to approval from<br />
relevant competition authorities, the implementation of a rights issue<br />
and a directed rights issue. The transaction is currently expected to be<br />
completed by the end of Q2 2010.<br />
Planning work has begun on the integration of <strong>DFDS</strong> and Norfolkline,<br />
while the actual integration process only can begin upon receival<br />
of approval from the competition authorities. Employees from both<br />
companies are participating in the integration planning.<br />
The aim of the planning process is to further develop the initial<br />
integration plan enabling the integration process to start immediately<br />
once the transaction has been completed.<br />
For a more detailed description of the transaction, please refer to<br />
<strong>DFDS</strong>’ website (www.dfds.com), where a company announcement and<br />
presentation regarding the transaction announced on 17 December<br />
2009 are available.
<strong>DFDS</strong> annual report 2009 Management Report 11<br />
When the transaction was announced it was contingent on a condition<br />
concerning approval by <strong>DFDS</strong>’ extraordinary general meeting<br />
to approve the rights issue and the directed rights issue. Both issues<br />
were approved at the extraordinary general meeting held on 11<br />
January 2010.<br />
Strategy follow-up<br />
The expected acquisition of Norfolkline represents the initial culmination<br />
of <strong>DFDS</strong>’ network strategy, which was drawn up in 2007 and based<br />
on a vision of creating a European, sea-based transport network. The<br />
strategy and its objectives are described in greater detail on page 8-9.<br />
Strategically, 2010 and 2011 is expected to be dominated by two<br />
main objectives: integrating <strong>DFDS</strong> and Norfolkline, and improving<br />
ROIC in <strong>DFDS</strong>’ existing activities.<br />
As announced at the time of the acquisition, integration of the<br />
two companies is expected to last two to three years. However,<br />
most of the process will be completed in the first two years. During<br />
this period, <strong>DFDS</strong>’ resources will primarily be focused on integration,<br />
so no major acquisitions or investments are expected in this period.<br />
However, opportunities to pursue acquisitions arise continuously, and<br />
smaller acquisitions that underpin the network strategy cannot be<br />
ruled out.<br />
The second main strategic objective relates to achieving a higher<br />
ROIC from existing activities. This is dependent partly on implementation<br />
of structural changes to activities, as well as ongoing operational<br />
changes and improvement in the difficult market conditions caused by<br />
the recession.<br />
<strong>DFDS</strong> implemented a streamlining process in 2008 and 2009, as<br />
outlined below, and Ro-Ro Shipping’s tonnage has been modernised. A<br />
recovery in the freight market and subsequent higher volumes are not<br />
expected to result in a need for new tonnage in 2010 or 2011.<br />
It is foreseen that the planned integration of Norfolkline will help<br />
to solve structural earnings problems on routes in the southern part<br />
of the North Sea. In addition, there is also a need to restructure certain<br />
routes in the Baltic Sea and phase out excess tonnage.<br />
A more focused financial control process was initiated at the end<br />
of 2009 with the aim of intensifying focus on areas of activity with low<br />
earnings. This process is expected to help improve operations in all<br />
business areas.<br />
REVENUE PER<br />
BUSINESS AREA<br />
2009<br />
RETURN ON INVESTED CAPITAL (ROIC)<br />
AND CAPITAL COST (WACC)<br />
(%)<br />
9<br />
8<br />
7<br />
6<br />
5<br />
4<br />
RO-RO SHIPPING (42 %)<br />
CONTAINER SHIPPING (16 %)<br />
PASSENGER SHIPPING (23 %)<br />
TERMINAL SERVICES (8 %)<br />
TRAILER SERVICES (11 %)<br />
3<br />
2<br />
1<br />
0<br />
2005<br />
2006<br />
2007<br />
2008<br />
2009<br />
WACC<br />
ROIC
12 Management Report<br />
<strong>DFDS</strong> annual report 2009<br />
Adjustment of activities continued in 2009<br />
Changes to operations in 2009/2010<br />
Since the start of H2 2008 and throughout 2009, <strong>DFDS</strong>’ activities have<br />
been continuously adjusted in response to the market conditions arising<br />
from the recession.<br />
These changes were primarily designed to reduce the capacity of<br />
the route network by returning or chartering out excess tonnage and<br />
reducing the number of sailings. Operating costs have been reduced<br />
by making changes to ship operations and by renegotiating port and<br />
charter agreements. In addition, the head office and freight agency<br />
were adapted for a lower level of activity, and sales efforts, particularly<br />
those related to industrial customers, were intensified.<br />
The adjacent table shows the main changes to operations in 2009.<br />
Further opportunities for adjustment have been identified should<br />
the level of activity be further weakened in 2010.<br />
More efficient ship operations – Project Lightship<br />
In addition to the ongoing process of adjustment outlined above,<br />
“Project Lightship” was launched in May 2009 in order to further<br />
improve <strong>DFDS</strong>’ competitiveness. Its objective is to streamline ship<br />
operations and achieve annual savings of DKK 100 million from 2010<br />
onwards. The project covers the following work streams:<br />
n Staffing<br />
n Bunker optimisation<br />
n Port calls<br />
n Maintenance<br />
n Purchasing and supplies<br />
n Management systems.<br />
Three major changes were made to staffing levels in H2 2009:<br />
n A new plan for crews on ships flying under the Danish flag, which<br />
entails the simplification of onboard tasks related to maintenance,<br />
supplies and administration, including changes in the allocation of<br />
duties between land and sea. The plan led to 30 positions being<br />
abolished in Q3.<br />
n A similar plan was introduced on Lithuanian ships, where 23 jobs<br />
were abolished in Q3.<br />
Progress is also being made in Project Lightship’s other work streams,<br />
and especially within bunker optimisation, purchasing and supplies and<br />
maintenance savings were achieved in 2009. The project mainly covers<br />
activities in the Ro-Ro Shipping and Passenger Shipping business units.<br />
Area of ADJUSTMENT<br />
Reduction of capacity on the<br />
network of routes, including<br />
returning and chartering out<br />
of excess tonnage<br />
Reduction of operating costs<br />
Adaptation to lower levels<br />
of activity<br />
Focus on sales activities<br />
ADJUSTMENT<br />
n Return of chartered freight ships:<br />
- 3 ro-ro<br />
- 3 sideport<br />
- 2 container<br />
- 5 tramp<br />
n Agreement reached to charter out<br />
two ro-ro ships to Norfolkline in 2010<br />
n One passenger ship chartered out<br />
in February 2010<br />
n One ro-pax ship laid up<br />
n Number of weekly sailings reduced<br />
on several routes<br />
n Extension of voyage time on several<br />
routes<br />
n Optimisation of bunker consumption<br />
n Renegotiation of port agreements<br />
n Renegotiation of charter agreements<br />
n 10 % of positions in <strong>DFDS</strong> HQ<br />
abolished, corresponding to 27 jobs<br />
n Land-based organisation in Klaipeda,<br />
Lithuania, reduced by five posts<br />
n Number of posts in the port terminal<br />
at Immingham reduced by 95<br />
n 20 Danish ship officers, corresponding<br />
to 10 officer positions, was made<br />
redundant in Q4 as a consequence<br />
of a reduction of the fleet<br />
n Price changes<br />
n Cross-selling<br />
n New paper-industry contract<br />
n New car- and steel-industry<br />
contracts
<strong>DFDS</strong> annual report 2009 Ledelsens beretning 13
14 Management Report<br />
<strong>DFDS</strong> annual report 2009<br />
Financial goals<br />
ROIC (return on invested capital) declined to 2.1 % in 2009 from 5.9 %<br />
in 2008. The return was therefore lower than <strong>DFDS</strong>’ cost of capital<br />
(WACC), which was calculated at 7.0 % at the start of 2009. WACC at<br />
the start of 2010 was calculated at 6.5 %, down half a percentage point<br />
from last year, which is mainly due to lower interest rates.<br />
<strong>DFDS</strong>’ long-term target is still to achieve a ROIC that exceeds the<br />
Group’s cost of capital by 30-50 %. However, the recession in 2009<br />
resulted in market conditions that made it impossible to achieve<br />
ROIC on a par with WACC in the short term, despite the return on a<br />
number of activities being satisfactory.<br />
Achieving a ROIC on a par with WACC depends, among other<br />
things, on further structural adjustments in <strong>DFDS</strong>’ activities, as well as<br />
improved market conditions, particularly in the freight market. This is<br />
expected to provide a basis on which to achieve a return equivalent<br />
to the capital cost in 2012.<br />
Tonnage<br />
The number of ships in the <strong>DFDS</strong> fleet, and therefore overall capacity,<br />
was adapted in line with market trends in 2009. At year end, the fleet<br />
had been reduced by 15 % to 51 ships, a reduction of nine.<br />
The composition of the ro-ro freight fleet changed in 2009,<br />
although the number of ships at year end was unchanged at 22.<br />
Two smaller ro-ro ships built in 2000 were purchased and a larger<br />
newbuilding was delivered, while three chartered ships were returned.<br />
At the start of 2010, the ro-ro fleet was reduced as a result of the sale<br />
of the oldest ship for scrap and the chartering out of two ships to<br />
Norfolkline. In addition, the last in a series of four chartered newbuildings<br />
will be delivered. The number of other, mainly chartered, freight<br />
ships (sideport, container and tramp) was reduced with the return of<br />
ten ships in 2009.<br />
The ro-pax fleet was increased by one ship in 2009, the newbuilding<br />
Lisco Maxima. One older ro-pax ship was laid up in February 2010,<br />
and a chartered ro-pax ship will be returned in May 2010. The number<br />
of passenger ships (five) remained unchanged in 2009, with one ship,<br />
Queen of Scandinavia, laid up for most of the year. For the latter, a<br />
three year charter agreement was entered into in February 2010.<br />
The agreement also includes purchase options and, furthermore, an<br />
agreement concerning manning and technical maintenance of the ship<br />
in the charter period.<br />
Ownership share per type of ship varies in relation to the ship’s<br />
degree of specialisation. The most specialised ships in the fleet are<br />
passenger ships, which are entirely owned by <strong>DFDS</strong>. Parts of the ro-ro<br />
fleet are specialised in relation to their size, speed and loading/unloading<br />
capability. These ships are primarily deployed in the North Sea.<br />
50 % of the ro-ro fleet is owned, an increase on 2008 due to the return<br />
of chartered tonnage. The ownership share for standard tonnage,<br />
e.g. container and tramp ships (excluding sideport ships), was 0 %. The<br />
contract period for chartered tonnage varies from a few months to<br />
up to ten years.<br />
The average age of <strong>DFDS</strong>’ own ro-ro freight ships was nine years<br />
at the end of 2009, which is considered satisfactory. The average age<br />
of the passenger ships was 20 years at the end of 2009, excluding the<br />
laid-up Queen of Scandinavia, which is considered to be in line the<br />
market norm for this type of tonnage.<br />
Against this background, no freight or passenger ships are expected<br />
to be purchased in the period up to and including 2012.<br />
New Chief Financial Officer<br />
Torben Carlsen (born 1965) started as CFO in June 2009 and joined<br />
the Executive Board alongside CEO Niels Smedegaard. Torben Carlsen<br />
has previously worked abroad for several years, including six years as<br />
CFO for an American company. Most recently, he was a partner in<br />
a Danish private equity fund.<br />
Social responsibility (CSR)<br />
As a shipping company, <strong>DFDS</strong>’ activities are subject to extensive<br />
regulation by Danish and international legislation, as well as regulations<br />
relating to ship operations, e.g. security, onboard working conditions<br />
and environmental impact. These areas are deemed to be the most<br />
significant in terms of meeting both stakeholders’ demands and expectations<br />
of <strong>DFDS</strong>’ social responsibility.<br />
In order to ensure regulatory compliance, <strong>DFDS</strong> continually draws<br />
up and revises its policies for the abovementioned and other areas,<br />
including an ethical code for all suppliers. <strong>DFDS</strong>’ policies, practices and<br />
results in terms of environmental impact and staff welfare are outlined<br />
on page 42-45 of this report. Safety conditions are described below.<br />
The reporting in this annual report on social responsibility is not yet<br />
exhaustive.<br />
Safety and security are top priorities<br />
The security and safety of passengers, crew, tonnage and cargo are of<br />
the highest priority, and are integral to the company’s overall policies,<br />
strategies and targets.<br />
As a result, the safety-management system (ISM) is actively developed<br />
on an ongoing basis. The system consists of documented processes<br />
that maintain a constant focus on all aspects of onboard security,<br />
including verifying fulfilment of the requirements of both legislation and<br />
the Group’s internal specifications. Much of the safety work takes the<br />
form of well-established onboard inspection and maintenance routines.<br />
The management continually monitors the results of this work, and<br />
individual parts of the system are analysed and processed as required.<br />
This work was further developed in 2009 with a comprehensive<br />
safety evaluation of the Group and ship operations. This work, which<br />
was carried out in collaboration with management, utilised fixed targets<br />
in order to assess whether the shipping company’s overall objectives<br />
and the individual ships’ operations met the safety requirements<br />
of both the authorities and the shipping company.<br />
In addition, all ships and the shipping company undergo an internal<br />
audit at least once a year. The shipping company’s auditors evaluate<br />
each ship in relation to the company’s objectives and the authorities’<br />
requirements for continuous safety improvements. These extensive<br />
control mechanisms are designed to ensure safety and to collate<br />
important information that can be applied to fleet-wide preventative<br />
measures.<br />
At legally specified intervals, both the shipping company and the<br />
fleet are subjected to inspections (both with and without prior warning)<br />
and security and safety audits by relevant authorities in the state<br />
under whose flag the ships sail, as well as by classification societies, the<br />
EU and insurance companies.
<strong>DFDS</strong> annual report 2009 Management Report 15<br />
Profit expectation 2010 for <strong>DFDS</strong> Group and business units<br />
excluding transaction costs<br />
BUSINESS UNIT<br />
REVENUE<br />
GROWTH<br />
OPERATING PROFIT<br />
(EBITDA) GROWTH COMMENTS STRATEGIC FOCUS<br />
Ro-Ro Shipping 8-10 % 5 % Large degree of uncertainty<br />
concerning rate levels<br />
Container Shipping 4-6 % Improvement of<br />
DKK 40-50 mill.<br />
One-off costs and several loss-making<br />
charter agreements expired<br />
end of 2009<br />
Passenger Shipping 1-3 % -15% Negative impact on earnings from<br />
higher bunker cost<br />
Terminal Services 5-8 % Improvement of<br />
DKK 20-25 mill.<br />
Full-year impact of rationalisation<br />
carried out in 2009<br />
Trailer Services 20-25 % 20 % Take-over of contract end of 2009<br />
for volumes between Germany and<br />
UK increases revenue<br />
Non-allocated<br />
items/eliminations<br />
n.a. Level Adjusted for acquisition transaction<br />
costs in 2009 and 2010<br />
Restructuring of non-profitable routes.<br />
Deployment of excess tonnage<br />
Improve earnings for Chartering and<br />
Shippng Logistics<br />
Improve earnings for Amsterdam-<br />
Newcastle route<br />
Improve earnings for port terminal in<br />
England. Third party volumes<br />
Improve earnings for<br />
Swedish activities<br />
Rationalisation of processes for<br />
central functions<br />
Group total 6-8 % 5-7 %<br />
Exercises and training are key elements in optimising onboard<br />
safety and emergency procedures. Onboard emergency and safety<br />
exercises, involving all or parts of the crew, are conducted on a regular<br />
basis. The Company has also made King of Scandinavia and Pearl of<br />
Scandinavia available to the authorities for major safety exercises<br />
in the Netherlands and Norway respectively. These exercises are<br />
a prerequisite for the continuous assessment and improvement of<br />
emergency responses, both at sea and on land.<br />
<strong>DFDS</strong> works actively with various organisations and official bodies<br />
on ongoing improvements to onboard security and safety, so that it<br />
may influence legislation in this area in the future. This work is done at<br />
national, European and international level. <strong>DFDS</strong> is also represented<br />
on several organs in the Danish Shipowners’ Association, and by the<br />
Danish representative to the International Chamber of Shipping’s<br />
Passenger Ship Panel. In addition, <strong>DFDS</strong> chairs “Nordkompass” (the<br />
Nordic Committee for Passenger Ship Safety) on behalf of Denmark.<br />
n Revenue: Group revenue is expected to rise by 6-8 %, and by<br />
3-5 % adjusted for the effect of bunker surcharges. The table<br />
above shows how the individual business units are expected<br />
to contribute to revenue.<br />
n EBITDA: Group operating profit before depreciation (EBITDA)<br />
is expected to rise by approximately 5-7 % excluding acquisition<br />
transaction costs. The expected performance per business unit<br />
is shown in the table above.<br />
n Investments: Total investments in 2010 are expected to be<br />
around DKK 175 million.<br />
Overall, a pre-tax profit of around DKK 100 million is currently<br />
expected for 2010.<br />
Expectations for financial performance 2010<br />
The expectations outlined below refer exclusively to <strong>DFDS</strong>. Expected<br />
earnings from Norfolkline are not included as well as costs related to<br />
the transaction.<br />
The profit expectation is based on an assumption of positive but<br />
limited market growth in 2010. It is estimated that the recession of<br />
2009 will be superseded by some growth and progress in 2010, but at<br />
present a scenario with low and limited growth is considered more<br />
probable than a scenario involving higher growth. Oil-price and<br />
currency trends also remain uncertain.<br />
It must be stressed therefore that the expectations for 2010<br />
are subject to a high level of uncertainty.
16 The World Outside <strong>DFDS</strong><br />
<strong>DFDS</strong> annual report 2009<br />
The World<br />
Outside <strong>DFDS</strong><br />
A number of external factors impact upon <strong>DFDS</strong>, the<br />
most significant of which are political decisions, including<br />
new legislation, changes in competition and customer<br />
relationships, and the general state of the economy.<br />
Political decisions & legislation<br />
Political decisions regarding Northern Europe’s infrastructure and<br />
the shipping and transport sector have the greatest impact on <strong>DFDS</strong>.<br />
In addition, <strong>DFDS</strong> is subject to International Maritime Organisation<br />
(IMO) conventions. The IMO is the UN body responsible for maritime<br />
issues, primarily safety and the environment.<br />
The most important current issues that may affect <strong>DFDS</strong> are<br />
described in brief below.<br />
Legislation on sulphur content in bunkers: Two directives issued by<br />
the IMO and the EU regarding the use of low-sulphur bunkers for<br />
freight shipping come into force on the Baltic Sea and the North<br />
Sea in 2010. Both areas are designated as SECAs (Sulphur Emission<br />
Control Areas). One of these directives came into force in early 2010,<br />
and limits the sulphur content of bunkers to a maximum of 0.1 % while<br />
in port. The second will come into force in early July and stipulates a<br />
reduction of the sulphur content from 1.5 % to 1.0 % for shipping in the<br />
Baltic Sea and the North Sea.<br />
In the longer term, the objective is to reduce sulphur content in<br />
bunkers to 0.1 % by 2015. However, this will necessitate establishing<br />
reliable low-sulphur bunker supplies. Technology is currently being<br />
developed to reduce the sulphur content in the combustion process<br />
on board ships instead of sourcing bunkers with a sulphur content of<br />
0.1 %. Tests are currently being conducted on board one of the ships in<br />
the <strong>DFDS</strong> fleet.<br />
Freight from road to sea: Transferring freight volumes from road to<br />
sea is an established EU objective, the aim of which is to reduce congestion<br />
and bottlenecks on the roads and reduce pollution.<br />
Measures introduced in this area include road taxes, bans on trucks<br />
at weekends or on Sundays, especially during the summer months, and<br />
driving/rest-time regulations for truck drivers. The EU’s Marco Polo<br />
programme also provides seed funding for new and commercially<br />
viable shipping projects that help to relieve bottlenecks and move<br />
freight from road to the sea. These programmes have so far mainly<br />
supported the establishment of new routes in the Mediterranean,<br />
e.g. between Italy and Spain.<br />
The tonnage market<br />
For <strong>DFDS</strong>, the most important tonnage segments are ro-ro (freight<br />
ships) and ro-pax (combined passenger and freight ships). Ro-robased<br />
passenger and freight ships are built primarily for deployment<br />
on specific routes, as opposed to standardised tonnage built for the<br />
transportation of containers and commodities such as grain. This cre-<br />
International ro-ro passenger and freight volumes<br />
Passengers<br />
FREIGHT UNITS*<br />
2007 2008 2009 ∆ 09/08 2007 2008 2009 ∆ 09/08<br />
Baltic North 16.494.969 17.111.738 17.320.105 1,2 % 602.825 621.982 499.650 -19,7%<br />
Baltic South 12.786.379 12.409.269 11.622.530 -6,3% 1.890.247 1.857.858 1.575.585 -15,2%<br />
Kattegat 20.528.892 20.221.329 18.211.664 -9,9% 1.011.332 953.023 807.446 -15,3%<br />
North Sea 2.358.020 2.230.505 2.102.967 -5,7% 1.206.280 1.150.803 979.927 -14,8%<br />
The Channel 17.683.404 17.319.652 16.284.713 -6,0% 2.721.209 2.630.732 2.597.575 -1,3%<br />
Irish Sea 5.640.267 5.264.525 4.916.554 -6,6% 1.296.446 1.278.271 1.184.784 -7,3%<br />
Total routes<br />
75.491.931 74.557.018 70.458.533 -5,5% 8.728.339 8.492.669 7.644.967 -10,0%<br />
International bridge and tunnel volumes<br />
Øresund Bridge 14.806.000 14.977.000 15.343.000 1,2 % 338.426 341.106 298.071 -12,6%<br />
Eurotunnel 9.343.049 8.313.663 7.712.908 -11,0% 1.414.709 1.254.282 769.261 -38,7%<br />
Total bridge and tunnel 24.149.049 23.290.663 23.055.908 -3,6 % 1.753.135 1.595.388 1.067.332 -33,1 %<br />
Source: Shippax, own figures. Statistics are incomplete as some shipping companies are not included in the figures.<br />
* A freight unit corresponds to approximately 13 lanemeter.
<strong>DFDS</strong> annual report 2009 The World Outside <strong>DFDS</strong> 17<br />
ates a relatively stable market for ro-ro-based passenger and freight<br />
ships – the global order book at the end of 2009 was approximately<br />
15 % of the global fleet. The corresponding proportion for standardised<br />
tonnage in recent years has been around 40 %.<br />
In 2009, the number of new orders for ro-ro-based passenger and<br />
freight ships was limited, and the number of ships sent for scrapping<br />
increased. This trend is expected to continue in 2010, and the demand<br />
for ro-ro tonnage is predicted to increase from 2012.<br />
REVENUE 2008: 10 LARGEST NORTH EUROPEAN PASSENGER<br />
AND FREIGHT SHIPPING COMPANIES<br />
(EUR BILLION)<br />
1,6<br />
1,4<br />
1,2<br />
1,0<br />
Impact from economic cycle<br />
In 2009, Northern Europe was characterised by negative economic<br />
growth, which led to reductions in product demand and therefore the<br />
flow of goods. For shipping, the most significant reductions were in<br />
freight volume, while passenger volumes were less affected. Lower volumes<br />
have created overcapacity in most Northern European shipping<br />
companies, who have responded by selling and chartering out excess<br />
tonnage and laying up ships. In addition, tonnage has been redeployed,<br />
routes have been closed or combined, and costs have been reduced<br />
through organisational changes. Overcapacity has contributed to<br />
increased price pressure in the market.<br />
In general, freight and passenger shipping is characterised by a high<br />
proportion of fixed costs, e.g. associated with the cost of capital, port<br />
fees and bunker, which means that the steep and rapid decline in the<br />
market had a negative impact on financial performance. Conversely,<br />
the business models operated by shipping companies imply a high<br />
proportion of any increase in revenue from higher volumes and prices<br />
is converted to operating profit.<br />
0,8<br />
0,6<br />
0,4<br />
0,2<br />
0,0<br />
ICG (I)<br />
VIKING LINE (SF)<br />
COLOR LINE (NO)<br />
NORFOLKLINE (NL/DK)<br />
SCANDLINES (D)<br />
FINNLINES (SF)<br />
TALLINK (EE)<br />
STENA LINE (S)<br />
<strong>DFDS</strong> (DK)<br />
P&O FERRIES (2007, UK)<br />
The market situation and competition<br />
Growth in the Northern European passenger market was negative<br />
6 % in 2009 due to fewer passengers in all regions – except the<br />
northern part of the Baltic Sea, where the number of passengers rose<br />
by 1 %. In the southern Baltic, volumes were reduced most between<br />
Germany, Sweden and Denmark, while the decline was more limited<br />
in the Polish and Baltic markets. There was a decrease of 10 % in the<br />
Kattegat, partly because of restructuring of routes between Norway<br />
and Denmark. Adjusted for this, the market was stable compared to<br />
2008, while the market between Sweden and Denmark experienced<br />
a decline. The decline of 6 % in the <strong>English</strong> Channel can primarily be attributed<br />
to the closure of a fast-ferry route in 2008 and interruptions<br />
to the SeaFrance service in 2009.<br />
The total decline in Northern European freight volumes, to which<br />
all regions contributed, was around 10 % in 2009. In the southern<br />
Baltic Sea, the greatest decline was on the market between Germany,<br />
Sweden and Denmark. On the North Sea, the decline in volume<br />
between Scandinavia and Great Britain, as well as between the Continent<br />
and Great Britain, accounted for a setback of 15 %. The relatively<br />
low decline in the <strong>English</strong> Channel was partly due to interruptions to<br />
Eurotunnel’s services.<br />
Measured in terms of revenue, <strong>DFDS</strong> was the second-largest passenger<br />
and freight shipping company in Northern Europe in 2009.
Ro-Ro<br />
SHIPPING<br />
Ro-Ro Shipping operates a network<br />
of routes based on ro-ro and<br />
ro-pax tonnage in the North<br />
Sea and the Baltic Sea
Business area responsible<br />
Peder Gellert Pedersen<br />
Product concepts<br />
n Trailer system<br />
n Lifting unit system<br />
n Industrial logistics<br />
n Cassette system<br />
n Automobile system<br />
n Special and project cargo<br />
Brands<br />
n <strong>DFDS</strong> Tor Line<br />
n <strong>DFDS</strong> LISCO<br />
n <strong>DFDS</strong> Shipping Logistics<br />
n <strong>DFDS</strong> AutoLogistics<br />
n Polferries (limited right of use)<br />
RO-RO SHIPPING (42%)<br />
SHARE OF GROUP<br />
REVENUE<br />
Customer groups<br />
n Haulage contractors and forwarding companies<br />
n Producers of heavy industrial goods, e.g. passenger vehicles<br />
and trucks, steel, forest products, chemicals<br />
n Passengers, primarily in their own vehicles<br />
Comparable companies/competitors<br />
n Cobelfret<br />
n Finnlines<br />
n P&O Ferries<br />
n Stena Line<br />
n Transfennica<br />
Significant events in 2009/2010<br />
n Recession led to reduced volumes and rates in all regions<br />
n Capacity of the route network reduced by 6 %<br />
n Operations and organisation adapted to changing market conditions<br />
n Two smaller ro-ro ships purchased and deployed<br />
in January/February 2009<br />
n Ro-pax newbuilding deployed on the Baltic Sea in May 2009<br />
n Delivery of one chartered ro-ro newbuilding in mid-2009<br />
n Extension of three ro-ro ships completed by mid-2009<br />
n Return of three chartered ro-ro ships at end of 2009,<br />
and chartering out of excess tonnage<br />
n Closure of the route between Latvia and Germany, January 2010<br />
n Agreement reached to charter two ro-ro ships to Norfolkline<br />
in 2010
20 RO-ro shipping<br />
<strong>DFDS</strong> annual report 2009<br />
Markets, activities and customers<br />
Ro-Ro Shipping’s activities comprise the operation of route networks<br />
on the North Sea and the southern half of the Baltic Sea. On<br />
the North Sea, primarily the flow of goods between Scandinavia<br />
and Great Britain/the Continent, as well as between the Continent<br />
and Great Britain, are serviced. In the Baltic Sea, services are mainly<br />
focused on the flow of goods between Scandinavia and the Continent<br />
on the one hand, and Russia, the Baltic States and the CIS countries<br />
on the other.<br />
The network includes ro-ro and ro-pax routes, the latter primarily<br />
in the Baltic, where the market for unaccompanied trailers is larger<br />
than on the North Sea.<br />
International haulage and forwarding companies account for approximately<br />
56 % of total volumes, manufacturers of heavy industrial<br />
goods approximately 44 %. This split remained unchanged from 2008.<br />
The most important industrial target customer groups are the car<br />
industry and producers of heavy goods and plant equipment requiring<br />
development of tailor-made logistics systems, including investment in<br />
specialised transport equipment, IT solutions, dedicated warehouses<br />
and, in some cases, deployment of larger tonnage. Industrial logistics<br />
contracts are therefore long-term with <strong>DFDS</strong> operating as part of the<br />
customer’s supply chain.<br />
Market trends<br />
The Northern European ro-ro freight market as a whole declined by<br />
about 10 % in 2009 as a result of the recession, which began in late<br />
2008. The total decline in <strong>DFDS</strong>’ primary markets in the southern<br />
Baltic Sea and the North Sea was around 15 %. The largest decrease<br />
was experienced in H1 2009, particularly Q1. The market stabilised<br />
in H2, and in Q4 volumes reached a level at or above Q4 2008 in<br />
several market areas.<br />
The low level of activity created overcapacity in most companies<br />
in the ro-ro sector, as well as among container and trailer operators,<br />
impacting rate levels negatively. The competitive situation, especially<br />
in the Baltic Sea, was characterised by overcapacity in the land-based<br />
transport sector. However, in response to the market conditions,<br />
several shipping companies adapted capacity by closing routes and by<br />
chartering out and laying up tonnage.<br />
Ro-Ro Shipping’s success criteria<br />
The most important success criteria for Ro-Ro Shipping are reliability<br />
and frequency and a schedule adapted to customers’ requirements.<br />
Other significant factors include adjusting capacity to reflect market<br />
trends, and reducing clients’ overall transport time on an ongoing basis,<br />
which places demands on tonnage speed and turnaround time in port.<br />
Fleet modernisation and adaptation<br />
The fleet was further modernised in 2009 following the deployment<br />
of two newer ro-ro ships on the route between Rotterdam and<br />
Immingham at the start of the year, and a ro-pax newbuilding on the<br />
route between Kiel and Klaipeda in May 2009. Customer service has<br />
been improved on both routes through increased reliability, frequency<br />
and capacity.<br />
In addition, the third in a series of four chartered ro-ro newbuildings<br />
was delivered in mid-2009. By the end of 2009, three older<br />
chartered ro-ro ships had been returned, and the fleet’s oldest ro-ro<br />
ship was sold in early 2010.<br />
In mid-2009, three ro-ro ships sailing between Sweden and England<br />
were extended, which reduces operating costs and environmental<br />
impact per unit, and adds capacity to the market.<br />
The renewal of tonnage in 2008 and 2009 led to savings in terms<br />
of both operating costs, including bunker consumption, and improved<br />
operational reliability, strengthening the route network’s long-term<br />
competitiveness. It is therefore currently estimated that no tonnage<br />
investments are required within the next couple of years.<br />
The tonnage market<br />
The global decline in activity generated overcapacity in the market for<br />
ro-ro and ro-pax tonnage, particularly for older and smaller tonnage.<br />
Older ships still constitute a disproportionately large share of global<br />
ro-ro tonnage, and rates for newer and larger tonnage are therefore<br />
expected to remain relatively stable over the coming years. This is also<br />
based on a moderate influx of new tonnage, as capacity on orders<br />
constituted approximately 15 % of global capacity at the end of 2009.<br />
In addition, the number of ships scrapped is expected to rise in 2010<br />
and new orders very limited.<br />
Ro-Ro Shipping 2008 2009<br />
DKK miLLION Q1 Q2 Q3 Q4 FULL YEAR Q1 Q2 Q3 Q4 FULL YEAR<br />
Revenue 926 997 1,009 867 3,799 669 736 798 794 2,997<br />
Operating profit before depreciation<br />
(EBITDA) 186 217 207 174 784 119 135 132 133 519<br />
Profit/loss on disposal of tangible assets 0 7 3 2 12 0 0 0 0 0<br />
Depreciation -62 -65 -66 -53 -246 -63 -69 -73 -82 -287<br />
Operating profit (EBIT) 124 159 144 123 550 56 66 59 51 232<br />
Operating profit margin (EBIT), % 13.4 15.9 14.3 14.2 14.5 8.4 9.0 7.4 6.4 7.7<br />
Invested capital, average 4,596 4,645 4,626 4,491 4,560 4,510 4,916 5,256 5,320 4.965<br />
Return on invested capital (ROIC) p.a., % 10.8 11.9 12.2 10.7 11.7 4.7 5.0 4.4 3.6 4.4<br />
Lanemetres, '000 2,605 2,663 2,474 2,269 10,017 2,139 2,274 2,327 2,457 9,197<br />
Passengers (Baltic Sea), '000 45 58 81 40 224 63 94 129 77 363
<strong>DFDS</strong> annual report 2009 RO-ro shipping 21<br />
Adjustment of activities<br />
Deterioration of market conditions during the year necessitated an<br />
adjustment of activities in H2 to reduce the route network’s capacity<br />
and lower costs. Sales activities were also intensified. The main adjustments<br />
in 2009/10 were:<br />
n Early in 2009, the routes NorBridge (Norway-UK) and<br />
AngloBridge (Sweden-UK) were merged, and a ro-ro ship<br />
freed up and chartered out<br />
n Freight-agency staffing levels in Germany, Sweden<br />
and Lithuania were reduced by 12-17 %<br />
n Renegotiation of port and stevedore agreements<br />
n Reduction in the number of departures<br />
n Bunker consumption optimised<br />
n HansaBridge (Latvia-Germany) closed in early 2010.<br />
The main customer<br />
groups ARE international<br />
haulage<br />
and forwarding<br />
companies and<br />
manufacturers<br />
of heavy indu Strial<br />
goods<br />
FREIGHT ROUTES (RO-RO)<br />
PASSENGER AND FREIGHT ROUTES (RO-PAX)<br />
SALES AGENCY<br />
ST. PETERSBURG<br />
BREVIK<br />
GOTHENBURG<br />
KARLSHAMN<br />
MOSCOW<br />
ESBJERG<br />
AARHUS<br />
COPENHAGEN<br />
KLAIPEDA<br />
FREDERICIA<br />
BALTIYSK<br />
IMMINGHAM<br />
CUXHAVEN<br />
KIEL<br />
SASSNITZ<br />
(MUKRAN)<br />
TILBURY<br />
HARWICH<br />
ROTTERDAM<br />
GHENT
22 RO-ro shipping<br />
<strong>DFDS</strong> annual report 2009<br />
Project “Lightship”<br />
At Group-level a project was launched in autumn 2009 to improve<br />
the efficiency of ship operations. The project’s work streams include<br />
bunker optimisation, staffing, maintenance, purchasing and supplies,<br />
management systems and the efficiency of loading and unloading<br />
operations.<br />
The target at Group level is to achieve an overall saving of approximately<br />
DKK 100 million in 2010. Ro-Ro Shipping’s share of the target<br />
represents a saving of around DKK 50 million.<br />
Activity development<br />
Ro-Ro Shipping’s routes cover three regions: the Baltic Sea, the North<br />
Sea (Sweden/Norway-Belgium/United Kingdom) and the Continent<br />
(Denmark/Germany/Netherlands-United Kingdom). The freight<br />
capacity for the entire route network was 13.1 million lanemetres<br />
in 2009, 6 % lower than in 2008, adjusted for the charter agreement<br />
with Polferries in September 2008. The largest capacity reduction was<br />
implemented in the North Sea by fewer sailings and tonnage changes.<br />
Capacity is almost evenly divided between the three regions, although<br />
the relationship between the number of sailings and the number and<br />
size of ships varies.<br />
The route network’s total capacity utilisation was reduced by 4<br />
percentage points in 2009, with the largest reduction on the Continent<br />
and the smallest in the Baltic Sea. Figures are adjusted for volumes from<br />
Passenger Shipping’s route network, where the Bergen route was closed<br />
in September 2008, and the charter agreement with Polferries.<br />
Ro-Ro Shipping transported 8.2 million lanemetres in 2009. Adjusted<br />
for Polferries and Passenger Shipping, this represents a decrease<br />
of 12 % compared to 2008. The market stabilised over the year, with a<br />
decline of 23 % in Q1 and an increase of 6 % in Q4. The rise in Q4 was<br />
driven by a 20 % increase in the Baltic Sea, partly due to the recession<br />
taking hold earlier in this region and closure of a competing route. On<br />
the North Sea and the Continent, the rise in Q4 was 1-2 %.<br />
The business model for liner services with ro-ro ships involves<br />
a relatively low proportion of variable costs, related primarily to<br />
stevedoring, while remaining costs are largely unaffected by changes in<br />
activity levels. Performance is thus sensitive to changes in volume and<br />
rate per unit. In addition to lower volumes, the recession in 2009 led<br />
to rates in all regions falling by 4-8 %. This can be attributed to price<br />
pressure, currency fluctuations (particularly in SEK), changes in freight<br />
mix, and traffic imbalances.<br />
The significant deterioration in Ro-Ro Shipping’s financial performance<br />
in 2009 can therefore be attributed to lower volumes and rates<br />
and a high proportion of fixed costs on the other hand. The operational<br />
changes implemented since mid-2008 have contributed to<br />
reduce the rate of decline in all regions.<br />
The North Sea: The weakening of SEK strengthened westbound<br />
traffic on the North Sea, but a growing imbalance in the flow of goods<br />
reduced the overall rate. Lower volumes, especially from the automobile<br />
sector, resulted in a marked deterioration in earnings on the<br />
route between Sweden and Belgium. Lower volumes from industrial<br />
companies also affected earnings on the route between Sweden and<br />
Great Britain.<br />
The Continent: The recession led to significant overcapacity in the<br />
market between Benelux and Great Britain, with particularly significant<br />
reductions in revenue on the route from Holland. Lower volumes<br />
from the automobile sector, especially in H1, impacted the route<br />
from Germany while development on the routes from Denmark<br />
was more stable.<br />
The Baltic Sea: New tonnage was introduced in 2009, which improved<br />
the service level but also raised the cost level. The recession intensified<br />
competition between road and sea transport. A competing route<br />
closed towards the end of the year, and <strong>DFDS</strong> closed the route between<br />
Latvia and Germany at the end of January 2010 in order to concentrate<br />
the route network on the smaller number of ports to the east.<br />
Financial performance<br />
Revenue was down by 21 % to DKK 2,997 million in 2009. Adjusted<br />
for bunker surcharges, the reduction was 14 %. In addition, three major<br />
factors affected the comparison of revenue between 2009 and<br />
2008: Passenger revenue from the ro-pax Esbjerg-Harwich route<br />
was transferred to Passenger Shipping at the beginning of 2009; a<br />
new charter agreement was signed with Polferries in September<br />
2008; and the route network’s reduced capacity led to an increase<br />
of 60 % in revenue from chartering out tonnage. Adjusted for these<br />
items, revenue was 18 % lower in 2009, which can be coupled with<br />
12 % lower volumes and lower rates and exchange-rate fluctuations<br />
averaging a decline of 6 %.<br />
Operating profit before depreciation (EBITDA) declined by 34 %<br />
to DKK 519 million in 2009, a reduction of DKK 265 million. Due to<br />
the lower level of activity, the EBITDA margin was reduced to 17 %<br />
from 21 % in 2008. In addition, the variable costs for stevedoring, as<br />
well as staff and sales costs, were reduced as a result of the changes<br />
implemented. Lower oil prices in 2009 reduced bunker costs, but this<br />
was offset by lower revenue from bunker surcharges. Oil consumption<br />
was reduced by 11 % in 2009, partly due to the bunker-optimisation<br />
programmes implemented as part of operational changes, and partly<br />
due to reduced capacity on the route network.<br />
Depreciation, excluding value adjustment of goodwill, rose by DKK<br />
22 million in 2009 following the addition of a ro-pax newbuilding and<br />
two new ro-ro ships, and the extension of three ships. Operating<br />
profit (EBIT) was DKK 232 million, down 58 % or DKK 318 million.<br />
Average invested capital in 2009 was DKK 4,965 million, an<br />
increase of DKK 405 million. This can be attributed to the addition<br />
of three ships and the extensions completed in 2009. The return on<br />
invested capital in 2009 was 4.4 %.
<strong>DFDS</strong> annual report 2009 HEADER 23
Container<br />
Shipping<br />
Container Shipping consists of<br />
route networks based on lo-lo<br />
tonnage in the North Sea, the Irish<br />
Sea and the north of Spain
Business area responsible<br />
Ole Sehested<br />
Product concepts<br />
n Door-door container solutions<br />
(dry bulk, refrigerated/frozen)<br />
n Intermodal door-door and quay-quay<br />
container solutions<br />
n Shipping logistics for mass-produced<br />
industrial goods<br />
Brands<br />
n <strong>DFDS</strong> Lys Line<br />
n <strong>DFDS</strong> Container Line<br />
n <strong>DFDS</strong> Suardiaz Line<br />
CONTAINER SHIPPING (16%)<br />
SHARE OF GROUP<br />
REVENUE<br />
Customer groups<br />
n International trading companies, finished goods<br />
n Producers of heavy industrial goods, such as<br />
forestry products, steel, chemicals and plastics<br />
n Bulk- and tank-container operators<br />
n International haulage companies<br />
Comparable companies<br />
n BG Freight<br />
n Cobelfret Containers<br />
n Containerships<br />
n Delphis/Team Lines<br />
n Eucon (Irish Continental Group)<br />
n MacAndrews<br />
n Samskip<br />
Significant events in 2009/2010<br />
n Lower demand resulted in overcapacity on all major<br />
markets in 2009<br />
n Demand stabilised at a lower level in H2<br />
n Capacity utilisation optimised by adaptation of tonnage<br />
n Production partnerships with Samskip/Unifeeder and Eucon<br />
n Reduction of tonnage in Chartering<br />
n Organisation reduced by 10 %<br />
n New management in <strong>DFDS</strong> Container Line and <strong>DFDS</strong> Lys Line<br />
n Restructuring of routes for sideport activities, with effect<br />
from early 2010<br />
n <strong>DFDS</strong> Container Line calls at Zeebrugge from November 2009
26 container shipping<br />
<strong>DFDS</strong> annual report 2009<br />
Markets, activities and customers<br />
Container Shipping’s activities consist of intermodal door-door container<br />
transport between the Nordic Region, the Continent, Great Britain,<br />
Ireland and Spain. Logistics solutions are also provided for transporting<br />
paper and metal products from Norway and Sweden to Northern and<br />
Southern Europe, on the basis of fixed, long-term contracts. In addition,<br />
Container Shipping operates a small fleet of tramp ships.<br />
Transport by sea is facilitated by lo-lo ships and combined<br />
sideport/container ships. More than 50 % of volumes in the industry<br />
segment Shipping Logistics are covered by long-term contracts.<br />
The most important industrial customer groups are producers and<br />
exporters of paper, metal and plastic products, as well as international<br />
trading companies importing and exporting finished goods.<br />
Market trends<br />
The negative market trend of 2008 continued into 2009, but stabilised<br />
at a lower level in H2. Despite shipping companies significantly reducing<br />
their capacity and laying up tonnage, all markets remain characterised<br />
by excess capacity. This has resulted in a significant decrease in<br />
revenue due to price competition, which in general has not been fully<br />
balanced by cost adjustments. Moreover, companies are seeking deployment<br />
for surplus tonnage to cover fixed costs. Falling diesel prices<br />
and increased supply by Eastern European hauliers with low rates also<br />
negatively affected the competitive situation.<br />
The Irish and Spanish markets are still weak, while other markets<br />
are relatively stable, albeit at a lower level of activity. Changes in market<br />
conditions have led to an increase in the number of vessel sharing<br />
agreements between shipping companies with the aim of reducing<br />
capacity and costs.<br />
Container Shipping’s success criteria<br />
The most important success criteria for Container Shipping are frequency,<br />
transit time, flexibility on tonnage and haulage capacity, as well<br />
as competitive cost levels underpinned by efficient IT systems.<br />
The tonnage market<br />
In line with falling activity levels, rates have been significantly reduced<br />
in the time-charter market for both container and bulk ships. The majority<br />
of Container Shipping’s tonnage is chartered, and several charter<br />
contracts expired in 2009, which made it possible to both cut capacity<br />
and further reduce costs over the course of the year.<br />
Activity development<br />
Seen as a whole, Container Shipping’s activities and financial performance<br />
were not satisfactory in 2009 due to a fall in revenue of 29 %,<br />
to which all three primary areas of activity -Intermodal Container<br />
Transport, Shipping Logistics and Chartering - contributed.<br />
Several significant changes were made to operations in 2009.<br />
The organisation as a whole was reduced by 10 % in 2009, and new<br />
management were appointed in <strong>DFDS</strong> Lys Line and <strong>DFDS</strong> Container<br />
Line. In Ireland, a number of synergies were achieved by consolidating<br />
the various functions within a single Irish <strong>DFDS</strong> office. At the end<br />
of 2009, <strong>DFDS</strong> Lys Line moved to a new office in Oslo, which will<br />
reduce future costs. In addition, the total container equipment fleet<br />
was reduced by 25 % to 4,000 units.<br />
Intermodal Container Transport: Despite the decline in volumes and<br />
rates, significantly improved operating profit was achieved for Intermodal<br />
Container Transport in the three main traffic areas (Norway/UK-<br />
Continent, Continent-Ireland and Ireland-Spain). Overall market share<br />
was maintained in all areas. The progress was due, amongst other<br />
things, to integration of the various companies, which now benefit<br />
from joint management of tonnage, a shared equipment pool and a<br />
common IT system.<br />
The greatest progress was achieved in traffic on the Norway/UK-<br />
Continent routes operated by <strong>DFDS</strong> Lys Line, and can be attributed<br />
to streamlining and capacity adjustment. The latter was implemented<br />
as part of a production agreement with Samskip, which was entered<br />
into in 2007. In May 2009, this was extended to include Unifeeder in<br />
a so-called vessel sharing agreement, under which <strong>DFDS</strong> Lys Line can<br />
utilise a fixed proportion of the capacity between the Oslo Fjord and<br />
Rotterdam. Following the closure of the route between Norway and<br />
Ireland (cf. below), door-door containers between Norway and Ireland<br />
are now transported via the Continent/Ireland traffic. The changes<br />
made in 2009 have laid the foundations for future progress by <strong>DFDS</strong><br />
Lys Line’s container activities.<br />
<strong>DFDS</strong> Container Line operates traffic between Ireland and the<br />
Continent, where the market is still characterised by low demand and<br />
significant price competition. A tonnage agreement with Eucon has<br />
facilitated ongoing capacity adjustment between Rotterdam and Dublin.<br />
In October 2009, the route between Rotterdam and Waterford<br />
was extended to include a call in Zeebrugge. The cost of chartered<br />
tonnage in this area was considerably higher in 2009 than the current<br />
market level, as the tonnage agreements were reached in 2008. To<br />
achieve a competitive future cost level, two charter agreements were<br />
cancelled at the end of 2009, which resulted in a one-off cost of DKK<br />
Container Shipping 2008 2009<br />
DKK miLLION Q1 Q2 Q3 Q4 FULL YEAR Q1 Q2 Q3 Q4 FULL YEAR<br />
Revenue 425 437 419 355 1,636 294 287 286 298 1,165<br />
Operating profit before depreciation<br />
(EBITDA) 24 26 26 5 81 5 4 0 -4 5<br />
Associates 1 -1 1 -1 0 0 1 0 0 1<br />
Profit/loss on disposal of tangible assets 0 0 0 1 1 2 7 0 0 9<br />
Depreciation -19 -19 -17 -56 -111 -14 -13 -10 -13 -50<br />
Operating profit (EBIT) 6 6 10 -51 -29 -7 -1 -10 -17 -35<br />
Operating profit margin (EBIT), % 1.4 1.4 2.4 -14.4 -1.8 -2.4 -0.3 -3.5 -5.7 -3.0<br />
Invested capital, average 774 757 754 667 729 615 615 602 617 617<br />
Return on invested capital (ROIC) p.a., % 3.2 3.0 4.9 -28.9 -3.7 -4.1 -1.2 -6.2 -9.4 -5.4<br />
Tons, '000 642 631 622 551 2,446 450 425 449 406 1,730<br />
Containers, '000 27 30 28 24 109 22 22 21 21 86
<strong>DFDS</strong> annual report 2009 container shipping 27<br />
15 million. This, combined with greater efficiency in production, is<br />
expected to contribute to improved financial performance in 2010.<br />
<strong>DFDS</strong> Suardiaz Line (50/50 joint venture with Logistica Suardiaz,<br />
Bilbao) operates container traffic between Spain and Britain’s west<br />
coast and Ireland. Financial performance improved in 2009 as a result<br />
of adjusting costs to meet changing market conditions, including lower<br />
tonnage costs, and this trend is expected to continue in 2010.<br />
Shipping Logistics: Activity levels and the result for industrial logistics<br />
activities in Norway and Sweden fell significantly in 2009 due to lower<br />
volumes from the paper industry. As a consequence, the route between<br />
Norway/Sweden and Ireland was closed in October 2009 and<br />
volumes transferred to Ro-Ro Shipping’s route between Gothenburg<br />
and Immingham. Closing the Ireland route triggered costs for closing<br />
the office in Lysekil.<br />
As a result of the above route closure and the changed market<br />
conditions in general, the number of sideport ships was reduced from<br />
seven to five. The return of two ships in 2009 triggered a one-off cost<br />
of DKK 12 million. In close collaboration with industrial clients, the<br />
route network was reorganised in early 2010, resulting in an integrated<br />
sailing schedule for the three largest sideport/container ships<br />
on routes between Scandinavia and the Continent, the UK and Spain.<br />
This is expected to provide opportunities for higher volumes and<br />
more efficient fleet utilisation. Furthermore, a small container ship has<br />
been deployed between Western Norway and Rotterdam to service<br />
volumes from the paper industry.<br />
Chartering: Activities include the operation of small tramp ships in<br />
Europe and the Mediterranean, based on fixed contracts e.g. with<br />
Norwegian industrial customers. Demand fell by approximately 50 %<br />
in 2009, which resulted in a significant deficit compared to the satisfactory<br />
earnings in 2008. In 2009, the fleet was reduced from nine to five<br />
ships. Three of these ships will be chartered at rates significantly higher<br />
than current market levels until the end of 2010. Financial performance<br />
will therefore improve in 2010, but not expected to return to<br />
a satisfactory level until 2011.<br />
The main customer<br />
groups ARE International<br />
trading<br />
companies, as well<br />
as manu FActurers<br />
of heavy industrial<br />
goods<br />
SALES AGENCY<br />
PORT OF CALL<br />
SKOGN<br />
OSLO<br />
Financial performance<br />
Revenue fell by 29 % to DKK 1,165 million in 2009. Approximately two<br />
thirds of revenue can be attributed to Intermodal Container Transport,<br />
where volume was reduced by over 30 % due to capacity adjustment,<br />
lower revenue from bunker surcharges, and lower volumes and rates.<br />
Shipping Logistics’ revenue makes up approximately 30 % of the total<br />
and was reduced by approximately 20 %, also as a result of lower<br />
revenue from bunker surcharges, lower volumes and lower rates.<br />
Chartering revenue was halved in 2009.<br />
Operating profit before depreciation (EBITDA) was reduced<br />
to DKK 5 million, from DKK 81 million in 2008. This result includes<br />
one-off items amounting to DKK 27 million from the early return of<br />
tonnage and cancellation of charter agreements. After adjustment for<br />
these one-off items, financial performance was down DKK 49 million,<br />
of which DKK 37 million can be attributed to Chartering activities.<br />
The remaining decrease was due to lower performance by Shipping<br />
Logistics, which was partially offset by improved performance by<br />
Intermodal Container Transport. The result also includes costs for staff<br />
reductions and further expansion of IT systems.<br />
The early return of two financially leased sideport ships generated<br />
a profit of DKK 9 million. Depreciation amounted to DKK 50 million,<br />
after which the operating profit (EBIT) was a loss of DKK 35 million.<br />
Average invested capital was DKK 617 million in 2009, down DKK<br />
112 million from 2008 as a result of write-downs made at the end of<br />
2008, the influence of a lower NOK and the return of ships. Return<br />
on invested capital in 2009 was a negative 5.4 %.<br />
BELFAST<br />
DUBLIN<br />
WATERFORD<br />
GREENOCK<br />
LIVERPOOL<br />
IMMINGHAM<br />
AVONMOUTH<br />
CHATHAM<br />
GHENT<br />
ZEEBRUGGE<br />
BREVIK<br />
KRISTIANSAND<br />
ROTTERDAM<br />
MOSS<br />
HALDEN<br />
HAMBURG<br />
BILBAO
Passenger<br />
Shipping<br />
Passenger Shipping operates<br />
passenger routes based on cruiseferry<br />
tonnage in the North Sea<br />
and Kattegat/Skagerrak
Business area responsible<br />
Carsten Jensen<br />
Product concepts<br />
n Transport with own vehicle<br />
n Package tours<br />
n Mini Cruise<br />
n Conferences<br />
n Freight<br />
Brands<br />
n <strong>DFDS</strong> Seaways<br />
n <strong>DFDS</strong> Canal Tours<br />
PASSENGER SHIPPING (23%)<br />
SHARE OF GROUP<br />
REVENUE<br />
Customer groups<br />
n Families<br />
n Groups of friends<br />
n Business travellers<br />
n Companies, organisations and course organisers<br />
n Tour operators, agents and travel agents<br />
Comparable companies/competitors<br />
n Color Line<br />
n Fjord Line<br />
n P&O Ferries<br />
n Stena Line<br />
n Tallink Silja<br />
n Viking Line<br />
Significant events in 2009<br />
n Takeover of freight agency on the Copenhagen-Oslo<br />
route in autumn<br />
n Takeover of passenger revenue from Ro-Ro Shipping<br />
on the Esbjerg-Harwich route<br />
n Share of non-Danish crew on ships increased<br />
n Full-year effect of Project Lighthouse<br />
n Depreciation of net income currencies (GBP and NOK)<br />
n Significant income from bunker hedging<br />
n Queen of Scandinavia laid up, deployed 105 days as a hotel ship<br />
n Write-down of DKK 33 million on Queen of Scandinavia<br />
n Internal transfer of Queen of Scandinavia to non-allocated<br />
items at the end of 2009
30 passenger shipping<br />
<strong>DFDS</strong> annual report 2009<br />
Markets, activities and customers<br />
<strong>DFDS</strong> Seaways operates overnight passenger shipping services on three<br />
routes in the North Sea and Kattegat/Skagerrak. Its main target groups<br />
are Mini Cruise passengers, holidaymakers travelling in their own cars,<br />
group travel and transport, and conference passengers. The onboard<br />
experience is important for all travellers. The routes also carry freight.<br />
Ticket sales and related services account for approximately 40 %<br />
of revenue, onboard sales for approximately 50 %. Freight revenue<br />
represents about 8 %, and the remaining revenue is generated from<br />
charter activity.<br />
Market trends<br />
As a result of the recession, the Northern European market for passenger<br />
shipping experienced an overall decline in passenger numbers<br />
of around 5 % in 2009.<br />
In the Kattegat area, the market between Denmark and Norway<br />
was relatively stable after adjustment for the restructuring of several<br />
routes in 2008. The market trend between Sweden and Denmark<br />
was in general considerably weaker. On the North Sea, routes are<br />
operated between Denmark and the Continent/the United Kingdom.<br />
The British market was substantially weakened by the recession<br />
and a lower pound sterling, but the decline in the number of British<br />
travellers was offset by an increase in the number of travellers from<br />
the Continent to the United Kingdom. The total passenger market<br />
between the east coast of England and the Benelux countries as a<br />
whole was stable in 2009.<br />
The recession had a negative impact on passenger shipping activities<br />
in 2009 and most shipping companies have experienced a decline<br />
in the number of passengers. Moreover, currencies have weakened in<br />
several economies outside of Northern Europe raising the cost for<br />
travel in Northern Europe. In addition, several airports expanded their<br />
capacity in 2009, which has intensified competition.<br />
As a result of the lower demand, pricing strategies in the travel<br />
market have been further differentiated in order to secure volumes<br />
and onboard earnings.<br />
Passenger Shipping’s success criteria<br />
The onboard maritime experience is key to fulfilling passengers’ expectations.<br />
A positive experience depends upon an attractive onboard<br />
environment that offers a varied, contemporary range of food, drinks,<br />
shops and entertainment. In order to maintain and further develop<br />
a high level of service, staff skills are constantly enhanced by a variety<br />
of courses. In 2010, staff will also be involved in external marketing<br />
campaigns under the slogan “Yes, We Will”.<br />
To meet customers’ needs, new concepts will continue to be<br />
developed and introduced, and the onboard physical environment will<br />
be adapted and improved. The quality of cabins and cleaning are also<br />
important for passenger comfort. Other important factors include<br />
timetables, punctuality and safety.<br />
Implementation of efficiency programmes<br />
Project Lighthouse: In May 2008, a streamlining plan for Passenger<br />
Shipping was launched under the heading “Project Lighthouse”.<br />
The overall improvement plan was originally expected to lead to<br />
an improvement in financial performance of DKK 100 million in 2009,<br />
compared with 2007. Improvements were achieved in all of the<br />
activities launched in 2009. Measured against 2008, the streamlining<br />
plan has accounted for an impact on the 2009 result of approximately<br />
DKK 50 million.<br />
The main points of the improvement plan implemented in 2008 were:<br />
n closure of the loss-making Bergen-Newcastle route and<br />
the discontinuation of 270 posts<br />
n reorganisation and rationalisation of the land-based organisation<br />
(i.e. headquarters and agency organisation)<br />
n new industrial-relations agreements, including more flexible<br />
principles for manning the two passenger ships on the<br />
Copenhagen-Oslo route<br />
n a new, flat management structure on board all ships<br />
n discontinuation of 130 posts related to the last three points above.<br />
In addition to making the organisation and operations more efficient<br />
in general, commercial responsibility for ship organisation has been<br />
decentralised, which has underpinned earnings linked to onboard sales.<br />
The new route management structure has optimised co-operation<br />
between sales organisations on land and on board, which has led to<br />
better and quicker adaptation to different customer segments’ requirements<br />
and their expectations of individual routes/markets.<br />
Project Lightship: Launched in autumn 2009, this project aims to make<br />
ship operations more efficient. The target for Passenger Shipping is to<br />
achieve total savings of approximately DKK 40 million in 2010.<br />
Improvements and savings are mainly related to the priority areas<br />
ship maintenance, procurement with a focus on port contracts, catering<br />
and bunker optimisation.<br />
Passenger Shipping 2008 2009<br />
DKK miLLION Q1 Q2 Q3 Q4 FULL YEAR Q1 Q2 Q3 Q4 FULL YEAR<br />
Revenue 320 503 602 354 1,779 280 443 545 352 1,620<br />
Operating profit before depreciation<br />
(EBITDA) -88 55 164 63 194 -41 105 187 63 314<br />
Profit/loss on disposal of tangible assets 0 1 0 0 1 0 0 0 0 0<br />
Depreciation -47 -46 -44 -43 -180 -44 -62 -45 -60 -211<br />
Operating profit (EBIT) -135 10 120 20 15 -85 43 142 3 103<br />
Operating profit margin (EBIT), % -42.2 2.0 19.9 5.6 0.8 -30.4 9.7 26.1 0.9 6.4<br />
Invested capital, average 1,840 1,767 1,750 1,782 1,794 1,758 1,693 1,659 1,644 1,693<br />
Return on invested capital (ROIC) p.a., % -29.3 1.9 26.5 4.4 0.8 -18.2 9.6 33.1 0.7 5.7<br />
Passengers, '000 271 390 462 289 1,412 249 368 427 279 1,323
<strong>DFDS</strong> annual report 2009 passenger shipping 31<br />
Activity trends<br />
The activity level on the Copenhagen-Oslo route was affected by the<br />
slowdown in the economy and the depreciation of the NOK, resulting<br />
in a 3 % decline in passenger numbers compared to 2008.<br />
The passenger composition also changed, with fewer passengers from<br />
the business and conference segment, although this was partially offset<br />
by more holidaymakers. In addition, the number of passengers originating<br />
from overseas declined by 16 %. Costs were reduced, primarily because of<br />
lower oil prices and the effects of Project Lighthouse. Ticket revenue and<br />
onboard revenue per passenger was 5 % lower and 3 % when adjusted<br />
for exchange rates. The route’s freight activities were handled by DSV via<br />
a space-charter agreement until September 2009, when <strong>DFDS</strong> Seaways<br />
took over. Freight earnings on the route were slightly lower in 2009 as a<br />
result of the general decline in the freight market.<br />
The Amsterdam-Newcastle route made significant improvements<br />
in financial performance in 2009 as a result of increased market share<br />
and lower costs for operations and bunkers. Despite difficult market<br />
conditions, including the weakened pound sterling and lower demand<br />
in Great Britain, the number of passengers increased by 10 % compared<br />
to 2008. This rise, primarily in the Dutch and German markets,<br />
can be attributed to increased marketing and sales efforts directed<br />
towards especially tour operators. The UK market remained on a par<br />
with 2008. The route’s freight turnover was reduced by 19 % in 2009.<br />
The Esbjerg-Harwich route’s passenger revenues and financial<br />
performance were transferred from Ro-Ro Shipping to Passenger<br />
Shipping at the start of 2009. The route made positive progress in<br />
2009, with a 9 % increase in passenger numbers. Most of the increase<br />
was attributable to the Danish market.<br />
Queen of Scandinavia, which has been laid up since the closure of<br />
the Bergen-Newcastle route in September 2008, was chartered out as<br />
a hotel ship for 105 days in 2009. At the end of the year, the ship was<br />
transferred to non-allocated items.<br />
Operating profit before depreciation (EBITDA) was DKK 314<br />
million, an increase of 62 % or DKK 120 million compared to 2008.<br />
The results for 2009 and 2008 are not directly comparable due to<br />
the aforementioned transfer of the Esbjerg-Harwich route, closure of<br />
the Bergen-Newcastle route and the chartering out of a passenger<br />
ship. Adjusted for these factors, and for restructuring costs related to<br />
Project Lighthouse and VAT refunds in 2008, EBITDA rose by DKK<br />
97 million to DKK 298 million, from DKK 201 million in 2008. Approximately<br />
70 % of this increase was due to lower net bunker costs,<br />
including hedging transactions, which constitute a large part of the<br />
saving. The rest of the increase was mainly due to the Amsterdam-<br />
Newcastle route, on which increased passenger earnings and savings<br />
on operational and port costs led to significantly improved performance<br />
and compensated for lower freight earnings.<br />
Depreciation amounted to DKK 211 million, an increase of DKK<br />
31 million, of which DKK 33 million was due to a write-down on the<br />
Queen of Scandinavia.<br />
Operating profit (EBIT) was then DKK 103 million.<br />
Average invested capital was DKK 1,693 million in 2009, a reduction<br />
of 6 % compared to 2008, as depreciation exceeded the level of<br />
investment. At year end, the capital invested in Queen of Scandinavia,<br />
amounting to DKK 152 million, was transferred to non-allocated items.<br />
The ship’s invested capital is thus included in Passenger Shipping’s<br />
invested capital throughout 2009. Return on invested capital was 6.3 %<br />
compared with 0.8 % in 2008.<br />
PASSENGER AND FREIGHT ROUTES (RO-PAX)<br />
PASSENGER AND FREIGHT ROUTES (CRUISE FERRY)<br />
SALES AGENCY<br />
PORT OF CALL<br />
<strong>DFDS</strong> Canal Tours<br />
<strong>DFDS</strong> Canal Tours operates canal tours in the Port of Copenhagen<br />
using 16 boats, including two with restaurants. The number of guests<br />
in 2009 was 720,000, which is on a par with 2008. The boats are also<br />
hired out for charter trips.<br />
In 2009, one of the tourist boats was converted from motor-driven<br />
to battery-operated, which has multiple environmental benefits. Work<br />
has been done on concept development, including guided tours in a<br />
greater number of languages, dinner cruises, art cruises and architectural<br />
cruises.<br />
Financial performance in 2009 was satisfactory.<br />
OSLO<br />
Financial performance<br />
Revenue in 2009 was DKK 1,620 million, 9 % or DKK 159 million lower<br />
than in 2008. Adjusted for the transfer of the Esbjerg-Harwich route’s<br />
passenger revenue at the start of 2009, the closure of the Bergen-<br />
Newcastle route in September 2008 and the chartering out of Queen<br />
of Scandinavia in 2009, revenue fell by 7 % or DKK 116 million.<br />
The adjusted revenue relates to the Oslo and Amsterdam routes,<br />
where 2 % of the decline can be attributed to lower revenue from<br />
oil-price surcharges due to lower oil prices in 2009. Most of the<br />
remaining decline is attributable to the Copenhagen-Oslo route, which<br />
was affected by 3 % fewer passengers, the weakening of the NOK and<br />
generally lower revenue per passenger. On the Amsterdam-Newcastle<br />
route, revenue from ticket sales and catering rose by 10 % adjusted for<br />
the weakened GBP, in line with the increase in the number of passengers.<br />
However, this increase was more than offset by lower revenue<br />
from tobacco sales and freight.<br />
NEWCASTLE<br />
HARWICH<br />
ESBJERG<br />
AMSTERDAM (IJMUIDEN)<br />
HAMBURG<br />
COPENHAGEN
Terminal<br />
Services<br />
Terminal Services operates port<br />
TERMinals in Denmark, England,<br />
the Netherlands and Norway,<br />
which mainly process unit loads,<br />
e.g. trailers, containers, AUTOmobiles<br />
and industrial goods
Business area responsible<br />
Peder Gellert Pedersen<br />
Product concepts<br />
n Loading/discharging of ro-ro, side-port,<br />
lo-lo and conventional tonnage<br />
n Provision of added value services such as,<br />
warehousing, car compounds, transshipments<br />
and road and rail distribution<br />
n Project solutions for special loads<br />
TERMINAL SERVICES (8%)<br />
SHARE OF GROUP<br />
Customer groups<br />
REVENUE<br />
n Freight- and passenger-shipping<br />
companies (short sea), primarily<br />
internal<br />
n Producers of heavy industrial goods<br />
n Overseas car shipping companies (deep sea)<br />
n Overseas break-bulk shipping companies (deep sea)<br />
Brands<br />
n <strong>DFDS</strong> Shipping Logistics<br />
n <strong>DFDS</strong> Auto Logistics<br />
n <strong>DFDS</strong> Scandic Terminal<br />
n <strong>DFDS</strong> Terminalen<br />
n <strong>DFDS</strong> Multi Terminal<br />
n <strong>DFDS</strong> Nordic Terminal<br />
n Northsea Terminal<br />
n KST Terminal<br />
n Moss Container Terminal<br />
Comparable companies/competitors<br />
n Private and publicly owned port terminals in geographical proximity<br />
Locations<br />
n Esbjerg<br />
n Copenhagen<br />
n Rotterdam (Maasvlakte)<br />
n Immingham<br />
n Newcastle (until May 2009)<br />
n Brevik<br />
n Kristiansand<br />
n Moss<br />
n Oslo (ownership share, 33%)<br />
Significant events in 2009<br />
n Sharp downturn in volumes of 20-25 % in H1; slight decline<br />
of 1-2 % in Q3 and improvement of 10-15 % in Q4<br />
n Ongoing development of break-bulk activities in Rotterdam<br />
n Business rates introduced in UK<br />
n Continued reduction of staff numbers across the terminals<br />
n Successful, ongoing streamlining of <strong>DFDS</strong> Nordic Terminal,<br />
Immingham<br />
n Introduction of dynamic planning tools and improved operational/<br />
financial KPI’s<br />
n Operation of Newcastle Terminal transferred to Port of Tyne
34 terminal services<br />
<strong>DFDS</strong> annual report 2009<br />
Markets, activities and customers<br />
The geographical region for <strong>DFDS</strong>’ Terminal services is dictated by<br />
the need to support the internal shipping business units. Each location<br />
is optimally placed to serve the lines in the most efficient and cost<br />
effective manner. <strong>DFDS</strong>’ objective is to create hubs with operation<br />
of several services to/from the same terminals, wherever possible,<br />
enabling customers to optimise their own resources and minimise<br />
their operational cost.<br />
<strong>DFDS</strong>’ main customer segments are: unit loads (trailers/containers),<br />
automotive, forest products, steel, chemicals and project cargo. It is the<br />
terminal’s purpose to support <strong>DFDS</strong>’ growth by providing first class,<br />
cost effective added value services such as: stevedoring, warehousing,<br />
car compounds, timber terminals, road/rail distribution, transhipments<br />
and project cargo solutions. The same services are to an increasing<br />
extent also offered to third-party customers.<br />
The terminal services are linked to <strong>DFDS</strong>’ shipping services by fully<br />
integrated IT systems, whereby customers are provided with seamless,<br />
tailor made IT solutions for their complete supply chains. Important<br />
success criteria for terminal operations include:<br />
n The efficient and safe processing of cargo<br />
n Understanding the industry and customer needs<br />
n Servicing several modes of transport<br />
n Added value activities<br />
n Contributing to the reduction of transit time and total lead time<br />
Market trends<br />
As a result of the high dependency on particularly own ro-ro volumes,<br />
the operation and profitability of Terminal Services follows the market<br />
trend for these shipping routes.<br />
As for the global economy, the market conditions in 2009 were<br />
very challenging for the shipping industry with a sudden decline in<br />
volumes starting in the last part of 2008 continuing into 2009. As a<br />
result, port terminals experienced insufficient capacity utilization and<br />
therefore commenced a process of reducing capacity and costs to<br />
match volumes. A first phase of this process was completed in mid<br />
2009 and resulted in development of terminal operations with higher<br />
levels of efficiency and a more flexible cost base.<br />
Concurrently long-term developments are expected to favour<br />
larger terminals, as there is an increasing demand for terminals with<br />
high levels of efficiency and through-flow. This is expected to lead<br />
to a gradual reduction in the number of smaller ports. In addition,<br />
higher volumes from fewer shipping companies, using larger ships, will<br />
increase the need for on-going productivity improvements in port<br />
terminals.<br />
Integration process<br />
The process of integrating the Terminal Services business unit’s activities<br />
began at the end of 2007. This integration is based on a joint business<br />
model that describes work processes and defines productivity targets.<br />
The model defines joint key operational data that form a basis<br />
for benchmarking of productivity and exchange knowledge and skills<br />
between terminals. This integration enables the organisation to evaluate<br />
new concepts, solutions and strategies, in order to meet increasing<br />
demands for productivity and thereby implement solutions which have<br />
resulted in a reduction in costs.<br />
Efficiency programme implemented in Immingham<br />
2009 was a turbulent year for Terminal Services, with volumes down<br />
on average by 25 % in the first half year, and up to 50 % in specific<br />
areas of activity such as Automotive, Steel and Timber.<br />
An extensive streamlining programme was initiated throughout,<br />
but with particular focus on the largest terminal at Immingham. As a<br />
result, the total workforce was reduced by 24 % against 2008, and cost<br />
as a percentage of turnover was reduced considerably.<br />
In the second half of the year the Immingham terminal experienced<br />
a relatively robust recovery in volumes, including record<br />
monthly volumes for both steel and automotive in the months of<br />
September and October. Employees have supported the efficiency<br />
and productivity measures positively and together with Management<br />
ensured the productivity gains were fully cemented.<br />
As ship’s sizes and capacity continue to increase, the role of port<br />
terminals became increasingly critical. <strong>DFDS</strong> will for these reasons<br />
continue to monitor and review all existing practises and capabilities,<br />
to deliver continued productivity and efficiency gains, cost reductions<br />
and improved performance.<br />
Terminal Services 2008 2009<br />
DKK miLLION Q1 Q2 Q3 Q4 FULL YEAR Q1 Q2 Q3 Q4 FULL YEAR<br />
Revenue 168 169 166 144 647 128 135 145 147 555<br />
Operating profit before depreciation<br />
(EBITDA) 3 0 0 -34 -31 -13 -4 -1 4 -14<br />
Associates 0 0 0 1 1 0 0 0 1 1<br />
Profit/loss on disposal of tangible assets 0 1 0 0 1 0 0 0 1 1<br />
Depreciation -6 -6 -5 -6 -23 -5 -6 -6 -5 -22<br />
Operating profit (EBIT) -3 -5 -5 -39 -52 -18 -10 -7 1 -34<br />
Operating profit margin (EBIT), % -1.8 -3.0 -3.0 -27.1 -8.0 -14.1 -7.4 -4.8 0.7 -6.1<br />
Invested capital, average 419 408 401 356 391 314 321 321 300 312<br />
Return on invested capital (ROIC) p.a., % -2.7 -4.3 -4.6 -43.4 -13.0 -22.1 -11.7 -7.9 0.6 -10.4<br />
Tons, '000 4,543 4,199 4,033 3,656 16,431 3,246 3,356 3,552 3,848 14,002
<strong>DFDS</strong> annual report 2009 terminal services 35<br />
More third-party clients in Rotterdam<br />
The <strong>DFDS</strong> Multi Terminal in Maasvlakte continued the strategy of<br />
attracting third-party break-bulk business, mainly producers of steel<br />
and world-wide projects cargo for oil, gas and energy. The strategy<br />
of further developing operational combinations together with high<br />
customer service resulted in an inflow of customers. As a result, the<br />
terminal handled 12 % more ton in 2009 compared to 2008, whilst<br />
the market experienced a 20 % drop in break-bulk volumes in the<br />
ARA-area (Amsterdam-Rotterdam-Antwerp). This segment will be<br />
developed further in 2010.<br />
Due to the growing share of third-party clients and the demand<br />
for logistics solutions, the activities in <strong>DFDS</strong> Shipping Logistics have<br />
been transferred internally from Ro-Ro Shipping to Terminal Services<br />
in the Netherlands.<br />
56 % OF REVENUE<br />
IS GENERATED<br />
BY INTERNAL<br />
CUSTOMERS<br />
Scandinavian Terminals<br />
Danish and Norwegian terminals also initiated a process of reducing<br />
capacity and costs to match lower market demand. Cost control<br />
actions – such as staffing, reorganisation of machine parks and cost<br />
reviews – improved profitability and efficiency of all terminals.<br />
Development projects<br />
The potential advantages of setting up terminal activities in other<br />
ports in <strong>DFDS</strong>’ route network to support the shipping business<br />
units are regularly assessed. Baltic Sea ports are the main focus of<br />
development projects. The City of Gothenburg has decided to initiate<br />
a privatisation process of parts of the port operations in Gothenburg<br />
and this process will be followed closely as Gothenburg is a major hub<br />
for Ro-Ro Shipping’s operations.<br />
Financial performance<br />
Revenue in 2009 was DKK 555 millions, 14 % lower than in 2008. Approximately<br />
56 % of the revenue was generated by internal activities,<br />
which was comparable to 2008. Revenue was negatively influenced by<br />
decline in volumes especially in the first half of the year, with a gradual<br />
upturn in the second half of the year.<br />
The operating loss before depreciation (EBITDA) was reduced<br />
from a loss of DKK -31 million in 2008 by DKK 17 million to a loss<br />
of DKK -14 million in 2009. The result for 2008 included, however, a<br />
provision for business rates in England of DKK 25 million and one-off<br />
costs of DKK 8 million related to the terminal in Immingham. Adjusted<br />
for these items, EBITDA was a profit of DKK 2 million in 2008 and<br />
EBITDA for 2009 thus corresponds to a decrease of DKK 17 million<br />
of which DKK 7 million concerns the terminal in Immingham. The<br />
effciency of the terminal’s operation was improved in 2009, but the<br />
profit impact of lower activity outweighed this. The remaining decrease<br />
was due to the other terminals, where activity levels likewise was<br />
lower in 2009.<br />
After depreciation of DKK 22 million and profit on disposal of<br />
tangible assets, EBIT was a loss of DKK -34 million, which was mostly<br />
related to <strong>DFDS</strong> Nordic Terminal in Immingham, however, cost savings<br />
and efficiency programmes reduced the loss to a breakeven result in<br />
the latter part of 2009.<br />
Average invested capital was DKK 312 million in 2009, DKK 79<br />
million less than in 2008, mainly due to a low level of investment and<br />
depreciation of GBP. Return on invested capital was negative with<br />
10.4 %, compared to -13.0% in 2008.<br />
PASSAGER- OG FRAGTRUTER (CRUISE FERRY)<br />
PASSAGER- OG FRAGTRUTER (RO-PAX)<br />
PORT TERMINAL<br />
IMMINGHAM<br />
KRISTIANSAND<br />
ROTTERDAM<br />
BREVIK<br />
ESBJERG<br />
OSLO<br />
MOSS<br />
COPENHAGEN
Trailer<br />
Services<br />
Trailer Services operates trailer<br />
companies in several countries<br />
in Northern Europe, primarily<br />
servicing the market with transport<br />
solutions for full loads<br />
using <strong>DFDS</strong>’ route network
Business area responsible<br />
Ole Sehested<br />
Product concepts<br />
n European door-door trailer transport<br />
n Dedicated logistics solutions<br />
(“Just in Time”) for the automobile<br />
industry<br />
Brands<br />
n SpeedCargo<br />
n Halléns<br />
TRAILER SERVICES (11%)<br />
SHARE OF GROUP<br />
REVENUE<br />
Customer groups<br />
n Importers and exporters of consumer goods<br />
n Producers of heavy industrial goods, such as<br />
forestry products, steel, chemicals and plastics<br />
n The automobile industry and its sub-contractors<br />
Comparable companies/competitors<br />
n Cobelfret<br />
n Norfolkline<br />
n P&O Ferrymasters<br />
Sales offices<br />
n Belgium (Ghent)<br />
n Denmark (Copenhagen)<br />
n Finland (Hamina)<br />
n The Netherlands (Rotterdam)<br />
n Ireland (Dublin)<br />
n Norway (Oslo, Brevik, Kristiansand)<br />
n Great Britain (Middlesborough, Immingham)<br />
n Sweden (Gothenburg)<br />
n Germany (Hamburg, Ratingen)<br />
Significant events in 2009/2010<br />
n Demand stabilised at a level of around 10 % lower than in 2008<br />
n Administrative staff reduced by 8 %<br />
n Trailer fleet reduced by 13 %<br />
n Establishment of new traffic between Spain and Belgium<br />
n Takeover of Germany-UK traffic from Schnellecke<br />
n Introduction of refrigerated container traffic between<br />
the Continent and the UK
38 Trailer services<br />
<strong>DFDS</strong> annual report 2009<br />
Markets, activities and customers<br />
Trailer Services provides door-door transport solutions of which<br />
the majority utilises <strong>DFDS</strong>’ route network in order to contribute<br />
to the network’s capacity utilisation. The primary market area<br />
is Northern Europe.<br />
The most important customer groups consist of importers and<br />
exporters of consumer goods, as well as manufacturers of heavy<br />
industrial goods, especially the automobile industry, whose logistics<br />
requirements include a significant element of transport by sea.<br />
Market trends<br />
Like the Group’s other freight-based business areas, the market<br />
trend for the door-door segment was characterised by a declining<br />
level of activity.<br />
Traffic between Sweden and the Continent was affected by<br />
reduced demand from the automobile industry, while traffic between<br />
Scandinavia and the UK experienced a shift in balance that resulted<br />
in increased equipment and positioning costs. Overcapacity on the<br />
market led to falling demand and greater price competition.<br />
In general, no significant changes in demand are expected in<br />
2010, but some growth is envisaged in markets where <strong>DFDS</strong>’ current<br />
market share is marginal. The primary focus will continue to be on<br />
improving profit margins through increased productivity and sales.<br />
Trailer success criteria<br />
The most important success criteria for Trailer Services are reliability<br />
of capacity, and delivery based on competitive cost levels. It is also important<br />
that combined trailer solutions, which utilise both rail and sea,<br />
provide a more environmentally positive alternative to road transport.<br />
Integration of the business area<br />
<strong>DFDS</strong>’ door-door IT system was installed in Sweden and Norway<br />
in January 2009. By mid-2010, all trailer companies in the business<br />
unit are expected to operate on the same IT platform. This<br />
will increase the possibilities for co-ordinating sales resources and<br />
optimising traffic, and will improve utilisation of the established joint<br />
trailer pool. It will also provide opportunities to further streamline<br />
administrative processes.<br />
In 2009, management of the Dutch subsidiary of SpeedCargo was<br />
merged with <strong>DFDS</strong> Container Line. Likewise, management has now<br />
been integrated in Norway, Belgium, the UK and Ireland.<br />
In order to strengthen the overall network and increase geographical<br />
coverage, integration of subsidiaries in the business unit will continue<br />
in 2010. Another important objective of the integration process<br />
is to continue to strengthen the basis for offering network solutions<br />
that incorporate multiple parts of <strong>DFDS</strong>’ route network.<br />
Activity DEVELOPMENT<br />
Despite difficult market conditions and lower level of activity, financial<br />
performance improved in 2009. This can largely be attributed to the<br />
activities of the Belgian company Halléns and SpeedCargo’s activities<br />
in the UK and Germany. Traffic was reduced between the UK and<br />
Scandinavia, mostly as a result of major imbalances in the flows of<br />
goods. The management of the Swedish SpeedCargo subsidiary was<br />
replaced in May 2009.<br />
Merging administrative tasks with similar functions in Container Shipping’s<br />
offices led to more efficient overall financial management. The falling<br />
level of activity also necessitated adaptation of the organisation, with<br />
an 8 % reduction in the number of staff. The efficiency drive will continue<br />
as all the companies in the business unit become increasingly closely<br />
integrated, e.g. following implementation of the joint IT system.<br />
Halléns’ traffic between Sweden and the Continent decreased<br />
significantly as a result of lower production in the automobile industry.<br />
Changes in the balance of traffic between Finland, Sweden and Denmark<br />
resulted in greater unused capacity and increased haulage costs.<br />
Halléns established a new trailer traffic between the Nordic Region<br />
and the Continent/Spain, based on ro-ro routes between Zeebrugge<br />
and Bilbao/Santander.<br />
In December 2009, the German SpeedCargo subsidiary reached<br />
agreement with the German transport and logistics company Schnellecke<br />
to take over trailer activities between North Germany and the UK.<br />
These activities make extensive use of <strong>DFDS</strong>’ ro-ro route between Cuxhaven<br />
and Immingham, which is an integral part of the transport chain.<br />
At the end of 2009, the trailer fleet comprised 1,400 units, of<br />
which approximately one third were owned compared to two-thirds<br />
previously. Overall, the trailer fleet has been reduced by 500 units,<br />
notwithstanding the addition of 300 mega-trailers. The share of inhouse<br />
haulage was also reduced on the Continent in order to achieve<br />
greater flexibility and lower costs.<br />
Trailer Services 2008 2009<br />
DKK miLLION Q1 Q2 Q3 Q4 FULL YEAR Q1 Q2 Q3 Q4 FULL YEAR<br />
Revenue 258 262 230 213 963 182 201 195 198 776<br />
Operating profit before depreciation<br />
(EBITDA) 15 9 5 2 31 12 13 7 4 36<br />
Associates 1 0 1 0 2 0 0 0 0 0<br />
Profit/loss on disposal of tangible assets 0 1 0 1 2 0 1 1 4 6<br />
Depreciation -8 -7 -7 -6 -28 -6 -8 -9 -8 -31<br />
Operating profit (EBIT) 8 3 -1 -3 7 6 6 -1 0 11<br />
Operating profit margin (EBIT), % 3.1 1.1 -0.4 -1.4 0.7 3.3 3.0 -0.5 0 1.4<br />
Invested capital, average 234 229 228 228 231 229 243 285 284 260<br />
Return on invested capital (ROIC) p.a., % 12.5 4.9 -3.7 -6.8 1.8 9.7 8.5 0.1 -0.5 4.1<br />
Shipments, '000 21 20 17 16 74 16 17 16 18 67
<strong>DFDS</strong> annual report 2009 Trailer services 39<br />
Financial performance<br />
As a result of the general market trend, revenue was reduced by 19 %<br />
in 2009 to DKK 776 million. Compared to 2008, the number of shipments<br />
was around 9% lower. Revenue was also negatively impacted by<br />
lower rates and lower oil and diesel fuel supplements.<br />
Despite the decline in revenue, operating profit before depreciation<br />
(EBITDA) rose by 16 % to DKK 36 million, an increase of DKK 5<br />
million. The EBITDA margin increased in 2009 to 4.6 %, from 3.2 % in<br />
2008. The margin was improved in the Belgian and Dutch companies<br />
through rationalisation and adjustment of operating costs, including<br />
lower haulage costs and adjustments to the administration. Operations<br />
also improved in the German company.<br />
Depreciation increased from DKK 28 million in 2008 to DKK 31<br />
million due to the renewal of the trailer fleet and a minor write-down.<br />
This includes DKK 9 million depreciation of the customer portfolio,<br />
most of which relates to Halléns. After 2010, this customer portfolio<br />
will be fully depreciated.<br />
Operating profit (EBIT) was DKK 11 million, an increase of<br />
DKK 4 million. This also includes an increase of DKK 4 million<br />
from the sale of tangible assets.<br />
Average invested capital rose by DKK 29 million to DKK 260 million.<br />
The increase is primarily due to the addition of new trailers, as<br />
well as increased goodwill from the acquisition of the remaining 20 %<br />
stake in Halléns. The return on invested capital in 2009 was 4.1 %.<br />
TRAILER SERVICES<br />
SUPPORTS THE<br />
ROUTE NETWORK’S<br />
CAPACITY<br />
UTILIZATION<br />
FRAGTRUTER (RO-RO)<br />
PASSAGER- OG FRAGTRUTER (RO-PAX)<br />
SALES AGENCY<br />
HAMINA<br />
OSLO<br />
BREVIK<br />
KRISTIANSAND<br />
GOTHENBURG<br />
COPENHAGEN<br />
DUBLIN<br />
MIDDLESBROUGH<br />
IMMINGHAM<br />
HAMBURG<br />
ROTTERDAM<br />
RATINGEN<br />
GHENT
40 Customer Focus<br />
<strong>DFDS</strong> annual report 2009<br />
Freight Sales<br />
solutions / FSS<br />
n Market shares increased in several industries<br />
n Large potential in the increasing frequency of major<br />
corporate agreements<br />
n Ongoing adaptation of the sales organisation to<br />
the network strategy<br />
Freight Sales Solutions (FSS) is a joint sales function that services major<br />
customers with transport solutions that cut across business areas<br />
and regions. FSS is also responsible for developing shipping logistics<br />
solutions matching the growing requirements from large freight customers<br />
with increasingly complex supply chains.<br />
FSS’ activities are based on a key-accounts concept, which ensures<br />
co-ordinated sales activities for major customers. In 2009, the portfolio<br />
of large customers accounted for approximately 25 % of total group<br />
revenue from freight-related business. FSS also operates a number of<br />
Commodity Teams that collate and process information, expertise and<br />
insight into the transport needs of selected industries. This knowledge<br />
is used to generate additional sales and to develop new services<br />
targeted at individual customers. In addition, strategic plans with a time<br />
frame of one year are drawn up for each major customer.<br />
FSS focuses on transport requirements in the following industries:<br />
n Passenger vehicles, trucks, buses, etc. (Autologistics)<br />
n Forestry<br />
n Chemicals<br />
n Steel<br />
n Project cargo<br />
n Trailer and container operators<br />
FSS is responsible for joint marketing of the Group’s freight services,<br />
and for drawing up and co-ordinating tenders for large-scale transport<br />
solutions. It also organises seminars and conferences for the purpose<br />
of enhancing skills and improving internal co-operation among keyaccount<br />
managers in the different business areas. The latter further<br />
underpins the sales organisation’s shift in focus from individual routes<br />
to a network-based approach.<br />
Forestry: <strong>DFDS</strong>’ paper-industry customers operate primarily<br />
in Sweden and Norway. Volumes on the Swedish market slightly<br />
increased in 2009, despite a general fall elsewhere. Producers of<br />
packaging for liquids and other niche products made the most<br />
progress. On account of market conditions, sales work was mainly<br />
directed at retaining existing customers, with some new customer<br />
accounts added.<br />
Chemicals: Chemical production fell in 2009 following weak<br />
demand in H1, although H2 was characterised by an upward<br />
trend. Changing market conditions led to the closure of production<br />
facilities in Europe, which meant that volumes from transporters<br />
of powdered and liquid chemicals fell by approximately<br />
30 % and 15 % respectively. <strong>DFDS</strong>’ chemical volumes were reduced<br />
by around 8 % in 2009.<br />
Steel: The steel market was charaterized by a scaling-down<br />
and reduction of production and capacity, including the closure of<br />
facilities, due to high stock levels and declining revenues. Around<br />
the middle of Q3, the market began to recover and activity levels<br />
rose again. This trend is expected to continue in 2010.<br />
Project cargo: <strong>DFDS</strong> handles project cargo (large, odd-sized<br />
loads) by sea and road. These activities are concentrated in<br />
regions linked to the port terminals in Rotterdam (Holland) and<br />
Immingham (UK). In 2009, the multi-terminal at Maasvlakte, Rotterdam,<br />
increased its order book, including loads with less dependency<br />
on shipping.<br />
Trailer and container: The primary focus of sales work in this<br />
segment was to generate organic growth through existing large<br />
trailer operators with widespread traffic flows in Continental Europe,<br />
Scandinavia, the Baltic states, Russia and the rest of Eastern<br />
Europe. Collaboration with these customers included adjusting<br />
freight rates on individual routes to support network-based solutions<br />
for each major customer and for <strong>DFDS</strong> as a whole. This has<br />
also contributed to developing internal co-operation between<br />
business areas and their activities.<br />
GROUP MANAGEMENT<br />
Industry trends 2009<br />
Automotive: In 2009, the volume of vehicles transported in the shipping<br />
market fell by approximately 30 %, with the biggest reduction in<br />
heavy vehicles. The fall in <strong>DFDS</strong>’ volumes was approximately 25 %, with<br />
a particularly negative impact in the Baltic states and Russia, implying<br />
a rise in <strong>DFDS</strong>’ market share in 2009. The decline in volume was<br />
greatest in H1, with higher activity in H2 where several new contracts<br />
were signed with leading automobile manufacturers in Europe, also as<br />
a result of closer contact with markets and customers.<br />
RO-RO<br />
SHIPPING<br />
CONTAINER<br />
SHIPPING<br />
PASSENGER<br />
SHIPPING<br />
FREIGHT SALES SOLUTIONS<br />
GROUP FUNCTIONS<br />
TERMINAL<br />
SERVICES<br />
TRAILER<br />
SERVICES
<strong>DFDS</strong> annual report 2009 HEADER 41<br />
ArcelorMittal and <strong>DFDS</strong><br />
ArcelorMittal is the world’s largest steel producer with<br />
a very important presence in Northern Europe.<br />
In the past five years <strong>DFDS</strong>’ co-operation with various<br />
Belgian and French ArcelorMittal mills has grown<br />
through delivery of logistics services that has steadily<br />
improved leadtimes, flexibility and reliability in Arcelor-<br />
Mittal’s supply chain, making <strong>DFDS</strong> a preferred supplier<br />
for specific trade lanes.<br />
<strong>DFDS</strong>’ services to ArcelorMittal are provided through<br />
three different business units. Ro-Ro Shipping supports<br />
ArcelorMittal’s Swedish transport strategy for 70.000<br />
tons of steel through EuroBridge connecting Ghent and<br />
Gothenburg including warehousing and JIT distribution<br />
to customers, Terminal Services’ port terminals in Immingham<br />
and Rotterdam annually handle more than<br />
120,000 tons of steel coils and pipes and Trailer Services<br />
transport 10.000 tons of long products in full trailer loads<br />
between France, Belgium, Luxembourg and Sweden.<br />
On the back of a strategic customer plan FSS coordinates<br />
<strong>DFDS</strong>’ services across business units to ensure<br />
customer requirements are fulfilled and new opportunities<br />
identified.
42 Environmental report<br />
<strong>DFDS</strong> annual report 2009<br />
Environmental<br />
report – CSR<br />
Environmental policy<br />
AVERAGE CONSUMPTION OF THE TOTAL FLEET<br />
G/GROSS TONNAGE/NAUTICAL MILE<br />
(g/GT/Nm)<br />
n We are committed to improving our operations and<br />
activities on an ongoing basis in order to reduce our<br />
energy consumption and our impact on the environment.<br />
n We will regularly record and analyse our energy consumption<br />
and environmental impact, and disseminate<br />
knowledge of company environmental policy among<br />
our staff in order to ensure a high degree of awareness<br />
about environmental issues.<br />
n We will continuously develop and extend our technical<br />
expertise in order to ensure constant progress towards<br />
more sustainable operations.<br />
6,3<br />
6,2<br />
6,1<br />
6,0<br />
5,9<br />
5,8<br />
5,7<br />
5,6<br />
5,5<br />
Q1 Q2 Q3 Q4<br />
2007<br />
Q1 Q2 Q3 Q4 Q1 Q2 Q3 Q4<br />
2008<br />
2009<br />
Most of <strong>DFDS</strong>’ impact on the surrounding environment is associated<br />
with the operation of ships, and therefore the environmental work is<br />
focused on reducing emissions, as well as developing and implementing<br />
new environmental technology. The marine environment is protected<br />
by national and international laws and regulations, and <strong>DFDS</strong> respects<br />
and supports the continued development of rules designed to make<br />
shipping more sustainable in the future.<br />
Reducing emissions<br />
<strong>DFDS</strong> is focused on reducing emissions of harmful substances from<br />
ships’ engines using bunker. In particular, the work is directed at cutting<br />
emissions of CO 2<br />
, NOx, SOx and particles into the atmosphere.<br />
CO 2<br />
: In 2007, <strong>DFDS</strong> set a target of a 10 % reduction (adjusted<br />
for capacity changes) in emissions of CO 2<br />
over a five-year period.<br />
Bunker consumption and emissions are measured continuously on<br />
all ships, and the results are distributed throughout the fleet. In 2009,<br />
bunker consumption was approximately 13 % lower than in 2008.<br />
However, most of this decline reflects the reduction in the number<br />
of sailings, as capacity has been adjusted to lower demand in the<br />
transport market. In order to distinguish the streamlining of bunker<br />
consumption from fluctuations in capacity, consumption, and therefore<br />
emissions, are quantified per transport unit.<br />
Measured per transport unit, bunker consumption and emissions<br />
in 2009 were reduced by 2.7 % compared to 2008 and by 4.5 % compared<br />
to 2007. <strong>DFDS</strong> is therefore well on its way towards the goal of<br />
a 10 % reduction in CO 2<br />
emissions over five years.<br />
The reductions in emissions can be attributed to <strong>DFDS</strong>’ bunkersaving<br />
programme, one element of which is cutting speed – a key factor<br />
in reducing consumption and emissions. To this end, projects have<br />
been implemented to ensure faster transhipment in ports reducing<br />
port time and allowing sailing time to rise. Other initiatives include optimising<br />
engine power and efficiency; better voyage planning; utilisation<br />
of waste heat; and frequent hull cleanings to reduce water resistance.<br />
Information and motivation<br />
Another major factor in this work is motivating staff to contribute<br />
to energy savings. In order to increase motivation, information is<br />
distributed about the environmental policy and objectives, and its<br />
emission-reduction initiatives. This is done on a regular basis through<br />
internal communications that prioritise environmental issues, as well<br />
as through special bulletins about environmental initiatives. A prize of<br />
DKK 50,000 is awarded each quarter to the ship’s crew whose efforts<br />
have resulted in the largest reductions.<br />
Consolidation around larger ships<br />
The most effective way of reducing energy consumption, and therefore<br />
CO 2<br />
emissions, is fleet renewal. Modern ships’ engines utilise<br />
energy more efficiently, and carry more freight using fewer but larger<br />
ships. In 2009, the ro-ro ships Tor Ficaria, Tor Begonia and Tor Freesia<br />
were each extended by 30 metres, which increased freight capacity<br />
from approximately 3,800 lanemetres to approximately 4,600 lane<br />
metres. Despite a capacity increase of over 20 %, the ships’ energy<br />
consumption only increased marginally, while CO 2<br />
emissions were<br />
reduced significantly per lanemetre.<br />
Sulphur (SOx): Ships’ emissions of sulphur are dependent on the<br />
amount of oil burned, and the sulphur content of the fuel oil.<br />
In 2010, two directives issued by the IMO and the EU regarding the<br />
use of low-sulphur bunker come into force in the Baltic Sea and the<br />
North Sea, both of which are designated as ECAs (Emission Control<br />
Areas). One directive came into force in early 2010 limiting the sulphur<br />
content of bunker to a maximum of 0.1 % while in port. The second<br />
directive comes into force in early July, and relates to a reduction of<br />
the sulphur content in bunker from 1.5 % to 1.0 % for shipping in the
<strong>DFDS</strong> annual report 2009 Environmental report 43<br />
Comparison of bunker consumption per unit<br />
for older and modern/larger ships<br />
Ship<br />
Year built<br />
Length,<br />
metres<br />
Deadweight,<br />
tons<br />
Lane<br />
metres<br />
Consumption<br />
at 18 knots,<br />
g/nm/lm<br />
Tor Baltica 1977 169 9,700 1,870 58<br />
Tor Selandia 1998 198 11,080 2,770 48<br />
Tor Magnolia 2003 200 10,070 3,830 33<br />
Tor Ficaria<br />
(extended) 2006 230 14,600 4,650 29<br />
Baltic Sea and the North Sea. In the longer term, rules will be introduced<br />
that reduce sulphur content in bunker to 0.1 % in 2015.<br />
New environmental technology<br />
Technologies are also being developed to reduce the sulphur content<br />
of bunker on board ships. <strong>DFDS</strong> is collaborating with Aalborg<br />
Industries and MAN Diesel to develop a so-called “scrubber” that can<br />
remove 98 % of sulphur and 70 % of the particles from emissions. In<br />
2010, one such scrubber, which consists of approximately 30 tons of<br />
heavy plant, will be tested as part of the exhaust system on Tor Ficaria.<br />
If it lives up to expectations, the scrubber will be a significant tool<br />
for reducing emissions of sulphur and particles, particularly in urban<br />
areas. The method may also be an alternative to using bunker with<br />
low sulphur content, as the scrubber is expected to be able to reduce<br />
sulphur emissions to at least the same level.<br />
NOx: Ships’ engines expel varying degrees of NOx (nitrogen oxides)<br />
from combustion. These emissions are caused by the combustion temperature,<br />
and newer engines are designed to operate at temperatures<br />
that reduce NOx. Emissions are therefore reduced on modern ships<br />
like Tor Fionia, Tor Jutlandia, Tor Corona and Tor Hafnia.<br />
NOx emissions are a particular problem in and around ports.<br />
Ships calling at terminals close to urban and residential areas in Oslo<br />
and Copenhagen therefore use catalytic converters to purify smoke<br />
from their auxiliary engines, which produce power for onboard<br />
consumption.<br />
Another way to reduce emissions of harmful substances while<br />
in port is to use land-based sources of power. This is only possible<br />
in ports that provide power through special coupling points on the<br />
quay. This possibility is currently being assessed, e.g. in Gothenburg, in<br />
collaboration with the port company. At the same time, several options<br />
are being evaluated for environmentally friendly onboard power<br />
generation.<br />
2009. The latter is an as yet unratified international regulatory framework<br />
designed to ensure responsible scrapping of ships. It is expected<br />
to come into force in 2013. <strong>DFDS</strong> supports this convention and other<br />
initiatives that, in the meantime, ensure that ships are scrapped in a<br />
responsible fashion in relation to both the surrounding environment<br />
and the working environment. This policy formed the basis for the sale<br />
in early 2010 of a ro-ro ship, Tor Anglia, for scrap to the environmentally<br />
certified Jiangmen Yinhu shipyard in China.<br />
Battery-powered eco-friendly canal boats<br />
<strong>DFDS</strong>’ subsidiary <strong>DFDS</strong> Canal Tours operates tour boats in the Port<br />
of Copenhagen and the canals in the centre of the city. The engine<br />
noise and exhaust fumes of the boats place a strain on the surrounding<br />
urban environment, and <strong>DFDS</strong> has decided to develop and deploy<br />
a battery-powered boat, which is recharged at night when the proportion<br />
of environmentally friendly produced electricity is highest. The<br />
first of these emission- and noise-free boats has been delivered and<br />
will be operational from the start of the 2010 season. If the el-boat<br />
lives up to expectations, ships of this type are expected gradually to<br />
replace the existing boats.<br />
Other priorities<br />
Work is also being systematically carried out on the processing of<br />
waste and sewage from ships under the rules of the countries in<br />
which they dock. In addition, further work is being done to reduce<br />
noise during calls and stays in port.<br />
Certification<br />
<strong>DFDS</strong> has subsidiaries in several countries in Northern Europe, and<br />
does not currently have joint environmental certification for the whole<br />
Group, but various forms of certification in the various companies.<br />
<strong>DFDS</strong> has therefore decided to attain joint ISO 14001 environmental<br />
certification. The process has already started on the ro-ro routes from<br />
Gothenburg to Great Britain, Norway and the Continent. Once this<br />
work has been completed, the certification will be gradually extended<br />
to other parts of the Group.<br />
Environmentally friendly scrap<br />
It is <strong>DFDS</strong>’ policy to only sell ships for scrap when it can be guaranteed<br />
that the scrapping will be in accordance with national and international<br />
legislation, and in accordance with the intentions of the Hong<br />
Kong Convention agreed under the auspices of the IMO in October
44<br />
HR REport<br />
<strong>DFDS</strong> annual report 2009<br />
Human Resources – CSR<br />
Employees’ skills, commitment and wellbeing are crucial to <strong>DFDS</strong>’<br />
success. The development of human resources and welfare at work<br />
are, therefore, important strategic foundations for the company.<br />
“It is the people that distinguish the successful company<br />
from the less successful one. Our professional and social skills,<br />
along with a constant focus on business results, are what<br />
makes the difference.”<br />
Henrik Holck, Executive Vice President, HR<br />
Management development<br />
<strong>DFDS</strong>’ management programme focuses on developing the individual<br />
managers’ skills through an internal training program called ZOOM.<br />
The programme was developed by Corporate HR and tailored to suit<br />
both the composition of the management team and <strong>DFDS</strong>’ general<br />
situation. ZOOM consists of two modules. The first is an intensive<br />
course of theory and practical teaching that focuses on the role of<br />
the manager, communication, <strong>DFDS</strong>’ strategy for staff development,<br />
and exchanges of knowledge and experience between different areas.<br />
The programme also includes input from and dialogue with Group<br />
Management, including the CEO and HR director, about the company’s<br />
goals.<br />
The second module consists of practical training. It is important<br />
for this programme that each team comprises leaders from various<br />
fields, including land- and sea-based positions, as well as from the different<br />
Northern European countries that make up <strong>DFDS</strong>’ geographic<br />
business area. The purpose of the modules is to equip managers with<br />
a greater knowledge and understanding not only of the professional<br />
work environment, but also of its social and psychological aspects,<br />
their own role as managers, and their colleagues’ situation. In addition,<br />
a number of targets and opportunities serve to develop the individual<br />
employee in relation to <strong>DFDS</strong>’ goals and strategy.<br />
“<strong>DFDS</strong> managers have to generate job satisfaction. Great job<br />
satisfaction generates better results and even greater success…”<br />
Henrik Holck, Executive Vice President, HR<br />
In 2009, approximately 115 managers participated in the ZOOM<br />
course, split almost equally between managers of sea-based and landbased<br />
positions. Efforts were made to ensure representation from all<br />
functions, including managers from the deck and engine crews. In 2010,<br />
120 managers are expected to take part, an increasing proportion of<br />
whom will be from outside Denmark.<br />
Employee wellbeing<br />
An important goal for <strong>DFDS</strong> is that employees thrive in their jobs, and<br />
that the individual employee experiences that <strong>DFDS</strong> is a workplace<br />
that offers good conditions and opportunities for personal development.<br />
In co-operation with external suppliers, extensive studies are<br />
conducted at regular intervals to monitor staff wellbeing. In 2009, about<br />
75 % of staff took part in the survey, the results of which will be used as<br />
a basis for further work to improve and develop <strong>DFDS</strong> as a workplace.<br />
The study was conducted during the economic crisis of 2009, after<br />
changing market conditions necessitated reductions in staffing levels.<br />
Notwithstanding this difficult background, the survey results showed a<br />
generally high level of job satisfaction that was only marginally below<br />
the level for 2008. In general, satisfaction and motivation were high,<br />
scoring 5.2 (compared to 5.3 in 2008) out of a maximum 7. Loyalty<br />
to <strong>DFDS</strong> scored 5.9 out of a maximum 7, which was on a par with<br />
2008. Satisfaction with immediate line managers was generally high<br />
(5.7 against 5.8 in 2008), although the study revealed the need for<br />
improving efforts to increase individuals’ opportunities for professional<br />
and personal development.<br />
Further development<br />
The survey from 2009 provides the basis for the further development<br />
of <strong>DFDS</strong> as a workplace in 2010. In addition to identifying areas<br />
for improvement at Group level, the study also provides results for<br />
individual business areas and departments. These results are communicated<br />
by the management of the business areas to the individual<br />
departments for information, discussion and follow-up. Each department<br />
then submits specific development plans for areas identified as<br />
in need of change or development. A follow-up wellbeing survey will<br />
be conducted in autumn 2011.<br />
Other courses<br />
As well as the management-development programme, a number of<br />
statutory and safety-training courses are held each year for staff at sea,<br />
as well as focus on provision of relevant technical-training courses in<br />
some departments.<br />
Employee development interviews<br />
All employees participate in development review meetings with their<br />
immediate line manager once a year. These reviews focus on the<br />
individual employee’s situation, including the relationship between their<br />
job expectations, their skills and their actual duties. The interview also<br />
covers the employee’s performance in relation to the demands of the<br />
job and their jointly agreed goals for the year.
<strong>DFDS</strong> annual report 2009 HR REport 45<br />
Recruitment<br />
New employees to <strong>DFDS</strong> are often recruited locally, partly through<br />
recruitment agencies in the various countries, partly via the company’s<br />
website. Other increasingly popular recruitment channels include educational<br />
institutions and social networking websites, e.g. Facebook.<br />
In addition to this targeted recruitment of employees, <strong>DFDS</strong> is<br />
part of Blue Denmark, a joint maritime industry project under the<br />
auspices of the Danish Shipowners’ Association. Blue Denmark aims to<br />
highlight the many good jobs, management positions and development<br />
opportunities in the maritime industry. Its target audience primarily<br />
consists of young people.<br />
Training of apprentices and trainees<br />
Every year, <strong>DFDS</strong> trains apprentices in economics, as well as shipping,<br />
administration and travel, and this is an important investment in our<br />
future employees. These two-year programmes attract large numbers<br />
of applications, and include practical experience and international cooperation.<br />
Shipping apprentices, for example, spend a year at offices<br />
abroad, where they gain personal experience of other countries’ labour<br />
markets and business environments within a secure framework.<br />
In addition, <strong>DFDS</strong> acts as a work-placement venue, and offers<br />
many opportunities, both on land and on board, for young people<br />
to train as ship’s officers, cooks, waiters, etc.<br />
Information<br />
<strong>DFDS</strong> strives to provide employees and managers with quick, open,<br />
clear and credible communication about its development strategy,<br />
especially with regard to changes that may affect individual employees<br />
and the reasons for those changes. The goal is for changes and new<br />
initiatives to be communicated directly to employees via internal<br />
media or meetings before the news is broken by external media<br />
or spread by rumour.<br />
In late 2009, <strong>DFDS</strong> concluded an agreement, which is expected<br />
to be approved in Q2 2010, to acquire Norfolkline. Making optimal use<br />
of both organisations’ strengths is a prerequisite for the future<br />
success of the combined entity. The merger of the two organisations<br />
will therefore entail a significant focus on HR in order to ensure<br />
continuous, transparent and credible internal communication about<br />
the integration process for both Norfolkline and <strong>DFDS</strong> staff.<br />
Social initiatives<br />
<strong>DFDS</strong> has entered into collaboration with “High Five” in order to<br />
create job opportunities for young people with a criminal record.<br />
The aim is to give these disadvantaged young people the chance<br />
to work in a real job with long-term potential. In 2009, a total of<br />
12 former young offenders were employed on ships under this<br />
programme and the results were positive.<br />
REVENUE PER EMPLOYEE<br />
(ADJUSTED FOR BUNKER SURCHARGE)<br />
(DKK MILLION)<br />
2,0<br />
1,8<br />
1,6<br />
1,4<br />
DISTRIBUTION OF EMPLOYEES<br />
ON LAND AND SEA<br />
(NO. OF EMPLOYEES)<br />
5.000<br />
4.000<br />
3.000<br />
1,2<br />
1,0<br />
2.000<br />
0,8<br />
0,4<br />
0,0<br />
1.000<br />
0<br />
2007<br />
2008<br />
2009<br />
2007<br />
2008<br />
2009<br />
LAND<br />
SEA
46 Shareholder information<br />
<strong>DFDS</strong> annual report 2009<br />
Shareholder<br />
information<br />
Share capital<br />
<strong>DFDS</strong> A/S’ share capital remained unchanged at DKK 800 million<br />
throughout 2009. There is only one class of share divided up into<br />
8,000,000 shares, each with a nominal value of DKK 100. The <strong>DFDS</strong><br />
share is listed on NASDAQ OMX Copenhagen.<br />
Price trend<br />
The <strong>DFDS</strong> share price at the end of 2009 was 358, down 10 % from<br />
the end of 2008. By comparison, an index consisting of six comparable<br />
companies (Peer Group Index) declined by 13 % in 2009. The NAS-<br />
DAQ OMX Copenhagen total index (OMXC) rose by 32 % in 2009.<br />
<strong>DFDS</strong>’ Peer Group Index consists of the following companies:<br />
Attica Group (GR); Finnlines (SF); Irish Continental Group (IE); Tallink<br />
(ES); Transatlantic (S); and Viking Line (SF).<br />
The market value of the total share capital at year-end 2009 was<br />
DKK 2,864 million. The market value of the turnover in <strong>DFDS</strong> shares<br />
was DKK 219 million in 2009, a reduction of 63 % compared to 2008.<br />
The total shareholder return (price change plus proposed dividend<br />
yield) was -10% in 2009.<br />
Shareholders<br />
At the end of 2009, <strong>DFDS</strong> had 16,711 registered shareholders,<br />
who owned 86.1 % of the share capital. The principal shareholder<br />
at the end of 2009 was The Lauritzen Foundation (Vesterhavet<br />
Holding A/S), with 56.0 %.<br />
Shareholders abroad owned 2.0 % of the share capital at<br />
the end of 2009, compared with 5.0 % at the end of 2008.<br />
Dividend<br />
<strong>DFDS</strong>’ dividend policy aims to distribute an annual dividend corresponding<br />
to approximately 30 % of annual net profit. However, the<br />
annual dividend is determined with due consideration to <strong>DFDS</strong>’<br />
investment requirements and a satisfactory capital structure.<br />
<strong>DFDS</strong>’ Supervisory Board proposes that no dividend be paid for<br />
2009 due to the low profit level and the need to maintain a solid<br />
capital structure.<br />
INVESTOR RELATIONS<br />
Søren Brøndholt Nielsen, Head of IR and M&A<br />
Tel.: +45 33 42 33 59<br />
E-mail: sbn@dfds.com<br />
Financial calendar<br />
Annual General Meeting<br />
26 March 2010 at 14:00<br />
Radisson SAS Falconer Center<br />
Falkoner Allé 9<br />
DK-2000 Frederiksberg, Denmark<br />
Interim report in 2010<br />
Q1 report: 12 May<br />
H1 report: 18 August<br />
Q3 report: 16 November<br />
Analysts covering the <strong>DFDS</strong> share<br />
DANSKE MARKETS EQUITIES<br />
Johannes Møller<br />
Tel: +45 4512 8036<br />
E-mail: joml@danskebank.dk<br />
HANDELSBANKEN CAPITAL MARKETS<br />
Dan Togo Jensen<br />
Tel: +45 3341 8246<br />
E-mail: dato01@handelsbanken.dk<br />
SEB ENSKILDA<br />
Steven Brooker<br />
Tel: +45 3697 7000<br />
E-mail: steven.brooker@enskilda.dk<br />
NORDEA<br />
Finn Bjarke Petersen<br />
Tel: +45 8896 8606<br />
E-mail: finn.bjarke.petersen@nordea.com<br />
STANDARD & POOR’S<br />
Marco Troiano<br />
Tel: +44 20 7176 3964<br />
E-mail: marco_troiano@sandp.com
<strong>DFDS</strong> annual report 2009 Shareholder information 47<br />
Company announcements 2009*<br />
DATE<br />
Announcement<br />
INDEXED SHARE PRICE 2009-2010<br />
(DKK)<br />
23/12 <strong>DFDS</strong> A/S – Financial Calendar 2010<br />
22/12 Extraordinary General Meeting<br />
17/12 <strong>DFDS</strong> Creates Northern Europe's Leading Sea-Based<br />
Transport Network<br />
12/11 Q3 Report 2009<br />
30/9 <strong>DFDS</strong> Adjusts HQ<br />
28/9 <strong>DFDS</strong> Adjusts Manning In Lithuania<br />
1/9 Adaptation Of Ship Operations<br />
13/8 Half-Year Report 2009<br />
17/6 Agreement between Vesterhavet A/S And DSV A/S On Joint<br />
Ownership Of Major Shareholding Cancelled<br />
28/5 <strong>DFDS</strong> Strenghtens Management With Internationally<br />
Experienced CFO<br />
20/5 Agreement On Sale Of Passenger Ship Cancelled<br />
13/5 Q1 Report 2009: More Stable Markets, But Still Low Visibility<br />
12/5 Sale Of Passenger Ship<br />
1/5 <strong>DFDS</strong> Comments On Information Concerning A Possible<br />
Transaction<br />
7/4 Articles Of Association Of <strong>DFDS</strong> A/S<br />
1/4 <strong>DFDS</strong> A/S – Schedule For Ordinary AGM On April 1 2009<br />
12/3 To the Shareholders of <strong>DFDS</strong> A/S<br />
9/3 Annual Report 2008: <strong>DFDS</strong> Prepared For Challenging 2009<br />
25/2 Award Of Share Options To The Executive Board<br />
18/2 Majority Shareholder Announcement<br />
29/1 Changes to the Executive Management of <strong>DFDS</strong> A/S<br />
13/1 Majority Shareholder Announcement<br />
600<br />
500<br />
400<br />
300<br />
200<br />
JAN<br />
2009<br />
FEB MAR APR MAY JUN JUL AUG SEP OCT NOV DEC JAN FEB<br />
2010<br />
<strong>DFDS</strong><br />
PEER GROUP<br />
TOTAL INDEX (OMXC)<br />
* Statements about trading subject to compulsory reporting are not included in this list<br />
Key figures<br />
2005 2006 2007 2008 2009<br />
Earnings per share, DKK 23 46 52 32 11<br />
Dividend per share, DKK 7,5 11 15 0 0<br />
Dividend payout ratio, % 32 24 29 0 0<br />
Dividend yield, % 2.0 1.6 1.9 0.0 0.0<br />
P/E ratio, times 16 15 15 12 33<br />
Equity per share, DKK 350 394 442 427 455<br />
Price/book value, times 1.09 1.73 1.79 0.93 0.79<br />
Share price, DKK:<br />
Price at year-end 382 680 790 399 358<br />
Price high 465 698 950 785 416<br />
Price low 282 360 692 290 250<br />
Market value, DKK mill. 3,056 5,440 6,320 3,192 2,864<br />
No. of shares at year-end, mill. 8.0 8.0 8.0 8.0 8.0<br />
Ownership structure, end 2009<br />
% of share capital<br />
The Lauritzen Foundation (Vesterhavet Holding A/S) 56.0<br />
Clipper Group 16.9<br />
Institutional and financial investors 6.2<br />
Other registered shareholders 2.8<br />
Own shares 4.2<br />
Non-registered shareholders 13.9<br />
Total 100.0
48 Risk Factors<br />
<strong>DFDS</strong> annual report 2009<br />
Risk Factors<br />
General and specific operational risks<br />
Risk management is an integral part of managing <strong>DFDS</strong>, and risks and<br />
opportunities are evaluated continuously.<br />
Macro-economic and market risks<br />
The market for maritime transport of freight and passengers is<br />
affected by the general state of the economy. Negative economic<br />
growth will typically cause overcapacity in the market and increase the<br />
pressure on prices. Partly in order to manage price and volume risks<br />
associated with shifting economic trends, approximately half of the roro<br />
freight fleet consists of chartered ships, which makes it possible to<br />
return tonnage at notice as short as a few months and as long as ten<br />
years. Most of the container ships are chartered, while all passenger<br />
ships are owned by <strong>DFDS</strong>. This means that there is a limited scope to<br />
make short-term changes to passenger-ship capacity.<br />
<strong>DFDS</strong>’ geographic diversification across Northern Europe implies<br />
a low level of dependency on individual activities. Moreover, regional<br />
differences in activity levels help to balance the overall commercial risk.<br />
The market for maritime freight and passenger transport is also affected<br />
by changes to industry-specific conditions. This includes changes<br />
in the market for other forms of transport, such as road, rail and air,<br />
the latter of which mainly impacts upon the passenger sector. In addition,<br />
the market is influenced by changes in local and regional competition,<br />
including the opening of competing routes and the deployment<br />
of additional capacity on existing routes.<br />
A significant proportion of the freight on some routes stems from<br />
a small number of customers. The risk inherent in such customer<br />
relationships is partly limited by entering into long-term partnership<br />
agreements.<br />
Risks associated with business development and investments<br />
Business development and investment risks stem from <strong>DFDS</strong>’ growth<br />
strategy, which includes both organic growth (e.g. the acquisition<br />
of tonnage) and growth through the acquisition of companies and<br />
activities. The most important risks associated with organic growth<br />
are related to capacity enhancement on the existing route network<br />
when deploying new or larger tonnage. Company acquisitions involve<br />
significant risks, which increase in line with the size of the investment<br />
and the complexity of the subsequent integration process.<br />
Risks associated with all forms of business development are managed<br />
by means of in-depth planning and decision-making processes<br />
based on internal policies and investment guidelines.<br />
The tonnage market<br />
<strong>DFDS</strong> mainly charters freight tonnage, which involves risks associated<br />
with price trends and the availability of sufficient tonnage in relation to<br />
the company’s needs. Similar risks are also relevant when chartering<br />
out excess tonnage. In addition, certain risks are associated with price<br />
trends and the time periods involved in ordering newbuildings.<br />
Due to the ongoing process of replacing and renewing the <strong>DFDS</strong><br />
fleet, the sale of tonnage or the annulment of contracts may result in<br />
gains, losses and costs that are not included in annual profit forecasts.<br />
Security and environment risks<br />
<strong>DFDS</strong> uses freight and passenger ships, terminals and other operating<br />
equipment, all of which involve operational risks. These risks are<br />
controlled and minimised partly through compliance with safety<br />
requirements and routines, as well as preventative work, and partly<br />
through insurance against risk.<br />
Environmental and safety measures are based on <strong>DFDS</strong>’ environmental<br />
and safety policies, as well as official regulations and customer demand.<br />
Changes in these requirements can cause costs to rise. The Group is<br />
insured against environmental risks as far as possible, and participates in<br />
preparatory legislative procedures through industry organisations.<br />
Political and legal risks<br />
Political decisions may alter the legal framework for <strong>DFDS</strong>’ activities,<br />
with potentially negative consequences for the business. The most<br />
significant long-term risks are expected to be requirements to reduce<br />
the sulphur content in bunker, the discontinuation of duty-free sales in<br />
Norway, which is not expected before 2010 at the earliest, and design<br />
and safety requirements on newbuildings.<br />
Internal control<br />
The purpose of <strong>DFDS</strong>’ internal control and risk management system,<br />
as used in the preparation of accounts, is to effciently control the risk<br />
of significant misinformation. The Board of Directors approves the<br />
policies for risk management prepared by the Executive Board, and<br />
the Executive Board implements processes to monitor important risks.<br />
The internal control and risk management system is developed and<br />
adjusted on an ongoing basis.<br />
On www.dfds.com/english/aboutdfds/internalcontrols/2009uk a detailed<br />
description of the main elements of the internal control and risk<br />
management system as used in the prerparation of accounts is available.<br />
Oil prices<br />
Bunker costs constitute a special operational risk, as a result of significant<br />
historical fluctuations in the price of oil. The total annual cost of<br />
bunker in 2009 was approximately DKK 800 million, excluding items<br />
regarding hedging transactions, which represented an income of DKK<br />
64 million in 2009. Bunker consumption was 402,000 tons.<br />
In the freight sector, bunker costs are hedged to a great extent by<br />
bunker surcharge clauses clauses in freight contracts. In the passenger<br />
sector, fluctuations in the cost of bunker are reflected in surcharges<br />
and ticket price to the extent that market conditions makes it feasible.<br />
Hedging transactions, primarily oil swaps, are also used to manage risk.<br />
Bunker consumption in 2010 is expected to be approximately<br />
400,000 tons on a level with 2009. Around 80,000 tonnes of the
<strong>DFDS</strong> annual report 2009 Risk Factors 49<br />
consumption is related to passenger shipping, of which about 24 % is<br />
hedged. The majority of the remaining consumption by freight ships is<br />
hedged by commercial bunker surcharge agreements.<br />
All in all, it is estimated that a price change of 1 % compared to the<br />
price level at the end of 2009, which was approximately USD 450 per<br />
ton, will entail a profit impact of approximately DKK 2.4 million.<br />
Financial risks<br />
The most important financial risk factors for <strong>DFDS</strong> are currency and<br />
interest-rate fluctuations, both of which are managed by <strong>DFDS</strong>’ central<br />
finance department, in accordance with the policies adopted by the<br />
Supervisory Board.<br />
BUNKERPRICE 2009/10 (HFSO 3.5%)<br />
USD PER TON<br />
500<br />
400<br />
300<br />
200<br />
100<br />
DKK PER TON<br />
3000<br />
2500<br />
2000<br />
1500<br />
1000<br />
500<br />
Currency risks<br />
Around 80 % of <strong>DFDS</strong>’ revenue is invoiced in foreign currency. The<br />
most important net income currencies are SEK, NOK, EUR and<br />
GBP while USD is the principal net expense currency related to<br />
the purchase of bunker.<br />
<strong>DFDS</strong> actively seeks to reduce currency exposure by matching the<br />
currencies for assets and liabilities, and by taking out futures contracts,<br />
options and swaps. Hedging of cash flows in currency is evaluated and<br />
adjusted on an ongoing basis. At this point in time, no hedging has<br />
been entered into for 2010.<br />
0<br />
JAN FEB MAR APR MAY JUN JUL AUG SEP OCT NOV DEC JAN FEB<br />
2009<br />
2010<br />
DKK<br />
USD<br />
0<br />
Interest-rate risks<br />
<strong>DFDS</strong>’ interest-rate risks stem primarily from interest-bearing debt.<br />
The loan portfolio at the end of 2009 amounted to DKK 4.200 million<br />
and the average loan period was approximately 3.7 years. Around<br />
40 % of the loan portfolio is denominated in foreign currencies, mainly<br />
EUR, SEK and NOK.<br />
The management of interest-rate risks is based on a proportion of<br />
fixed interest loans at a minimum level of approximately 40 %, including<br />
the use of rate swaps. Fixed interest loans accounted for approximately<br />
37 % of the portfolio at the end of 2009, including rate swaps.<br />
A 1 % rise in interest rates compared to the level at the start of<br />
February 2010 would raise interest-rate costs by around DKK 27 million<br />
in 2010.<br />
Liquidity risks<br />
<strong>DFDS</strong> improved its minimum cash pool in 2009 through several initiatives.<br />
An agreement was entered into for the sale and leaseback of<br />
transport equipment for about DKK 60 million. Liquidity was released<br />
through a guarantee agreement and an internal ship sale. The latter<br />
released liquidity of DKK 55 million. In addition, committed money<br />
market lines have been extended to DKK 100 million. Further initiatives<br />
are expected in 2010.<br />
For further information about the management of financial risks,<br />
including credit and liquidity risks, please refer to Note 28 on page 93.
50 Financial review<br />
<strong>DFDS</strong> annual report 2009<br />
Financial<br />
Review<br />
Business structure<br />
<strong>DFDS</strong>’s activities are organised in five business areas, three of which<br />
– Ro-Ro Shipping, Container Shipping and Passenger Shipping – are<br />
responsible for the network of routes. The two other areas – Terminal<br />
Services and Trailer Services – support the network by providing port,<br />
terminal and transport services.<br />
Revenue<br />
Revenue was reduced by 20 % to DKK 6,555 million in 2009. Adjusted<br />
for bunker surcharges, revenue was reduced by 15 %, corresponding to<br />
a decline of DKK 1,112 million.<br />
The recession in 2009 led to lower demand in all business areas.<br />
However, freight activities experienced the largest decrease in revenue.<br />
Passenger Shipping’s revenue fell by 9 %, while the decline in the four<br />
other areas, whose activities are directed primarily at freight, was 14-29 %.<br />
The decline in revenue in all business areas can be attributed to a<br />
combination of lower volumes and prices and the reduction of capacity<br />
on several routes. The closure of Passenger Shipping’s Bergen-Newcastle<br />
route in September 2008 accounted for a significant reduction<br />
in capacity increasing the Group’s negative revenue growth in 2009 by<br />
two percentage points. Currency fluctuations, particularly SEK, NOK<br />
and GBP, also had a negative impact.<br />
The Tramp business area was sold in 2008. This led to a reduction<br />
in revenue of DKK 38 million in 2009, corresponding to a 0.4 percentage<br />
point reduction in Group revenue compared with 2008.<br />
The revenue split between business areas in 2009 was affected by<br />
the transfer of passenger revenue on the Esbjerg-Harwich route from<br />
Ro-Ro Shipping to Passenger Shipping at the start of 2009. Revenue in<br />
this area was DKK 121 million in 2009, which was on a par with 2008.<br />
Revenue per business area<br />
DKK million 2008 2009 %-change<br />
Ro-Ro Shipping 3,799 2,997 -21<br />
Container Shipping 1,636 1,165 -29<br />
Passenger Shipping 1,779 1,620 -9<br />
Terminal Services 647 555 -14<br />
Trailer Services 963 776 -19<br />
Tramp (not continuing) 38 0 -100<br />
Eliminations -667 -558 -17<br />
<strong>DFDS</strong> Group total 8,194 6,555 -20<br />
EBITDA per business area<br />
DKK million 2008 2009 %-change<br />
Ro-Ro Shipping 784 519 -34<br />
Container Shipping 81 5 -94<br />
Passenger Shipping 194 314 62<br />
Terminal Services -31 -14 n.a.<br />
Trailer Services 31 36 14<br />
Tramp (not continuing) 8 0 -100<br />
Non-allocated items -56 -74 n.a.<br />
<strong>DFDS</strong> Group total 1,011 786 -22<br />
Costs and EBITDA<br />
Operating profit before depreciation (EBITDA) was reduced by 22 %<br />
to DKK 786 million, due primarily to the effects of the lower revenue<br />
of DKK 1.1 billion, adjusted for bunker surcharges. The EBITDA margin<br />
was reduced by 0.3% to 12.0 % from 12.3 % in 2008.<br />
EBITDA includes several one-off items that represent a total cost<br />
of DKK 62 million. The items relate, among other things, to transaction<br />
costs for the acquisition of Norfolkline; costs for the cancellation of<br />
charter contracts for sideport and container ships; a loss incurred on<br />
one major debtor related to chartering out of ro-ro ships; and several<br />
smaller items. Adjusted for these items, EBITDA was DKK 848 million<br />
in 2009, a decrease of 16 %.<br />
In response to changing market conditions, a series of adjustments<br />
were made to operations in 2009, which contributed to reduce costs<br />
and staff numbers. The latter was reduced by 9 % to 3,924, from 4,301<br />
in 2008, and total staff costs were 11 % lower.
<strong>DFDS</strong> annual report 2009 Financial review 51<br />
<strong>DFDS</strong> Group 2008 2009<br />
DKK miLLION Q1 Q2 Q3 Q4 Full year Q1 Q2 Q3 Q4 Full year<br />
Revenue 1,944 2,209 2,259 1,782 8,194 1,431 1,648 1,819 1,657 6,555<br />
Operating profit before depreciation<br />
(EBITDA) 139 293 393 186 1,011 78 233 317 158 786<br />
Associates 1 1 1 1 4 0 1 1 -1 1<br />
Profit/loss on disposal of tangible assets 0 33 3 9 45 3 8 1 6 18<br />
Depreciation -142 -144 -142 -165 -593 -135 -159 -144 -193 -631<br />
Operating profit (EBIT) -2 183 255 31 467 -54 83 175 -30 174<br />
Operating profit margin (EBIT), % -0.1 8.3 11.3 1.7 5.7 -3.8 5.0 9.6 -1.8 2.7<br />
Profit before tax -58 127 193 -41 221 -105 32 149 -56 20<br />
Invested capital, average 7,882 7,770 7,692 7,445 7,663 7,326 7,705 8,055 8,095 7,762<br />
Return on invested capital (ROIC) p.a., % -0.1 8.3 12.8 2.5 5.9 -2.7 4.0 8.4 -1.4 2.1<br />
At business-area level, most of the decline in EBITDA was attributable<br />
to Ro-Ro Shipping and Container Shipping, with results down<br />
DKK 265 million (-34 %) and DKK 76 million (-94 %) respectively. The<br />
significant deterioration in Ro-Ro Shipping’s financial performance in<br />
2009 is attributed to a combination of lower volumes and rates in<br />
more or less every part of the route network on the one hand, and to<br />
a high proportion of fixed costs on the other. The latter implies a high<br />
profit sensitivity to lower revenue. The downturn in Container Shipping<br />
was also due to lower volumes and rates, although more particularly<br />
from the paper industry and the operation of small bulk carriers. The<br />
market for the latter activity was significantly impacted by the recession<br />
in 2009, and substantial losses were incurred as a result. Also included<br />
in Container Shipping is a one-off cost of DKK 27 million from the<br />
cancellation of charter contracts, cf. above.<br />
Passenger Shipping’s EBITDA improved by 62 % or DKK 120 million<br />
to DKK 314 million in 2009. This improvement partly reflects the fullyear<br />
effect of the restructuring work of Project Lighthouse implemented<br />
in 2008, improved operations on the Amsterdam-Newcastle route,<br />
and lower bunker costs.<br />
Terminal Services’ EBITDA improved by DKK 17 million to DKK -14<br />
million in 2009. Adjusted for a provision for business rates in England<br />
of DKK 25 million in 2008, the result was down by DKK 8 million.<br />
Operations at the largest terminal, Immingham, were rationalised in<br />
2009, but the improvements were offset by lower activity. The results<br />
for the other terminals in 2009 were also weakened by lower activity.<br />
Trailer Services’ EBITDA improved by DKK 5 million to DKK 36<br />
million, which can be attributed to the progress of the Belgian subsidiary<br />
in particular, but also to subsidiaries in the Netherlands, Germany and<br />
Great Britain. However, these results were offset by a downturn in the<br />
Swedish subsidiary due to lower activity and increased costs due to<br />
traffic imbalances.<br />
The cost of non-allocated items rose by DKK 19 million to DKK 74<br />
million. The increase was mainly due to transaction costs related to the<br />
expected acquisition of Norfolkline.<br />
Profit/loss on sale of assets<br />
Profit and loss from the sale of tangible assets was DKK 18 million, of<br />
which DKK 9 million was related to the early return of three financially<br />
leased sideport ships, and DKK 9 million to profits from the sale of<br />
cargo carrying equipment.<br />
<strong>DFDS</strong> GROUP – EBITDA<br />
PER QUARTER<br />
(DKK MILLION)<br />
REVENUE AND<br />
INVESTED CAPITAL<br />
(DKK BILLION)<br />
TIMES<br />
FREE CASH FLOW<br />
(DKK MILLION)<br />
CAPITAL STRUCTURE<br />
(%-SHARE OF CAPITAL)<br />
500<br />
12<br />
1,2<br />
1.200<br />
100<br />
400<br />
300<br />
10<br />
8<br />
1,0<br />
0,8<br />
1.000<br />
800<br />
600<br />
400<br />
75<br />
6<br />
0,6<br />
200<br />
50<br />
200<br />
100<br />
4<br />
2<br />
0,4<br />
0,2<br />
0<br />
-200<br />
-400<br />
-600<br />
25<br />
0<br />
0<br />
0<br />
-800<br />
0<br />
1. KVT.<br />
2. KVT.<br />
3. KVT.<br />
4. KVT.<br />
2005<br />
2006<br />
2007<br />
2008<br />
2009<br />
2005<br />
2006<br />
2007<br />
2008<br />
2009<br />
2005<br />
2006<br />
2007<br />
2008<br />
2009<br />
2007 2008 2009<br />
REVENUE<br />
AVERAGE INVESTED<br />
CAPITAL<br />
TURNOVER RATE,<br />
INVESTED CAPITAL<br />
EQUITY AND<br />
DEFERRED TAX<br />
NET INTEREST-<br />
BEARING DEBT
52 Financial review<br />
<strong>DFDS</strong> annual report 2009<br />
Depreciation, write-downs and EBIT<br />
Total depreciation and write-downs amounted to DKK 631 million,<br />
of which DKK 61 million consisted of write-downs. The latter consists<br />
primarily of a write-down of DKK 53 million on the passenger ship<br />
Queen of Scandinavia, and a write-down of DKK 6 million on a ro-ro<br />
ship that was sold for scrapping early in 2010.<br />
Depreciation of ships and other long-term assets amounted to<br />
DKK 572 million, which was on a par with 2008. The value adjustment<br />
of negative goodwill resulted in an income of DKK 1 million in 2009<br />
compared to an income of DKK 20 million in 2008.<br />
Operating profit (EBIT) was then DKK 174 million, down 63 %<br />
or DKK 293 million compared to 2008.<br />
Financing<br />
Net financing amounted to a cost of DKK 154 million, a reduction of<br />
DKK 92 million compared to 2008. Net-interest costs, excluding financial<br />
leasing, were reduced by 12 % or DKK 22 million to DKK 159 million.<br />
This was due to a decrease in the average net borrowing rate, which<br />
more than offset an increase in average net interest-bearing debt of 7 %.<br />
In 2009, net exchange-rate adjustments, excluding financial leasing,<br />
constituted an income of DKK 15 million, in contrast to a loss of DKK<br />
19 million in 2008, and thus a profit improvement of DKK 34 million<br />
compared to 2008. The adjustments were primarily related to SEK,<br />
NOK and USD.<br />
In addition, the cost of finance in 2009 was reduced by a lower<br />
cost of DKK 17 million for financial leasing from price adjustments and<br />
lower interest plus the return of three ships at the end of the year.<br />
Moreover, there was a positive deviation of DKK 22 million from a<br />
write-down in 2008 on a receivable from <strong>DFDS</strong> Suardiaz Line. Costs<br />
were incurred from changes in loan conditions.<br />
Tax and annual profit<br />
Pre-tax profit in 2009 was DKK 20 million, a decrease of DKK 201<br />
million compared to 2008.<br />
The shipping activities of the <strong>DFDS</strong> Group are covered by tonnage<br />
tax schemes in Denmark, Norway, the Netherlands and Lithuania. Tax<br />
on the result for the year constituted an income of DKK 69 million of<br />
which DKK 70 million concerns an income from a reversal of the Norwegian<br />
transition rules adopted for a new tonnage tax scheme in 2007.<br />
A new set of transition rules have yet to be decided upon. Deferred<br />
taxes was an income of DKK 30 million primarily from capitalised and<br />
deficits carried forward. Tax on the result for the year was a cost of<br />
DKK 21 million.<br />
Net profit was then DKK 89 million compared to DKK 253 million<br />
in 2008.<br />
Investments<br />
Investments in 2009 amounted to DKK 1,304 million, of which DKK<br />
1,191 million consists of investment in ships. The most significant investments<br />
were DKK 373 million related to two newer ro-ro ships; DKK<br />
463 million related to a newly-built ro-pax ship; and DKK 272 million<br />
for the extension of three ro-ro ships. The remaining DKK 83 million<br />
relates to docking of ships.<br />
Of the remaining investments of DKK 113 million, cargo carrying<br />
equipment accounted for DKK 52 million, while investments in IT<br />
systems and development amounted to DKK 22 million. Acquisition of<br />
the remaining 20 % stake in the Halléns NV represented an investment<br />
of DKK 38 million.<br />
Assets and invested capital<br />
Total assets increased by 8 % to DKK 9.3 billion., a rise of DKK 688<br />
million, derived mainly from the abovementioned investments in ships<br />
and the reduction of DKK 147 million in cash funds to DKK 155 million.<br />
Despite investments of DKK 1.3 billion in 2009, average invested<br />
capital rose by only 1.2 % to DKK 7,762 million in 2009, as a result of<br />
the gradual phasing in of investments over the year. Invested capital rose<br />
year-on-year by 11 % to DKK 7,979 million. The return on invested capital<br />
was 2.1 %, a decrease of 3.8 percentage points compared to 2008.<br />
Financing and capital structure<br />
Interest-bearing debt rose by 16 % to DKK 4,200 million at the end of<br />
2009, corresponding to a rise of DKK 564 million. Net interest-bearing<br />
debt increased by 19 % to DKK 4,067 million at the end of 2009.<br />
Calculated as an average, the increase was 7 % in 2009. At the end<br />
of 2009, the ratio of net interest-bearing debt to EBITDA was 5.2.<br />
Cash flow<br />
Gross cash flow from operations declined by 15 % to DKK 861 million.<br />
Cash flow was positively affected by a change in working capital of DKK<br />
87 million, including adjustments. Free cash flow from operations, calculated<br />
before interest and after investments, was negative DKK 468 million in<br />
2009. The negative free cash flow and payment of interest was, amongst<br />
other things, financed by loans of DKK 528 million and a DKK 147 million<br />
reduction in cash funds. Short-term debt amounted to DKK 333 million<br />
of the loan financing, and helped to reduce the average borrowing rate<br />
as a result of declining short-term interest rate throughout the year.<br />
Valuation of ships<br />
An annual impairment test is conducted on the Group’s ships, based on<br />
expected net cash flow and external brokers’ evaluations. The tests for<br />
2009 did not lead to any write-downs apart from the passenger ship<br />
Queen of Scandinavia and the ro-ro ship Tor Anglia. The impairment test<br />
is described in greater detail in note 39.<br />
Queen of Scandinavia, which was laid up for most of the year, was written<br />
down by DKK 53 million in 2009 on the basis of a separate evaluation. Tor<br />
Anglia was written down by DKK 6 million in 2009 on a basis of a seperate<br />
evaluation, because of the ship being transferred to ‘asset held for sale’.<br />
Overall, the demand for ro-ro and ro-pax ships fell in 2009,<br />
although charter rates for newer and bigger ships remained relatively<br />
stable. The market value of the <strong>DFDS</strong> fleet at the end of 2009, based<br />
partly on brokers’ evaluations, was slightly higher than the accounting<br />
value, which was DKK 6.9 billion.<br />
Equity<br />
<strong>DFDS</strong>’ share of the equity increased by 7 % or DKK 227 million to<br />
DKK 3,641 million at the end of 2009. As well as carrying forward<br />
<strong>DFDS</strong>’ share of the annual net profit of DKK 86 million, equity was<br />
positively affected by currency adjustments and value adjustments<br />
on hedging transactions. Minority interests were reduced to DKK 47<br />
million from DKK 71 million in 2008, primarily as a result of the<br />
acquisition of the remaining shares in Halléns NV. Total equity<br />
therefore amounted to DKK 3,688 million at the end of 2009.<br />
The equity ratio at the end of the year was 40 %, the same share<br />
as in 2008.<br />
The parent company’s financial performance<br />
The annual profit for the parent company, <strong>DFDS</strong> A/S, was DKK 32<br />
million. Total assets at the end of the year amounted to DKK 8,029<br />
million and the equity was DKK 3,465 million.
<strong>DFDS</strong> annual report 2009 Financial review 53
54 HEADER<br />
<strong>DFDS</strong> annual report 2009<br />
56<br />
57<br />
58<br />
60<br />
62<br />
63<br />
69<br />
71<br />
71<br />
72<br />
72<br />
73<br />
73<br />
74<br />
75<br />
75<br />
78<br />
81<br />
82<br />
83<br />
84<br />
84<br />
84<br />
84<br />
86<br />
87<br />
89<br />
89<br />
90<br />
90<br />
91<br />
91<br />
93<br />
101<br />
101<br />
101<br />
101<br />
102<br />
102<br />
102<br />
103<br />
103<br />
104<br />
105<br />
107<br />
107<br />
108<br />
109<br />
Income statement<br />
Comprehensive income<br />
Balance sheet<br />
Statement of changes in equity<br />
Cash flow statement<br />
Notes – Income statement<br />
1 Accounting policies<br />
2 Segment information<br />
3 Revenue<br />
4 Cost of sales<br />
5 Staff costs<br />
6 Other costs of sales and administration<br />
7 Profit on disposal of tangible assets<br />
8 Finance, net<br />
9 Tax<br />
10 Earnings per share<br />
Notes – Balance sheet<br />
11 Non-current intangible assets<br />
12 Non-current tangible assets<br />
13 Investments in group enterprises<br />
14 Investments in associates<br />
15 Receivables<br />
16 Securities<br />
17 Inventories<br />
18 Holding of treasury shares<br />
19 Deferred tax<br />
20 Share options<br />
21 Pension and jubilee liabilities<br />
22 Other provisions<br />
23 Interest-bearing liabilities<br />
24 Other debt<br />
25 Deferred income<br />
26 Corporation tax<br />
27 Information on financial instruments<br />
28 Financial risks and derivative financial<br />
instruments applied<br />
Notes – Cash flow statement<br />
29 Non-liquid operating items<br />
30 Change in working capital<br />
31 Investments in non-current fixed assets, net<br />
32 Change in other loans<br />
33 Acquisition of companies and activities<br />
34 Acquisition of minority interests<br />
Notes – Supplementary information<br />
35 Assets and liabilities held for sale<br />
36 Guarantees and contingent liabilities<br />
37 Contractual commitments<br />
38 Related parties<br />
39 Impairment tests<br />
40 Significant accounting estimates<br />
and judgements<br />
41 Events after the balance sheet date<br />
42 Group entities<br />
Statements
<strong>DFDS</strong> annual report 2009 HEADER 55<br />
<strong>DFDS</strong><br />
Financial<br />
Statements<br />
2009
56<br />
financial statement<br />
<strong>DFDS</strong> annual report 2009<br />
Income statement<br />
Parent Company<br />
DKK ‘000<br />
Consolidated<br />
DKK ‘000<br />
2007 2008 2009 NOTE Income statement 2007 2008 2009<br />
5,214,122 5,282,908 4,469,183 2,3 Revenue 8,310,249 8,193,586 6,555,483<br />
Costs<br />
-2,642,137 -2,755,536 -2,123,027 4 Operating costs -4,435,445 -4,586,284 -3,391,541<br />
-681,161 -801,254 -940,604 Charter hire -593,167 -690,289 -661,514<br />
-674,790 -642,364 -578,254 5 Staff costs -1,529,088 -1,481,393 -1,325,628<br />
-492,496 -473,855 -442,401 6 Other costs of operation, sales and administration -441,273 -424,150 -390,424<br />
-4,490,584 -4,673,009 -4,084,286 Total costs -6,998,973 -7,182,116 -5,769,107<br />
723,538 609,899 384,897 Operating profit before depreciation (EBITDA) 1,311,276 1,011,470 786,376<br />
- - - 14 Share of profit/loss of associates 3,264 4,478 1,412<br />
35,371 497 -14,838 7 Profit on disposal of tangible assets 36,844 45,370 17,617<br />
11,12 Depreciation and impairment<br />
-274,212 -271,411 -262,894 Depreciation Ships -451,853 -436,954 -448,131<br />
-42,757 -45,366 -50,979 Depreciation other non-current fixed assets -143,942 -134,758 -124,087<br />
0 -4,413 -59,161 35 Impairment losses for ships and other non-current assets 0 -42,439 -60,650<br />
0 0 0 Value adjustment of goodwill/negative goodwill 1,973 19,947 1,460<br />
-316,969 -321,190 -373,034 Total depreciation and impairment -593,822 -594,204 -631,408<br />
441,940 289,206 -2,975 Operating profit (EBIT) 757,562 467,114 173,997<br />
74,702 88,779 200,099 8 Financial income 26,807 31,437 34,220<br />
-217,544 -387,539 -161,948 8 Financial expenses -258,575 -277,619 -188,512<br />
299,098 -9,554 35,176 Profit before tax 525,794 220,932 19,705<br />
0 -10,481 -2,824 9 Tax on profit -114,097 32,145 69,123<br />
299,098 -20,035 32,352 Profit for the year 411,697 253,077 88,828<br />
Profit for the year is attributed to<br />
299,098 -20,035 32,352 Equity holders of <strong>DFDS</strong> A/S 400,393 246,559 85,728<br />
- - - Minority interest 11,304 6,518 3,100<br />
299,098 -20,035 32,352 411,697 253,077 88,828<br />
10 Earnings per share<br />
Basic earnings per share (EPS) of DKK 100 52.39 32.12 11.19<br />
Diluted earnings per share (EPS-D) of DKK 100 52.01 32.08 11.19<br />
Proposed profit appropriation<br />
120,000 0 0 Proposed dividends, DKK 0.00 per share<br />
(2008: DKK 0.00 per share, 2007: DKK 15.00 per share)<br />
179,098 -20,035 32,352 Retained earnings<br />
299,098 -20,035 32,352
<strong>DFDS</strong> annual report 2009 financial statement 57<br />
Comprehensive income<br />
Parent Company<br />
DKK ‘000<br />
Consolidated<br />
DKK ‘000<br />
2007 2008 2009 NOTE Comprehensive income 2007 2008 2009<br />
299,098 -20,035 32,352 Profit for the year according to the income statement 411,697 253,077 88,828<br />
Other comprehensive income<br />
-5,798 -38,155 59,481 Value adjustment of hedging instruments -3,016 -84,106 73,373<br />
-2,552 -6,286 -2,077 Value adjustment of hedging instruments transferred to revenue -2,649 1,741 5,690<br />
54,376 6,646 -63,773 Value adjustment of hedging instruments transferred to operating expenses 54,376 6,647 -63,773<br />
14,145 -7,621 19,872 Value adjustment of hedging instruments transferred to financial expenses 15,453 -57 25,129<br />
0 0 0 Income tax on other comprehensive income * 24 0 15<br />
-3,703 -9,530 3,425 Currency translation, foreign companies -20,070 -172,425 94,259<br />
-716 -8,456 5,554 Revaluation of securities -716 -8,456 5,554<br />
55,752 -63,402 22,482 Other comprehensive income after tax 43,402 -256,656 140,247<br />
354,850 -83,437 54,834 Comprehensive income for the year 455,099 -3,579 229,075<br />
Comprehensive income for the year is attributed to<br />
354,850 -83,437 54,834 Equity holders of <strong>DFDS</strong> A/S 443,568 -9,313 225,657<br />
- - - Minority interests 11,531 5,734 3,418<br />
354,850 -83,437 54,834 455,099 -3,579 229,075<br />
* As the majority of the Group companies are taxed under tonnage tax schemes, there are only tax on a very limited number of items recognised<br />
in other comprehensive income.
58 financial statement<br />
<strong>DFDS</strong> annual report 2009<br />
Balance sheet – assets<br />
Parent Company<br />
DKK ‘000<br />
Consolidated<br />
DKK ‘000<br />
2007 2008 2009 NOTE Balance sheet at 31 December 2007 2008 2009<br />
272,687 265,022 268,008 Goodwill 327,397 318,855 343,897<br />
26,264 11,178 3,719 Other non-current intangible assets 111,448 34,532 15,223<br />
36,084 57,859 59,435 Software 36,084 57,859 59,435<br />
9,575 3,975 5,954 Development projects in progress 9,575 3,975 5,954<br />
344,610 338,034 337,116 11 Total non-current intangible assets 484,504 415,221 424,509<br />
10,221 12,621 11,582 Buildings 76,520 76,788 75,321<br />
28,169 26,198 25,213 Terminals 348,138 282,956 278,468<br />
3,845,730 3,472,705 3,268,993 Ships 6,404,565 5,663,515 6,863,951<br />
69,792 88,829 78,824 Equipment, etc. 299,438 293,618 298,821<br />
24,170 232,538 7,071 Work in progress and prepayments 27,399 236,945 9,268<br />
3,978,082 3,832,891 3,391,683 12 Total non-current tangible assets 7,156,060 6,553,822 7,525,829<br />
1,646,439 1,599,673 1,752,281 13 Investments in group enterprises - - -<br />
7,333 7,333 223 14 Investments in associates 11,391 12,167 4,783<br />
556,513 507,522 1,282,553 15 Receivables 3,029 27,644 24,826<br />
24,488 16,157 28,835 16 Securities 25,808 17,453 30,094<br />
0 0 0 19 Deferred tax assets 75,174 72,996 102,642<br />
2,234,773 2,130,685 3,063,892 Total other non-current assets 115,402 130,260 162,345<br />
6,557,465 6,301,610 6,792,691 Total non-current assets 7,755,966 7,099,303 8,112,683<br />
79,581 67,089 64,253 17 Inventories 96,188 79,666 76,780<br />
1,062,788 948,302 1,083,795 15 Receivables 1,023,698 846,989 820,565<br />
27,533 45,650 79,908 Prepayments 98,146 97,924 122,348<br />
140,952 87,409 8,529 Cash at bank and in hand 494,279 301,569 154,592<br />
1,310,854 1,148,450 1,236,485 1,712,311 1,326,148 1,174,285<br />
0 184,971 0 12,35 Assets held for sale 141,796 184,971 10,984<br />
1,310,854 1,333,421 1,236,485 Total current assets 1,854,107 1,511,119 1,185,269<br />
7,868,319 7,635,031 8,029,176 Total assets 9,610,073 8,610,422 9,297,952
<strong>DFDS</strong> annual report 2009 financial statement 59<br />
Balance sheet – equity and liabilities<br />
Parent Company<br />
DKK ‘000<br />
Consolidated<br />
DKK ‘000<br />
2007 2008 2009 NOTE Balance sheet at 31 December 2007 2008 2009<br />
800,000 800,000 800,000 18 Share capital 800,000 800,000 800,000<br />
-50,338 -103,163 -84,751 Reserves -53,616 -308,440 -169,145<br />
2,740,483 2,711,335 2,749,357 Retained earnings 2,676,385 2,922,382 3,009,839<br />
114,917 0 0 Proposed dividends 114,917 0 0<br />
3,605,062 3,408,172 3,464,606 Total equity attributable to equity holders of <strong>DFDS</strong> A/S 3,537,686 3,413,942 3,640,694<br />
- - - Minority interests 115,660 70,550 47,088<br />
3,605,062 3,408,172 3,464,606 Total equity 3,653,346 3,484,492 3,687,782<br />
2,755,749 2,025,798 2,618,156 23 Interest bearing liabilities 3,644,775 2,682,131 3,073,721<br />
0 0 0 19 Deferred tax 222,428 153,578 162,040<br />
14,669 15,051 13,433 21 Pension and jubilee liabilities 226,723 170,240 178,895<br />
0 0 0 22 Other provisions 1,125 0 0<br />
2,770,418 2,040,849 2,631,589 Total non-current liabilities 4,095,051 3,005,949 3,414,656<br />
959,951 1,539,693 1,436,332 23 Interest bearing liabilities 707,650 954,040 1,126,438<br />
160,947 88,917 85,311 Trade payables 411,484 308,317 315,013<br />
2,610 0 0 22 Other provisions 25,168 9,720 6,213<br />
0 0 0 26 Corporation tax 22,516 23,773 26,384<br />
339,894 447,821 382,786 24 Other payables 604,297 668,591 647,982<br />
29,437 24,579 28,552 25 Deferred income 83,171 70,540 73,484<br />
1,492,839 2,101,010 1,932,981 1,854,286 2,034,981 2,195,514<br />
0 85,000 0 35 Liabilities related to assets held for sale 7,390 85,000 0<br />
1,492,839 2,186,010 1,932,981 Total current liabilities 1,861,676 2,119,981 2,195,514<br />
4,263,257 4,226,859 4,564,570 Total liabilities 5,956,727 5,125,930 5,610,170<br />
7,868,319 7,635,031 8,029,176 Total equity and liabilities 9,610,073 8,610,422 9,297,952<br />
Assets pledged as securities, etc., see Note 12 and 23<br />
Share options, see Note 20<br />
Information on financial instruments, see Note 27<br />
Financial and operational risks, see Note 28<br />
Guarantees and contingent liabilities, see Note 36<br />
Contractual commitments, see Note 37<br />
Related parties, see Note 38<br />
Impairment tests, see Note 39<br />
Critical accounting estimates and judgements, see Note 40<br />
Events after the balance sheet date, see Note 41<br />
Group entities, see Note 42
60<br />
financial statement<br />
<strong>DFDS</strong> annual report 2009<br />
Statement of changes in equity – Consolidated<br />
RESERVES<br />
DKK 1.000<br />
Share<br />
capital<br />
trans-<br />
LATION<br />
reserve<br />
REVA-<br />
LUATION OF<br />
HEDGING SECURITIES<br />
TREASURY<br />
SHARES<br />
RETAINED<br />
EARNINGS<br />
PROPOSED<br />
DIVIDENDS<br />
TOTAL EQUITY<br />
ATTRIBUTABLE<br />
TO EQUITY<br />
HOLDERS OF<br />
<strong>DFDS</strong> A/S<br />
MINORITY<br />
INTERESTS<br />
TOTAL<br />
Equity at 1 January 2007 800,000 16,066 -91,337 12,502 -39,112 2,372,012 83,698 3,153,829 111,422 3,265,251<br />
Changes in equity 2007<br />
Comprehensive income -20,162 64,053 -716 280,393 120,000 443,568 11,531 455,099<br />
Distributed dividends -84,055 -84,055 -954 -85,009<br />
Adjustments of distributed<br />
-357 357 0 0<br />
dividends 2006<br />
Dividends, treasury shares 5,083 -5,083 0 0<br />
Disposal of minority interests 0 -6,338 -6,338<br />
Share-based payment 10,525 10,525 10,525<br />
Sale of treasury shares related<br />
to exercise of share options 5,223 8,390 13,613 13,613<br />
Exercise of share options 1,031 1,031 1,031<br />
Other adjustments -825 -825 -1 -826<br />
Changes in equity 2007 0 -20,162 64,053 -716 5,223 304,240 31,219 383,857 4,238 388,095<br />
Equity at 31 December 2007 800,000 -4,096 -27,284 11,786 -33,889 2,676,252 114,917 3,537,686 115,660 3,653,346<br />
Equity at 1 January 2008 800,000 -4,096 -27,284 11,786 -33,889 2,676,252 114,917 3,537,686 115,660 3,653,346<br />
Changes in equity 2008<br />
Comprehensive income -171,820 -75,596 -8,456 246,559 -9,313 5,734 -3,579<br />
Distributed dividends -115,217 -115,217 0 -115,217<br />
Adjustments of distributed<br />
-300 300 0 0<br />
dividends 2007<br />
Disposal of minority interests 0 -50,845 -50,845<br />
Share-based payment 3,588 3,588 3,588<br />
Sale of treasury shares related<br />
to exercise of share options 3,000 5,310 8,310 8,310<br />
Acquisition of treasury shares -3,086 -7,048 -10,134 -10,134<br />
Other adjustments -978 -978 1 -977<br />
Changes in equity 2008 0 -171,820 -75,596 -8,456 -86 247,131 -114,917 -123,744 -45,110 -168,854<br />
Equity at 31 December 2008 800,000 -175,916 -102,880 3,330 -33,975 2,923,383 0 3,413,942 70,550 3,484,492<br />
Equity at 1 January 2009 800,000 -175,916 -102,880 3,330 -33,975 2,923,383 0 3,413,942 70,550 3,484,492<br />
Changes in equity 2009<br />
Comprehensive income 93,947 40,439 5,554 85,717 225,657 3,418 229,075<br />
Distributed dividends 0 -1,155 -1,155<br />
Disposal of minority interests 0 -25,726 -25,726<br />
Share-based payment 807 807 807<br />
Sale of treasury shares related<br />
300 492 792 792<br />
to exercise of share options<br />
Other adjustments 56 -560 -504 1 -503<br />
Changes in equity 2009 0 93,947 40,439 5,610 300 86,456 0 226,752 -23,462 203,290<br />
Equity at 31 December 2009 800,000 -81,969 -62,441 8,940 -33,675 3,009,839 0 3,640,694 47,088 3,687,782
<strong>DFDS</strong> annual report 2009 financial statement 61<br />
Statement of changes in equity – Parent Company<br />
RESERVES<br />
DKK 1.000<br />
Share<br />
capital<br />
HEDGING<br />
REVALUATION<br />
OF SECURITIES<br />
TREASURY<br />
SHARES<br />
RETAINED<br />
EARNINGS<br />
PROPOSED<br />
DIVIDENDS<br />
TOTAL<br />
Equity at 1 January 2007 800,000 -88,278 12,558 -39,112 2,540,232 83,698 3,309,098<br />
Changes in equity 2007<br />
Comprehensive income 0 60,176 -716 0 175,390 120,000 354,850<br />
Distributed dividends -84,055 -84,055<br />
Adjustments of distributed dividends 2006 -357 357 0<br />
Dividends treasury shares 5,083 -5,083 0<br />
Share-based payment 10,525 10,525<br />
Sale of treasury shares related to exercise of share options 5,223 8,390 13,613<br />
Exercise of share options 1,031 1,031<br />
Changes in equity 2007 0 60,176 -716 5,223 200,062 31,219 295,964<br />
Equity at 31 December 2007 800,000 -28,102 11,842 -33,889 2,740,294 114,917 3,605,062<br />
Changes in equity 2008<br />
Comprehensive income 0 -45,417 -8,456 0 -29,564 0 -83,437<br />
Distributed dividends -115,217 -115,217<br />
Adjustments of distributed dividends 2007 -300 300 0<br />
Share-based payment 3,588 3,588<br />
Acquisition of treasury shares -3,086 -7,048 -10,134<br />
Sale of treasury shares related to exercise of share options 3,000 5,310 8,310<br />
Egenkapitalbevægelser i 2008 0 -45,417 -8,456 -86 -28,014 -114,917 -196,890<br />
Egenkapital pr, 31.12 2008 800,000 -73,519 3,386 -33,975 2,712,280 0 3,408,172<br />
Changes in equity 2009<br />
Comprehensive income 0 13,503 5,554 0 35,777 0 54,834<br />
Share-based payment 807 807<br />
Sale of treasury shares related to exercise of share options 300 492 792<br />
Other adjustments 1 1<br />
Changes in equity 2009 0 13,503 5,554 300 37,077 0 56,434<br />
Equity at 31 December 2009 800,000 -60,016 8,940 -33,675 2,749,357 0 3,464,606<br />
The Company’s share capital, which is not divided into different classes of shares, is divided into 8,000,000 shares of DKK 100 each.<br />
The share capital has been unchanged the last 5 years.
62<br />
financial statement<br />
<strong>DFDS</strong> annual report 2009<br />
Cash flow statement<br />
Parent Company<br />
DKK ‘000<br />
Consolidated<br />
DKK ‘000<br />
2007 2008 2009 NOTE Cash flow statement 2007 2008 2009<br />
723,538 609,899 384,897 Operating profit before depreciation (EBITDA) 1,311,276 1,011,470 786,376<br />
16,408 -1,867 76 29 Adjustments for non-liquid operating items, etc. 30,658 3,566 8,255<br />
61,437 -22,270 60,195 30 Change in working capital -47,699 12,865 86,749<br />
-1,519 -3,444 -1,289 Payment of pension liabilities and other provisions -10,409 -20,921 -20,487<br />
799,864 582,318 443,879 Cash flow from operating activities, gross 1,283,826 1,006,980 860,893<br />
96,329 102,539 125,003 Interest income 50,919 83,889 70,077<br />
-252,987 -251,071 -208,269 Interest expenses -274,350 -292,574 -262,138<br />
0 0 0 Taxes paid -19,575 -23,726 -25,056<br />
643,206 433,786 360,613 Cash flow from operating activities, net 1,040,820 774,569 643,776<br />
-119,909 -298,936 -144,671 Purchase of ships -146,882 -362,559 -1,190,728<br />
101,504 0 239,411 Disposal of ships and ship contracts 102,912 160,987 0<br />
-2,032 -3,745 -1,521 31 Buildings and terminals -14,955 -10,867 -1,411<br />
-18,486 -35,327 -10,380 31 Equipment, etc. -44,377 -62,225 -51,851<br />
-14,552 -30,747 -22,252 Purchase of non-current intangible assets -14,451 -32,088 -22,253<br />
-22,587 11,834 0 33 Acquisition of companies and activities -22,587 -274 0<br />
-23,093 -11,186 0 Capital increase in subsidiaries - - -<br />
-1,626 -20,770 -112,608 34 Acquisition of minority interests -12,643 -39,796 -39,429<br />
2,500 4,957 10,441 8 Dividends from group enterprises - - -<br />
1,194 1,194 0 8. 14 Dividends from associates 2,503 2,302 1,350<br />
0 0 0 14 Investments in associates -313 0 0<br />
-97,087 -382,726 -41,580 Total cash flow from investing activities -150,793 -344,520 -1,304,322<br />
0 0 1,063,801 Proceeds from loans secured by mortgages in ships 0 0 1,063,801<br />
-388,255 -342,707 -592,016 Payment and redemptions of loans secured by mortgages in ships -543,885 -475,843 -835,285<br />
12,103 2,468 -778,493 Change in other non-current investments 4,658 239 5,220<br />
-70,570 -78,498 -17,053 32 Change in other financial loans, net -79,609 -103,057 -38,404<br />
-7,873 -10,544 -11,662 Payment of financial lease liabilities -39,344 -29,065 -30,530<br />
89,975 431,584 -63,282 Change in operating credits -38,530 124,469 332,733<br />
12,925 8,311 792 Exercise of share options 12,925 8,311 792<br />
-84,055 -115,217 0 Dividends paid to shareholders -85,009 -115,217 -1,155<br />
-435,750 -104,603 -397,913 Total cash flow from financing activities -768,794 -590,163 497,172<br />
110,369 -53,543 -78,880 Cash flow for the year 121,233 -160,114 -163,374<br />
30,583 140,952 87,409 Cash at bank and in hand at the beginning of the year 371,367 494,279 301,569<br />
0 0 0 Foreign exchange adjustments 1,679 -32,596 16,397<br />
140,952 87,409 8,529 Cash at bank and in hand at year-end 494,279 301,569 154,592<br />
The above cannot be derived directly from the income statement and the balance sheet.
<strong>DFDS</strong> annual report 2009 NOTEs 63<br />
NOTES<br />
NOTE 1<br />
Accounting Policies<br />
The 2009 annual report has been prepared in accordance with International<br />
Financial Reporting Standards as adopted by the EU and additional Danish<br />
disclosure requirements for annual reports of listed companies.<br />
Basis for preparation<br />
The annual report is presented in Danish Kroner (DKK) which is the Parent<br />
Company’s functional currency.<br />
The annual report has been prepared on the historical cost basis except<br />
for the following assets and liabilities measured at fair value: derivatives and<br />
financial instruments classified as available-for-sale.<br />
Non-current assets and assets held for disposal classified as held for sale<br />
are measured at the lower of the carrying amount before the changed classification<br />
and the fair value less costs to sell.<br />
The accounting policies as set out below are used consistently for the<br />
financial year as well as for the comparative figures.<br />
New International Financial Reporting Standards and Interpretations<br />
With effect from 1 January 2009, the Group has adopted the following new<br />
International Financial Reporting Standards and Interpretations:<br />
n IAS 1 (revised 2007) Presentation of Financial Statements<br />
n IAS 23 (revised 2007) Borrowing Costs<br />
n IFRS 2 Share-based Payments: Vesting Conditions and Cancellations<br />
n Amendments to IAS 32 and IAS 1: Puttable Financial Instruments and<br />
Obligations Arising on liquidations<br />
n Amendments to IFRS 1 and IAS 27: Cost of an investment in a Subsidiary,<br />
Jointly-Controlled Entity or Associate<br />
n Amendment to IFRS 7: Improving Disclosures about Financial Instruments<br />
n Part of Improvements to IFRSs May 2008 (effective date 1 January 2009)<br />
and<br />
n IFRIC 13, 15 and 16.<br />
The Group applies revised IAS 1 ‘Presentation of Financial Statements’, which<br />
became effective as of 1 January 2009. As a result, the Group presents in<br />
the consolidated statement of changes in equity all owner changes in equity,<br />
whereas all non-owner changes in equity are presented in the consolidated<br />
statement of comprehensive income. Comparative information has been represented<br />
so that it also is in conformity with the revised standard.<br />
The new standards, amendments and interpretations did not affect recognition<br />
and measurement. Additional accounting policies for the consolidated<br />
financial accounts and annual accounts 2009 have not been changed in<br />
comparison to last year.<br />
Other changes<br />
Profit on disposal of equipment, etc. is re-classified in the income statement.<br />
The item is now a part of ‘Profit on disposal of assets’. Previously the item<br />
was a part of ‘Other costs of operation, sales and administration’.<br />
Effect of new accounting regulation applicable for the coming<br />
financial year<br />
The IASB has issued the following new and amended Standards and Interpretations,<br />
which have been adopted by the EU but are not yet mandatory for<br />
the preparation of the <strong>DFDS</strong> Group’s 2009 annual report:<br />
n IFRS 1 (revised) ‘First-time Adoption of International Financial Reporting<br />
Standards’ (1 January 2010)<br />
n Amendments to IFRS 1 ‘First-time Adoption of International Financial<br />
Reporting Standards’ 1 January 2010) *<br />
n Amendment to IFRS 2 ‘Share-based Payment’ (1 January 2010) *<br />
n IFRS 3 (revised) ‘Business Combinations’ (1 July 2009)<br />
n Amendment to IFRS 5 (Part of Improvements to IFRSs 2008) ‘Non-current<br />
Assets Held for Sale and Discontinued Operations’ (1 January 2010)<br />
n IFRS 9 ‘Financial instruments’ (1 January 2013) *<br />
n IAS 24 (revised) ‘Related Party Disclosures’ (1 January 2011) *<br />
n Amendment to IAS 27 ‘Consolidated and Separate Financial Statements’<br />
(1 July 2009)<br />
n Amendment to IAS 28 ‘Investments in Associates’ (1 July 2009)<br />
n Amendment to IAS 31 ‘Interests in Joint Ventures’ (1 July 2009)<br />
n Amendment to IAS 32 ‘Financial Instruments: Presentation’<br />
(1 February 2010)<br />
n Amendment to IAS 39 ‘Financial Instruments: Recognition<br />
and Measurement’ (1 July 2009)<br />
n IFRIC 9 ‘Reassessment of Embedded Derivatives’ (1 July 2009)<br />
n IFRIC 14 ‘IAS 19 – The Limit on a Defined Benefit Asset, Minimum<br />
Funding Requirements and their Interaction’ (1 January 2011) *<br />
n IFRIC 17 ‘Distributions of Non-cash Assets to owners’ (1 July 2009)<br />
n IFRIC 18 ‘Transfers of Assets from Customers’ (1 July 2009)<br />
n IFRIC 19 ‘Extinguishing Financial Liabilities with Equity Instruments’<br />
(1 July 2010) *<br />
n Part of Improvements to IFRSs 2009 (include IFRS 2, 5 and 8 also<br />
IAS 1, 7, 17, 36, 38 and 39) *<br />
* = not approved by EU<br />
The <strong>DFDS</strong> Group expects to adopt the Standards and Interpretations when<br />
they become mandatory.<br />
The new standards, amendments and interpretations applicable for the<br />
coming financial year did not affect recognition and measurement.<br />
Critical accounting policies<br />
<strong>DFDS</strong>’ management believes that applied accounting policies for consolidated<br />
financial statement, non-current intangible assets, ships, operational lease versus<br />
financial lease and derivative financial instruments are the most important<br />
for the Group. Below the individual areas are described together with other<br />
accounting policies.<br />
Significant estimates and judgements in connection with the application of<br />
the Group’s accounting policies are mentioned in Note 40.<br />
Description of accounting policies<br />
Consolidated financial statements<br />
The consolidated financial statements include the financial statement of <strong>DFDS</strong><br />
A/S (the Parent Company) and all the companies in which <strong>DFDS</strong> A/S, at the<br />
balance sheet date, directly or indirectly holds more than 50% of the voting<br />
rights or in any other way has a controlling influence (subsidiaries). <strong>DFDS</strong> A/S<br />
and these companies are referred to as the Group.<br />
Companies that are not subsidiaries, but in which the Group holds<br />
between 20% and 50% of the voting rights or in some other way exerts<br />
significant influence on the operational and financial management, are treated<br />
as associates, cf. the Group chart.<br />
The consolidated financial statements are based on the financial statement<br />
of the Parent Company and the subsidiaries and are prepared by combining<br />
items of a uniform nature and eliminating intercompany transactions,<br />
shareholdings, balances and unrealised intercompany profits and losses. The<br />
consolidated financial statements are based on financial statements prepared<br />
by applying the Group’s accounting policies.<br />
Investments in subsidiaries are set off against the proportionate share of<br />
the subsidiaries’ net asset value at the acquisition date.<br />
The Group’s investments in associates are recognised in the consolidated<br />
financial statements at the proportionate share of the associates’ net asset<br />
value. Unrealised intercompany profits and losses from transactions with<br />
associates and jointly controlled entities are eliminated to the extent of the<br />
Group’s interest in the entity.
64 NOTEs<br />
<strong>DFDS</strong> annual report 2009<br />
Minority interests<br />
In the consolidated financial statements, the items of subsidiaries are recognised<br />
in full. The minority interests’ proportionate shares of the subsidiaries’<br />
results and equity are adjusted annually and recognised separately in the<br />
proposed profit appropriation and statement of changes in equity.<br />
Business combinations<br />
Enterprises acquired or formed during the year are recognised in the consolidated<br />
financial statements from the date of acquisition or formation. Enterprises<br />
disposed of are recognised in the consolidated financial statements until<br />
the date of disposal. The comparative figures are not adjusted for acquisitions<br />
or disposals.<br />
Acquisitions of enterprises in which the Parent Company will be able to<br />
exercise control are accounted for using the purchase method. The cost of<br />
an acquisition is measured as the fair value of the assets given and liabilities<br />
incurred or assumed at the date of acquisition, plus costs directly attributable<br />
to the acquisition. In case components of the consideration are linked up to<br />
future events, these components are included in the cost of acquisition to the<br />
extent that the events are probable and the determination of the consideration<br />
is reliable. Identifiable assets, liabilities and contingent liabilities acquired<br />
in a business combination are measured initially at their fair values at the acquisition<br />
date. The excess of the cost of acquisition over the fair value of the<br />
Group’s share of the identifiable net assets acquired is recorded as goodwill.<br />
Negative goodwill (badwill) is recognised as income in the income statement<br />
at the time of the acquisition.<br />
Positive and negative balances from the acquirees might be adjusted until<br />
12 months from the date of the acquisition provided that the initial recognition<br />
was preliminary or incorrect. All other adjustments are recognised in the<br />
income statement.<br />
Goodwill is allocated at the date of acquisition to the lowest cash-generating<br />
unit to which the goodwill within reason is attributable. The allocation of<br />
goodwill to cash-generating units is mentioned in Note 11 and 39.<br />
For business combinations achieved in stages, goodwill and negative goodwill<br />
are measured at each transaction using the above-described method until<br />
control is obtained. Share of profit or loss is recognised using the acquired<br />
ownership at each stage of transaction. For business combinations achieved in<br />
stages after control is obtained, goodwill and negative goodwill are measured<br />
as the difference between the cost of the additional acquisition and the carrying<br />
amount of the acquired net assets.<br />
Gains or losses on subsidiaries and associates disposed of are stated as<br />
the difference between the sales amount or disposal costs and the carrying<br />
amount of net assets at the date of disposal, including the carrying amount of<br />
goodwill, accumulated exchange gains and losses previously recognised in the<br />
equity plus anticipated disposal costs.<br />
Translation of foreign currencies<br />
Functional and presentation currency<br />
Items included in the financial statements of each of the Group’s entities are<br />
measured using the currency of the primary economic environment in which<br />
the entity operates. The consolidated financial statements are presented in<br />
Danish Kroner (DKK), which is the functional and presentation currency of<br />
the Group.<br />
Translation of transactions and balances<br />
Foreign currency transactions are translated into the functional currency using<br />
the exchange rate prevailing at the date of transaction. Foreign exchange<br />
gains and losses resulting from the settlement of such transactions and from<br />
the translation at year-end exchange rates of monetary assets and liabilities<br />
denominated in foreign currencies are recognised in the income statement,<br />
except when deferred in equity as qualifying for cash flow hedges.<br />
Translation differences on non-monetary items are reported as part of<br />
the fair value gain or loss.<br />
Fixed assets acquired in foreign currency are translated at the exchange<br />
rate prevailing at the date of transaction. Gains and losses on hedges relating<br />
to the acquisition of fixed assets are recognised as part of the fixed asset.<br />
Translation of group companies<br />
Financial statements of foreign subsidiaries are translated into Danish Kroner<br />
at the exchange rates at the balance sheet date for assets and liabilities and at<br />
average exchange rates for income statement items.<br />
The above exchange gains and losses (exchange rate adjustments) are<br />
recognised in a separate reserve in the equity. At full or partial realisation<br />
of the net investment the exchange rate adjustments are recognised in the<br />
income statement.<br />
Derivative financial instruments<br />
Derivative financial instruments are recognised in the balance sheet at fair values<br />
on the transaction date. The fair values of derivative financial instruments<br />
are presented as other receivables if positive or other liabilities if negative.<br />
Netting of positive and negative derivative financial instruments is only<br />
performed if the company is entitled to and has the intention to settle more<br />
derivative financial instruments as a net. All fair values are computed on the<br />
basis of current market data and generally accepted valuation methods.<br />
Fair value hedge<br />
Changes in the fair value of derivative financial instruments designated as<br />
and qualifying for recognition as a fair value hedge of recognised assets and<br />
liabilities are recognised in the income statement together with changes in<br />
the value of the hedged asset or liability with respect to the hedged portion.<br />
Hedging of future cash flows according to agreements, except for foreign currency<br />
hedges, is treated as a fair value hedge of a recognised asset and liability.<br />
Cash flow hedge<br />
Changes in the portion of the fair value of derivative financial instruments<br />
designated as and qualifying as a cash flow hedge and which effectively hedge<br />
changes in the value of the hedged item are recognised in the comprehensive<br />
income. The effective part of the change in the fair value is recognised as a separate<br />
equity reserve until the cash flow hedge effect the income statement.<br />
If the hedged transaction results in gains or losses, amounts previously recognised<br />
in equity are transferred to the same item in the income statement as<br />
the hedged item.<br />
For derivative financial instruments that do not qualify for hedge accounting,<br />
the hedge is dissolved. As soon as the cash flow hedge effect the<br />
income statement, the accumulated changes in fair value that are previously<br />
recognised in equity are transferred to the income statement.<br />
For derivative financial instruments that are no longer realised, the accumulated<br />
changes are transferred immediately to the income statement.<br />
Net investment hedge<br />
Changes in the fair value of derivative financial instruments used to hedge net<br />
investments in foreign subsidiaries or associates and which effectively hedge<br />
currency fluctuations in these companies are recognised in the consolidated<br />
financial statements directly in a separate translation reserve in equity.<br />
Other derivative financial instruments<br />
For derivative financial instruments that do not fulfil the requirements of<br />
being handled as hedge instrument, the changes in fair value are recognised<br />
successive in the income statement as financial income and expenses.<br />
Government grants<br />
Government grants related to funding for investments are offset against the<br />
cost of the non-current fixed asset and reduce the depreciation of the assets<br />
for which the grants are awarded.
<strong>DFDS</strong> annual report 2009 NOTEs 65<br />
Rental and lease matters<br />
When contracts for the hire and lease of ships, buildings and operating<br />
assets are of an operational nature, rental payments are recognised in the<br />
income statement for the period to which they relate. The remaining rental<br />
liability and lease obligations under such contracts are disclosed as contingent<br />
liabilities.<br />
Assets held under financial leases are recognised in the balance sheet and<br />
depreciated in the same way as the Group’s other non-current assets.<br />
Incentive plans<br />
The Group has set up equity-settled and cash-settled share-based compensation<br />
plans. Part of the Company’s holding of treasury shares is used under the<br />
Group’s share option plan.<br />
The value of services received in exchange for incentive plans is measured<br />
at the fair value of the options granted.<br />
Fair value is measured at the grant date for equity-settled plans. Fair value<br />
is measured at each balance sheet date and when vested for cash-settled<br />
plans. The fair value is recognised as a staff cost over the period in which the<br />
options vest with a corresponding increase in equity (equity-settled plans)<br />
and other payables (cash settled plans).<br />
The number of share options, expected to be exercised by employees, is<br />
estimated in the initial recognition in accordance with the service conditions<br />
described in Note 20. Subsequent to initial recognition, the estimate is<br />
adjusted on a continuing basis to reflect the actual number of exercised share<br />
options.<br />
The fair value of granted share options for equity-settled plans is estimated<br />
using the Black-Scholes option-pricing model. Vesting conditions are<br />
taken into account when estimating the fair value of the share options.<br />
Key ratios<br />
Key ratios are calculated in accordance with the Danish Society of Financial<br />
Analysts’ guidelines on the calculation of key ratios “Recommendations and<br />
Financial Ratios 2005”. The key ratios stated in the survey of consolidated<br />
financial highlights are defined on the “definitions and glossary” page.<br />
Income statement<br />
Revenue<br />
Revenue from passenger conveyance, sea freight transport and land transport<br />
etc. is recognised in the income statement at the time of delivery to the<br />
customer, which is the time of transfer of the risk.<br />
Revenue is measured at fair value, excluding value added tax and after the<br />
deduction of trade discounts.<br />
Costs<br />
When passenger conveyance, sea freight and land transport etc. are recognised<br />
as income, related costs are recognised in the income statement.<br />
Operating costs related to ships<br />
The operating costs of the ships comprise costs related to catering, ship<br />
fuel consumption including hedging and costs for ship maintenance that<br />
are not capitalised under non-current tangible assets.<br />
Charter hire<br />
Charter hire comprises costs related to bareboat and time charter<br />
agreements.<br />
Staff costs<br />
Wages, salaries, social security contributions, paid annual leave and sick leave,<br />
bonuses, and non-monetary benefits are accrued in the year in which the associated<br />
services are rendered by employees of the Group. Where the Group<br />
provides long-term employee benefits, the costs are accrued to match the<br />
rendering of the services by the employees concerned.<br />
Other costs of operation, sales and administration<br />
Other costs of operation, sales and administration comprise operating costs<br />
concerning land-based activities, including the lease, rental and maintenance of<br />
operating equipment. In addition, costs of sales, marketing and administration<br />
are included.<br />
Profit/loss on disposal of assets<br />
Profit/loss on disposal of assets is determined as the difference between the<br />
selling price or the disposal price and the carrying amount of net assets at<br />
the date of disposal including costs in connection with dismissal of staff on<br />
the ships and other disposal costs, such as obligations related to harbour dues<br />
and lease of terminal area, etc.<br />
Profit from equity investments in associated companies<br />
The Group’s income statement includes the pro rata share of the result in the<br />
associated companies after tax and minority interests after elimination of pro<br />
rata share of intercompany profit/purchase.<br />
Financial income and expenses<br />
Financial income and expenses comprises interest income and expense,<br />
realised and unrealised gains and losses on payables and transactions denominated<br />
in foreign currencies, realised gains and losses on securities, as well as<br />
the amortisation of financial assets and liabilities including financial leasing<br />
commitments as well as surcharges and allowances under the tax prepayment<br />
scheme (DK). Also included are realised and unrealised gains and losses on<br />
derivative financial instruments that are not designated as hedges.<br />
Tax<br />
Tax for the year comprises income tax, tonnage tax, and joint taxation<br />
contribution for the year of Danish subsidiaries as well as changes in deferred<br />
tax for the year. The tax expense relating to the profit/loss for the year is<br />
recognised in the income statement, and the tax expense relating to amounts<br />
directly recognised in equity is recognised directly in equity.<br />
The current payable Danish corporation tax is allocated by the settlement<br />
of a joint taxation contribution between the jointly taxed companies in<br />
proportion to their taxable income. In connection with the settlement the<br />
companies with a negative taxable income receive a joint taxation contribution<br />
from companies that have used the tax losses to reduce their own<br />
taxable profit.<br />
Tax computed on the taxable income and tonnage tax for the year is<br />
recognised in the balance sheet as tax payable or receivable or joint taxation<br />
contribution for Danish companies considering the payments on account.<br />
According to the Danish act of joint taxation, associated companies’ own<br />
corporation tax liabilities towards the Danish tax authorities are settled concurrently<br />
with the payment of the joint taxation contribution to the company<br />
that manages the joint taxation.<br />
Deferred tax is measured on all temporary differences between the<br />
carrying amount and the tax base of assets and liabilities. However, deferred<br />
tax is not recognised on temporary differences relating to goodwill that is not<br />
tax deductible, where temporary differences arise at the date of acquisition<br />
without affecting either profit/loss for the year or taxable income.<br />
Deferred tax relating to assets and liabilities subject to tonnage taxation is<br />
recognised to the extent that deferred tax is expected to occur.<br />
Deferred tax assets are recognised at the expected value of their<br />
utilisation. Adjustment is made to deferred tax resulting from elimination of<br />
unrealised intra-group profits and losses.<br />
Deferred tax is measured on the basis of the expected use and settlement<br />
of the individual assets and liabilities and according to the tax rules and<br />
at the tax rates applicable at the balance sheet date when the deferred tax is<br />
expected to crystallise as current tax. The change in deferred tax as a result<br />
of changes in tax rates is recognised in the income statement.
66 NOTEs<br />
<strong>DFDS</strong> annual report 2009<br />
Assets<br />
Current assets are defined as:<br />
n Assets expected to be realised in, or are held for sale or consumption in,<br />
the normal course of <strong>DFDS</strong>’ operating cycle, or<br />
n Assets held primarily for trading purposes or which are expected to<br />
be realised within twelve months of the balance sheet date, or<br />
n Cash or cash equivalent assets that are not restricted in use.<br />
All other assets are defined as non-current assets.<br />
Non-current intangible and tangible assets<br />
Generally the following applies unless otherwise specified:<br />
n Non-current intangible and tangible assets are measured at cost less the<br />
accumulated amortisation/depreciation and impairment.<br />
n Cost for non-current intangible and tangible assets include the costs of<br />
external suppliers, materials and components (only tangible assets), direct<br />
wages and salaries.<br />
n Interest paid from the time of payment until the date when the asset is<br />
available for use is included in cost. Cost also comprises gains and losses on<br />
transactions designated as hedges of non-current tangible assets.<br />
n The basis for amortisation/depreciation is determined as the cost less the<br />
expected residual value.<br />
n Non-current intangible and tangible assets are amortised/depreciated on a<br />
straight-line basis to the estimated residual value over the expected useful<br />
life at <strong>DFDS</strong>.<br />
n Expected useful life at <strong>DFDS</strong> and residual value are reassessed at least<br />
once a year. In estimating the expected useful life for ships it is taken into<br />
consideration that <strong>DFDS</strong> is continuously spending substantial funds on<br />
ongoing maintenance.<br />
n The effect of changes to the amortisation/depreciation period or residual<br />
value is recognised prospectively as a change in the accounting estimate.<br />
Goodwill<br />
At initial recognition goodwill is recognised in the balance sheet at cost as<br />
described in the section ‘Business combinations’. Subsequently, goodwill is<br />
measured at cost less accumulated impairments. Goodwill is not amortised.<br />
An impairment test is performed annually in connection with the presentation<br />
of next year’s budget.<br />
The book value of goodwill is allocated to the Group’s cash-generating<br />
units at the time of acquisition. Allocation of goodwill to cash-generating units<br />
is described in Note 11 and 39.<br />
Development projects<br />
Development projects, primarily the development of IT software, are recognised<br />
as non-current intangible assets if the following criteria are met:<br />
n the projects are clearly defined and identifiable;<br />
n the Group intends to use the projects;<br />
n there is sufficient assurance that future earnings can cover<br />
development costs and administrative expenses; and<br />
n the cost can be reliably measured.<br />
Ships<br />
The rebuilding of ships is capitalised if the rebuilding can be attributed to:<br />
n Safety measures.<br />
n Measures to lengthen the useful life of the ship.<br />
n Measures to improve earnings.<br />
n Docking.<br />
Expenses for improvements and maintenance are recognised in the income<br />
statement as incurred, including general maintenance work, to the extent the<br />
work can be designated as ongoing general maintenance (day-to-day service).<br />
Basically, other costs are capitalised.<br />
Docking costs are capitalised and depreciated on a straight-line basis over<br />
the period between two dockings. In most cases, the docking interval is two<br />
years for passenger ships and 2½ years for freighters and ro-pax ships.<br />
Gains or losses on the disposal of ships are determined as the difference<br />
between the selling price less the selling costs and the carrying amount at the<br />
disposal date. Gains or losses on the disposal of ships are recognised as gain/<br />
loss on disposal of ships, buildings and terminals.<br />
Passenger and ro-pax ships<br />
Due to differences in the wear of the components of passenger and ro-pax<br />
ships, the cost of these ships is divided into components with low wear, such<br />
as hulls and engines, and components with high wear, such as parts of the<br />
hotel and catering area.<br />
Freighters<br />
Cost of freighters is not divided into components as there is no difference in<br />
the wear of these ships.<br />
Depreciation, expected useful life and residual value<br />
The average depreciation period for component with low wear is 30 years<br />
for passenger ships and 25 years for ro-pax ships from the year in which the<br />
ships were built. The depreciation period for freighters is 25 years from the<br />
year in which the ships were built.<br />
For passenger and ro-pax ships, components with high wear are depreciated<br />
over 10-15 years. For ships the residual value of components with high<br />
wear is determined as DKK 0.<br />
Other non-current tangible assets<br />
Other non-current tangible assets comprise buildings, terminals and machinery,<br />
tools and equipment and leasehold improvements.<br />
The expected useful lives are as follows:<br />
Buildings<br />
Terminals etc.<br />
Equipment etc.<br />
Leasehold improvements<br />
25-50 years<br />
10-40 years<br />
4-10 years<br />
are max. depreciated over<br />
the term of the lease<br />
The amortisation of capitalised development projects starts after the completion<br />
of the development project and is provided on a straight-line basis<br />
over the expected useful live, normally 3-5 years, but in certain cases up to<br />
10 years.<br />
Other non-current intangible assets<br />
Other non-current intangible assets comprise the value of customer relations<br />
or similar identified as a part of acquisitions. Other non-current intangible<br />
assets are measured at cost less accumulated amortisations/depreciations<br />
and impairment. Depreciation is provided on a straight-line basis over the<br />
expected useful live, normally 3-5 years, but in certain cases up to 10 years.<br />
Gains or losses on the disposal of buildings, terminals, equipment and leasehold<br />
improvements are determined as the difference between the selling<br />
price less the disposal costs and the carrying amount at the date of disposal.<br />
The gains on the disposal of these non-current assets are recognised in the<br />
income statement as ‘Profit on disposal of tangible assets’.<br />
Assets held under financial leases<br />
Assets held under financial leases are recognised in the balance sheet at the<br />
lower of fair value and the present value of the minimum lease payments.<br />
The capitalised minimum lease payments are recognised in the balance sheet<br />
as a liability and the interest element of the lease payments is recognised in
<strong>DFDS</strong> annual report 2009 NOTEs 67<br />
‘financial costs’ the income statement. Assets held under financial leases are<br />
depreciated and written-down as the Company’s own non-current assets,<br />
however not exceeding the term of the lease.<br />
Profits on sale are deferred and recognised over the lease term for<br />
financial lease. For operational leases any profits on sale are recognised in the<br />
income statement immediately, if the sales price equals the fair value of the<br />
asset. Otherwise, the profits are deferred and amortised over the term of the<br />
operational lease.<br />
Investments in associates (the Group)<br />
Investments in associates are measured in the consolidated annual accounts<br />
under the equity method, whereby the investments in the balance sheet are<br />
measured at the proportionate share of the enterprises’ net asset values<br />
calculated in accordance with the accounting policies of the Group with addition<br />
of the carrying value of goodwill and after deduction or addition of the<br />
proportionate share of the unrealised intra-group profits and losses.<br />
Associates with negative net asset values are measured at DKK 0. If the<br />
Group has a legal or actual commitment to cover the associate’s deficit, the<br />
liability is recognised.<br />
Any receivables from the associates are written down to the extent that<br />
the receivables are considered to be irrecoverable.<br />
Other assets<br />
Other non-current assets and current assets are on initial recognition measured<br />
at cost. Subsequently these assets are measured as one of the following<br />
categories:<br />
n Trading portfolio: the asset is measured at fair value and the change<br />
of value is recognised through the income statement.<br />
n Available-for-sale: the asset is measured at fair value and change<br />
of value is recognised through the equity.<br />
n Loans and receivables: the asset is measured at the amortised cost<br />
and the change of value is recognised through the income statement.<br />
Investments in subsidiaries and associates (Parent Company)<br />
Investments in subsidiaries and associates are measured at cost in the<br />
balance sheet.<br />
Dividends from subsidiaries and investments in associates are recognised in<br />
the Parent Company’ income statement in the year where the dividends are declared.<br />
The cost of investments in subsidiaries and associates are written down<br />
to the extent that the dividends are considered repayment of the investment.<br />
Impairment<br />
The carrying amounts of non-current intangible, tangible and financial assets<br />
are continuously assessed, at least once a year, to determine whether there is<br />
an indication of impairment. When such impairment is present the recoverable<br />
amount of the asset is assessed. The recoverable amount is the higher of the<br />
net selling price and the net present value of the future net cash flow expected<br />
from the asset (value in use). The value in use is calculated as the present value<br />
of the future net cash flow the asset is expected to generate either by itself or<br />
from the lowest cash-generating unit to which the asset is allocated.<br />
Impairment tests of goodwill (value in use) are performed at least once a<br />
year. Impairment tests of the Group’s assets are performed once a year, typically<br />
in December. <strong>DFDS</strong> performs tests in between the annual tests in case there is<br />
an indication of impairment. Please view Note 39 for description of method.<br />
Securities<br />
Securities included in the trade portfolio are designated as ‘available-for-sale’<br />
and are measured at fair value, which for listed securities is the market price<br />
at the balance sheet date.<br />
When it is not possible to give a faithful estimate of a fair value for nonlisted<br />
securities, they are recognised at cost less impairment losses.<br />
Unrealised value adjustments on securities are recognised as a separate<br />
reserve (revaluation of securities) in equity except for impairments and<br />
exchange rate adjustments, which are recognised in the income statement<br />
under ‘Financial items’. When securities are realised, the accumulated value adjustment<br />
recognised directly in the equity under ‘financial income or expenses’<br />
will be transferred to the income statement.<br />
Inventories<br />
Inventories including catering supplies are measured at cost based on the<br />
weighted average cost method or the net realisable value if this is lower.<br />
Inventories including bunkers are measured at cost based on the FIFO<br />
method for bunkers and average prices for the remaining inventories. The net<br />
realisable value is recognised if lower than the cost.<br />
Receivables<br />
Receivables are recognised at amortised cost less impairment losses. Writedown<br />
is performed on an individual basis.<br />
Other receivables comprise calculated receivables on hedges, insurance<br />
receivables on loss or damage of ships, outstanding balances for chartered<br />
ships, interest receivable, etc.<br />
Prepayments<br />
The item includes cost incurred no later than the balance sheet date but<br />
which relates to subsequent years, e.g. prepaid charters, rents, etc.<br />
Assets held for sale<br />
Assets held for sale comprise non-current assets and disposal groups that are<br />
classified as held for sale. Disposal groups are groups of fixed assets subject<br />
to be sold or otherwise disposed of in a single transaction. Liabilities related<br />
to assets held for sale comprise liabilities directly attached to these assets<br />
and which will follow the assets when disposed. Assets are designated as ‘held<br />
for sale’ when the carrying amount primarily is recovered by a sale within 12<br />
months in accordance with a plan in stead of through continued usage.<br />
Assets or disposal groups ‘held for sale’ are measured at the lowest value<br />
of the carrying amount at the time of designation as ‘held for sale’ or the fair<br />
value less sales costs. Assets are not depreciated as from the date, they are<br />
designated as ‘held for sale’.<br />
Impairment losses from the initial classification of the non-current assets<br />
as held for sale as well as gains and losses from following measurement of the<br />
lowest value of the carrying amount or the fair value less sales costs are recognised<br />
in the income statement. Gains and losses are described in the Notes.<br />
Assets and the belonging liabilities are reported in separate lines in the<br />
balance sheet and the principal items are specified in the notes.<br />
Equity<br />
Dividends<br />
Proposed dividends are recognised as a liability at the date when they are<br />
adopted at the annual general meeting (time of declaration). The expected<br />
dividend payment for the year is disclosed as a separate item under equity.<br />
Treasury shares<br />
The cost of acquisition, consideration and dividends received from treasury<br />
shares is recognised directly in retained earnings in the equity. Accordingly,<br />
profits from sale of treasury shares are not recognised in the income statement.<br />
Holdings of treasury shares are recognised in the balance sheet at zero<br />
value. Nominal value of treasury shares (price 100) is recognised directly in<br />
equity as a separate reserved (own shares).<br />
Reserve for exchange rate adjustments<br />
Reserve for exchange rate adjustment comprise currency translation differences<br />
from translating annual accounts from a foreign currency to Danish<br />
Kroner and exchange rate adjustments related to assets and liabilities, which<br />
are included in the Group’s net investments.
68 NOTEs<br />
<strong>DFDS</strong> annual report 2009<br />
Reserve for hedging<br />
Reserve for hedging comprise the accumulated net change in fair value of<br />
hedging when qualifying for cash flow hedging, and the hedged transaction<br />
is not yet realised.<br />
Reserve for revaluation of securities<br />
Reserve for revaluation of securities comprises accumulated changes in fair<br />
value of the securities classified as ‘available-for-sale’. The reserve will be<br />
dissolved and transferred to the income statement in line with the selling or<br />
writing down the investment.<br />
Liabilities<br />
Current liabilities are:<br />
n liabilities expected to be settled in the normal course of <strong>DFDS</strong>’<br />
operating cycle, or<br />
n liabilities due to be settled within twelve months of the balance sheet date.<br />
All other liabilities are classified as non-current liabilities.<br />
Pension obligations and other non-current obligations<br />
Contributions to defined contribution plans are recognised in the income<br />
statement in the period to which they relate and any contributions outstanding<br />
are recognised in the balance sheet as other payables.<br />
Defined benefit plans are subject to an annual actuarial estimate of the<br />
present value of future benefits under the defined benefit plan. The present<br />
value is determined on the basis of assumptions about the future development<br />
in variables such as salary levels, interest rates, inflation and mortality.<br />
The present value is determined only for benefits earned by employees from<br />
employment in the Group. The actuarial present value less the fair value of<br />
any plan assets is recognised in the balance sheet under pensions, cf. below.<br />
Any difference between the expected development in plan assets and<br />
the defined benefit obligation and actual amounts results in actuarial gains or<br />
losses. If the cumulative actuarial gains or losses exceed the greatest of 10%<br />
of the defined benefit obligation or 10% of the fair value of the plan assets,<br />
the gains or losses are recognised in the income statement over the expected<br />
remaining working lives of the employees until pension payments are made.<br />
Actuarial gains or losses not exceeding the above limits are not recognised in<br />
the income statement.<br />
If changes in benefits relating to services rendered by employees in<br />
previous years result in changes in the actuarial present value, the changes are<br />
recognised in the income statement for the year as historical costs, provided<br />
employees have already earned the changed benefits. If employees have not<br />
earned the benefits, the historical costs are recognised in the income statement<br />
over the period in which the employees earn the changed benefits.<br />
Pension plans, considered as a net asset, are recognised as assets only if<br />
the asset equals the value of future repayments, or it will result in reduced<br />
payments.<br />
Other non-current personnel obligations include jubilee benefits, etc.<br />
Other provisions<br />
Other provisions are recognised where a legal or constructive obligation has<br />
been incurred as result of past events, and it is probable that it will lead to an<br />
outflow of resources that can be reliably estimated. Provisions are recognised<br />
for the estimated ultimate liability that is expected to arise, taking into account<br />
the foreign currency effects and the time-related monetary value.<br />
Interest bearing liabilities<br />
Amounts owed to mortgage credit institutions and banks, relating to loans<br />
which the Group expects to hold to maturity, are recognised at the date of<br />
borrowing at the net proceeds received less the transaction costs paid.<br />
In subsequent periods, the interest bearing liabilities are measured at<br />
amortised cost, corresponding to the capitalised value using the effective interest<br />
rate. Accordingly, the difference between the proceeds and the nominal<br />
value is recognised in the income statement under ‘financial costs’ over the<br />
term of the loan.<br />
Interest bearing liabilities also include the capitalised residual obligation on<br />
financial leases. Other liabilities are recognised at amortised cost.<br />
Other payables<br />
Other payables comprise amounts owed to staff, including wages, salaries and<br />
holiday pay. Amounts owed to public authorities include payable withholding<br />
tax, VAT, excise duties, real property taxes, etc., and amounts owed in connection<br />
with purchase/disposal of ships, buildings and terminals, interest expense,<br />
fair value of hedges, amounts due in respect of loss on ships and costs related<br />
to shipping operations, etc. Other payables also include amounts owed regarding<br />
defined contribution plans.<br />
Deferred income<br />
Includes payments received no later than at the balance sheet date but which<br />
relate to income in subsequent years.<br />
Cash flow statement<br />
The cash flow statement has been prepared using the indirect method and<br />
shows the consolidated cash flow from operating, investing, and financing<br />
activities for the year, and the consolidated cash and cash equivalents at the<br />
beginning and end of the year.<br />
The cash flow effect of acquisition and disposal of enterprises is shown<br />
separately in cash flows from investing activities.<br />
Cash flow from the acquisition of enterprises is recognised in the cash<br />
flow statement from the date of acquisition. Cash flow from the disposal of<br />
enterprises is recognised up to the date of disposal.<br />
Cash flow from operating activities is calculated on the basis of the profit/loss<br />
before amortisation and depreciation and financing, net and adjusted<br />
for non-cash operating items, changes in working capital, payments relating<br />
to financial items and corporation tax paid. Cash flow from investment<br />
activities includes payments in connection with the acquisition and disposal of<br />
enterprises and activities and of non-current intangible assets, tangible assets<br />
and investments. Cash flow from financing activities includes changes in the<br />
size or composition of the Group’s share capital, payment of dividends to<br />
shareholders and the obtaining and repayment of mortgage loans and other<br />
long-term and short-term debt. Cash and cash equivalents comprise cash.<br />
Significant estimates and judgements of accounts<br />
The preparation of financial statements in conformity with IFRS requires the<br />
management to make estimates and assumptions for future events, which affect<br />
the reported amounts of assets and liabilities, contingent assets and liabilities,<br />
and also income and costs. The management base their estimates on historical<br />
experience and various other assumptions that are believed to be reasonable<br />
under the circumstances. The results of this form the basis of estimating the reported<br />
accounting values of assets and liabilities as well as the reported income<br />
and costs, which do not appear directly from other material. The estimates and<br />
assumptions might be incomplete and inaccurate, and unexpected events or circumstances<br />
might occur. Furthermore, the actual outcome might diverge from<br />
these estimates due to certain risks and instabilities.<br />
Estimates and judgements are assessed regularly. Changes in accounting<br />
estimates are recognised in the period when the estimates are changed and<br />
are moving forward.<br />
Estimates and judgements made by the management that have an essential<br />
influence on the annual report and judgement with considerable risk that<br />
actual amounts might diverge from the amounts estimated by the management,<br />
are stated in Note 40.
<strong>DFDS</strong> annual report 2009 NOTEs 69<br />
Note 2 Segment information<br />
Information about products and services<br />
The segments and the allocation of operating profit, assets and liabilities, etc., are identical with the internal reporting structure in the Group. The costs in the business<br />
segments are allocated directly with the addition of a few systematically attributed indirect costs that primarily are related to central service functions.<br />
The applied accounting policy for the statement of the individual segment, including transactions between the segments, is in accordance with the Group’s applied<br />
accounting policy. Non-allocated costs are thus a term related to the central service functions, which cannot be allocated to the segments and which primarily consist<br />
of costs related to the Executive Board and Board of Directors as well as Corporate functions like Treasury, Investor Relation, Legal, Communication and Financial<br />
Control. Elimination of transactions between the segments is also included. Transactions between the segments are concluded at arm’s lenght.<br />
The “finance, net” is for each segment an allocation of the Groups “finance, net”. The allocation is based on a fixed interest rate assessed at the beginning of the year<br />
and is calculated on each segments average invested capital. The difference between the allocated “finance, net” and the Groups “finance, net” is reported as nonallocated.<br />
Segment assets includes assets, which are directly related to the segment, including non-current intangible, non-current tangible and other non-current assets,<br />
inventories, receivables, prepayments, cash in hand and at bank of group enterprises and deposits at the Parent Company. Segment liabilities include current and<br />
non-current liabilities.<br />
Ro-Ro Shipping’s main activity is operation of ro-ro and ro-pax tonnage. The customers are mainly transportation and shipping as well as manufacturers of heavy<br />
industrial goods with a high demand for sea transportation.<br />
Container Shipping’s main activity is operation of lo-lo tonnage. The customers are primarily importers/exporters and manufacturers of heavy industrial goods<br />
with a high demand for sea transportation.<br />
Passenger Shipping’s main activity is operation of passenger ships, as well as revenue from freight is important. The main business areas cover passengers with own cars,<br />
Mini Cruises, conferences and tour operators. Furthermore, the operation of the <strong>DFDS</strong> Canal Tours in Copenhagen habour is part of this segment.<br />
Terminal Services main activities includes own habour terminals in Denmark, England, Holland and Norway. The terminals handle goods like trailers, containers, cars and<br />
industrial goods. In addition, some terminals are also offering passenger transportation. The terminals operate mainly own routes.<br />
Trailer Service’s main activity comprises of trailer operators in Norway, Sweden, Denmark, Finland, Germany, Belgium, Holland, England and Ireland, who primarily offers<br />
full-load transportation solutions via the <strong>DFDS</strong> shipping network.<br />
The Tramp Shipping activity consists of four multi-purpose ships. This activity is presented in the balance sheet for 2007 as ‘assets and liabilities held for sale’ and the<br />
activity is disposed of in 2008.<br />
DKK ‘000<br />
RO-RO<br />
SHIPPING<br />
CONTAINER<br />
SHIPPING<br />
PASSENGER<br />
SHIPPING<br />
TERMINAL<br />
SERVICES<br />
TRAILER<br />
SERVICES<br />
TRAMP<br />
SHIPPING<br />
Nonallocated<br />
TOTAL<br />
2007<br />
Revenue from external customers 3,430,471 1,601,542 1,917,066 286,305 961,478 105,936 7,451 8,310,249<br />
Inter-segment revenue 249,866 21,518 14,912 416,748 24,276 0 164,552 891,872<br />
Total revenue 3,680,337 1,623,060 1,931,978 703,053 985,754 105,936 172,003 9,202,121<br />
Operating expenses, external -2,328,274 -1,381,850 -1,596,324 -680,420 -687,822 -97,077 -227,206 -6,998,973<br />
Inter-segment operating expenses -437,914 -108,644 -86,710 -10,560 -241,455 -35 -6,554 -891,872<br />
Operating profit before depreciation (EBITDA) 914,149 132,566 248,944 12,073 56,477 8,824 -61,757 1,311,276<br />
Share of profit/(loss) of associates 85 537 0 1,763 879 0 0 3,264<br />
Profit on disposal of tangible assets -975 286 35,049 2,851 303 -67 -603 36,844<br />
Depreciation of ships and other non-current assets -266,615 -73,538 -183,329 -26,664 -33,342 -8,224 -4,083 -595,795<br />
Value adjustment of goodwill/negative goodwill 1,973 0 0 0 0 0 0 1,973<br />
Operating profit (EBIT) 648,617 59,851 100,664 -9,977 24,317 533 -66,443 757,562<br />
Finance, net -129,889 -33,413 -57,411 -13,563 -6,331 -3,908 12,747 -231,768<br />
Profit before tax 518,728 26,438 43,253 -23,540 17,986 -3,375 -53,696 525,794<br />
Tax on profit -114,097<br />
Profit for the year 411,697<br />
Total assets 4,906,367 1,227,705 2,129,394 523,415 435,116 5,923 240,357 9,468,277<br />
Non-liquid operating items 717 6,169 9,953 166 0 7,019 6,634 30,658<br />
Capital expenditures of the year 99,803 41,607 78,696 8,050 18,465 6,611 6,676 259,908<br />
Investments in associates 0 313 0 0 0 0 0 313<br />
Assets held for sale, see Note 35 0 0 0 0 0 141,796 0 141,796<br />
Liabilities 2,962,391 525,717 1,433,066 175,185 167,293 17,222 675,853 5,956,727<br />
Note 2 continued on the next page >>>
70 NOTEs<br />
<strong>DFDS</strong> annual report 2009<br />
>>> Note 2 continued<br />
DKK ‘000<br />
RO-RO<br />
SHIPPING<br />
CONTAINER<br />
SHIPPING<br />
PASSENGER<br />
SHIPPING<br />
TERMINAL<br />
SERVICES<br />
TRAILER<br />
SERVICES<br />
TRAMP<br />
SHIPPING<br />
Nonallocated<br />
TOTAL<br />
2008<br />
Revenue from external customers 3,540,464 1,620,657 1,766,055 280,085 943,604 37,582 5,139 8,193,586<br />
Inter-segment revenue 258,247 15,190 12,650 367,133 18,917 0 171,305 843,442<br />
Total revenue 3,798,711 1,635,847 1,778,705 647,218 962,521 37,582 176,444 9,037,028<br />
Operating expenses, external -2,635,968 -1,458,670 -1,498,085 -662,618 -675,251 -29,522 -222,002 -7,182,116<br />
Inter-segment operating expenses -379,007 -96,174 -86,953 -15,403 -256,201 -403 -9,301 -843,442<br />
Operating profit before depreciation (EBITDA) 783,736 81,003 193,667 -30,803 31,069 7,657 -54,859 1,011,470<br />
Share of profit/(loss) of associates -30 945 0 1,235 2,328 0 0 4,478<br />
Profit on disposal of tangible assets 11,607 1,423 1,299 1,221 1,921 27,899 0 45,370<br />
Depreciation of ships and other non-current assets -260,659 -72,978 -179,585 -23,735 -28,657 0 -6,098 -571,712<br />
Impairments of ships and other non-current assets -4,413 -38,026 0 0 0 0 0 -42,439<br />
Value adjustment of goodwill/negative goodwill 20,094 0 0 -147 0 0 0 19,947<br />
Operating profit (EBIT) 550,335 -27,633 15,381 -52,229 6,661 35,556 -60,957 467,114<br />
Finance, net -127,368 -37,499 -51,651 -11,064 -5,936 -1,915 -10,749 -246,182<br />
Profit before tax 422,967 -65,132 -36,270 -63,293 725 33,641 -71,706 220,932<br />
Tax on profit 32,145<br />
Profit for the year 253,077<br />
Total assets<br />
4,622,808 949,063 1,806,260 430,632 395,726 3,890 217,072 8,425,451<br />
Non-liquid operating items -12 3,964 -5,509 154 0 1,181 3,788 3,566<br />
Capital expenditures of the year 326,880 34,975 62,342 20,452 27,940 0 14,486 487,075<br />
Assets held for sale, see Note 35 0 0 184,971 0 0 0 0 184,971<br />
Liabilities 2,528,252 351,473 1,134,906 170,920 149,728 11,018 779,633 5,125,930<br />
DKK 1.000<br />
RO-RO<br />
SHIPPING<br />
CONTAINER<br />
SHIPPING<br />
PASSENGER<br />
SHIPPING<br />
TERMINAL<br />
SERVICES<br />
TRAILER<br />
SERVICES<br />
Nonallocated<br />
TOTAL<br />
2009<br />
Revenue from external customers 2,767,057 1,152,653 1,619,128 243,846 766,608 6,191 6,555,483<br />
Inter-segment revenue 229,528 12,718 1,019 311,471 9,558 182,992 747,286<br />
Total revenue 2,996,585 1,165,371 1,620,147 555,317 776,166 189,183 7,302,769<br />
Operating expenses, external -2,134,557 -1,096,246 -1,185,886 -554,161 -543,260 -254,997 -5,769,107<br />
Inter-segment operating expenses -342,532 -64,366 -120,604 -14,958 -196,411 -8,415 -747,286<br />
Operating profit before depreciation (EBITDA) 519,496 4,759 313,657 -13,802 36,495 -74,229 786,376<br />
Share of profit/(loss) of associates 24 754 0 628 6 0 1,412<br />
Profit on disposal of tangible assets 27 9,157 70 1,474 6,441 448 17,617<br />
Depreciation of ships and other non-current assets -282,636 -49,960 -177,748 -22,747 -30,336 -8,791 -572,218<br />
Impairments of ships and other non-current assets -6,161 0 -33,000 0 -1,489 -20,000 -60,650<br />
Value adjustment of goodwill/negative goodwill 1,460 0 0 0 0 0 1,460<br />
Operating profit (EBIT) 232,210 -35,290 102,979 -34,447 11,117 -102,572 173,997<br />
Finance, net -134,494 -20,914 -46,754 -8,674 -6,423 62,967 -154,292<br />
Profit before tax 97,716 -56,204 56,225 -43,121 4,694 -39,605 19,705<br />
Tax on profit 69,123<br />
Profit for the year 88,828<br />
Total assets 5,579,774 882,542 1,702,489 439,570 410,318 272,275 9,286,968<br />
Non-liquid operating items 1 4,965 1,466 295 0 1,528 8,255<br />
Capital expenditures of the year 1,156,964 7,724 62,736 2,897 75,399 8,751 1,314,471<br />
Assets held for sale, see Note 35 10,984 0 0 0 0 0 10,984<br />
Liabilities 2,914,579 249,547 1,074,490 197,256 224,174 950,124 5,610,170<br />
Note 2 continued on the next page >>>
<strong>DFDS</strong> annual report 2009 NOTEs 71<br />
>>> Note 2 continued<br />
Information on geographical segments, etc.<br />
The <strong>DFDS</strong> Group’s risk and management control is attached to the Business Units’ activities. The <strong>DFDS</strong> Group does not have a natural geographic distribution, since the<br />
Group is based on a connected route network in Northern Europe, where the routes support each other with sales and customer services located in one country whereas<br />
the actual revenue is created in other countries. It is consequently not possible to present a meaningful distribution of revenues and non-current assets by country, and<br />
the distribution is therefore presented by water, in which <strong>DFDS</strong> operates, grouped as ‘North Seas and other seas’ and ‘The Baltic Sea’. The <strong>DFDS</strong> Group’s business model<br />
causes that the routes are not directly owning the ships but are only leasing the ships from a vessel pool. The ships are often re-located within the <strong>DFDS</strong> route network.<br />
It is consequently impossible to determine the exact volume of non-current assets by geographic segment, and an adapted model for allocation of non-current assets has<br />
been applied.<br />
DKK ‘000<br />
EXTERNAL<br />
REVENUES<br />
NON-CURRENT<br />
ASSETS<br />
2007<br />
North Sea and other seas 7,935,350 6,912,946<br />
The Baltic Sea 637,706 843,020<br />
Elimination -262,807 0<br />
Total 8,310,249 7,755,966<br />
2008<br />
North Sea and other seas 7,933,782 6,299,210<br />
The Baltic Sea 548,907 800,093<br />
Elimination -289,103 0<br />
Total 8,193,586 7,099,303<br />
2009<br />
North Sea and other seas 6,382,086 6,414,504<br />
The Baltic Sea 523,234 1,698,179<br />
Elimination -349,837 0<br />
Total 6,555,483 8,112,683<br />
Information on significant customers<br />
The <strong>DFDS</strong> Group as well as the Parent company does not have specific or associated customers representing individually or group-wise more than 10% of the total revenues.<br />
Parent Company<br />
DKK ‘000<br />
Consolidated<br />
DKK ‘000<br />
2007 2008 2009 Note 3 Revenue 2007 2008 2009<br />
984,082 908,678 798,848 Sale of goods on board 1,001,841 930,181 819,088<br />
4,024,412 4,104,642 3,281,596 Sale of service 7,024,451 7,013,092 5,428,173<br />
205,628 269,588 388,739<br />
Rental income from timecharter and bareboat of ships<br />
as well as operating equipment 283,957 250,313 308,222<br />
5,214,122 5,282,908 4,469,183 Total revenue 8,310,249 8,193,586 6,555,483<br />
Parent Company<br />
DKK ‘000<br />
Consolidated<br />
DKK ‘000<br />
2007 2008 2009 Note 4 Cost of sales 2007 2008 2009<br />
1,286,046 1,443,233 970,457 Cost of sales in operation costs related to ships 1,519,112 1,733,198 1,114,648<br />
7,444 2,347 1,945 Write-down of inventories for the year 7,444 2,347 1,945<br />
1,293,490 1,445,580 972,402 Total cost of sales 1,526,556 1,735,545 1,116,593<br />
Cost of sales consists of bunkers and cost of sales related to sale of goods and services on board.
72 NOTEs<br />
<strong>DFDS</strong> annual report 2009<br />
Parent Company<br />
DKK ‘000<br />
Consolidated<br />
DKK ‘000<br />
2007 2008 2009 Note 5 Staff costs 2007 2008 2009<br />
542,059 533,514 494,935 Wages and salaries 1,186,598 1,167,399 1,041,538<br />
37,401 40,324 36,338 Defined contributions plans 64,952 64,302 59,115<br />
-824 453 -162 Defined benefit plans, see Note 21 4,811 3,131 9,995<br />
31,690 30,532 28,487 Social security costs, etc. 136,628 136,774 123,077<br />
9,970 2,013 807 Share based payment, see Note 20 9,970 2,013 807<br />
54,494 35,528 17,849 Other staff costs 126,129 107,774 91,096<br />
674,790 642,364 578,254 Total staff costs 1,529,088 1,481,393 1,325,628<br />
Of this, remuneration for the Executive Board 1<br />
14,975 12,264 9,276 Wages and salaries 14,975 12,264 9,276<br />
3,048 2,659 1,347 Defined contributions plans 3,048 2,659 1,347<br />
9,950 2,013 807 Share based payment 9,950 2,013 807<br />
730 354 297 Other staff costs 730 354 297<br />
28,703 17,290 11,727 28,703 17,290 11,727<br />
Remuneration for the Parent Company's<br />
Board of Directors and Audit Committee<br />
625 625 625 Chairman 625 625 625<br />
375 375 400 Deputy chairman 375 375 400<br />
1,625 1,750 1,825 Other members of the Board of Directors 1,625 1,750 1,825<br />
2,625 2,750 2,850 2,625 2,750 2,850<br />
1,735 1,666 1,532 Average number of employees 4,427 4,301 3,924<br />
If members of the Executive Board resigns in accordance with a takeover of the Group, a special remuneration will be paid corresponding to 1 years salary. Beyond this no<br />
unusual agreements have been entered into with the Executive Board regarding terms of pension and retirement.<br />
1) Staff costs related to the Executive Board includes agreed severance benefit in connection with a director’s resignation at year-end 2007 respectively year-end 2008.<br />
Parent Company<br />
DKK ‘000<br />
2007 2008 2009<br />
Consolidated<br />
DKK ‘000<br />
Note 6 Other costs of operation, sales<br />
and administration 2007 2008 2009<br />
145,206 142,029 138,079 Selling costs, external 193,859 181,863 165,527<br />
225,553 200,906 171,063 Selling costs, internal - - -<br />
121,737 130,920 133,259 Other costs 247,414 242,287 224,897<br />
492,496 473,855 442,401 Total other costs of operation, sales and administration 441,273 424,150 390,424<br />
Of this, the fee for auditor appointed<br />
at the Annual General Meeting, KPMG<br />
1,195 1,245 1,215 Audit 4,510 4,594 3,716<br />
78 14 100 Other statements with assurance 198 89 532<br />
1,038 435 933 Tax and VAT services 2,185 1,108 1,723<br />
521 520 671 Other services 1,924 1,832 885<br />
2,832 2,214 2,919 Total fee 8,817 7,623 6,856
<strong>DFDS</strong> annual report 2009 NOTEs 73<br />
Parent Company<br />
DKK ‘000<br />
Consolidated<br />
DKK ‘000<br />
2007 2008 2009 Note 7 Profit on disposal of tangible assets 2007 2008 2009<br />
Gain on disposal of tangible assets<br />
35,045 0 0 Ships 35,359 47,361 9,495<br />
0 0 0 Terminals 2,238 0 670<br />
326 497 326 Equipment, etc. 4,456 5,845 7,707<br />
35,371 497 326 Gain on disposal of tangible assets 42,053 53,206 17,872<br />
Loss on disposal of tangible assets<br />
0 0 -14,918 Ships -5,060 -7,662 -244<br />
0 0 0 Terminals 0 -127 0<br />
0 0 -246 Equipment, etc. -149 -47 -11<br />
0 0 -15,164 Loss on disposal of tangible assets -5,209 -7,836 -255<br />
35,371 497 -14,838 Total profit on disposal of tangible assets 36,844 45,370 17,617<br />
Parent Company<br />
DKK ‘000<br />
Consolidated<br />
DKK ‘000<br />
2007 2008 2009 Note 8 Finance, net 2007 2008 2009<br />
4,801 11,594 8,228 Interest income, cash, cash equivalents 16,958 28,800 12,002<br />
63,052 68,777 71,350 Interest income from group enterprises - - -<br />
-179,056 -157,229 -150,164 Interest expenses, credit institutions, etc. -240,452 -219,213 -175,625<br />
-22,803 -30,478 -4,959 Interest expenses for group enterprises - - -<br />
-134,006 -107,336 -75,545 Interest, net -223,494 -190,413 -163,623<br />
59,371 91,022 133,382 Foreign exchange gains 72,059 138,102 124,564<br />
-74,041 -212,510 -66,106 Foreign exchange losses -64,804 -167,071 -105,150<br />
-14,670 -121,488 67,276 Foreign exchange gains and losses, net 7,255 -28,969 19,414<br />
4 0 0 Realised capital gains/losses on securities 4 380 -621<br />
0 -76,786 0 Impairment loss of investments in group enterprises - - -<br />
0 0 40,000 Reversal of prior years write-down of interest in group enterprises - - -<br />
561 0 0 Gain on sale/liquidation of group enterprises - - -<br />
0 0 0 Impairment loss on non-current financial assets -5,490 -22,120 -<br />
2,500 4,957 10,441 Dividends from group enterprises - - -<br />
1,194 1,194 0 Dividends from associates - - -<br />
2,590 2,257 2,804 Other dividends 2,590 2,257 2,804<br />
0 0 0 Defined benefit plans, see Note 21 -8,599 -2,643 -4,223<br />
-1,015 -1,558 -6,825 Other financial income and expenses -4,034 -4,674 -8,043<br />
5,834 -69,936 46,420 Other financial income and expenses, net -15,529 -26,800 -10,083<br />
-142,842 -298,760 38,151 Finance, net -231,768 -246,182 -154,292<br />
Finance, net is divided into<br />
74,702 88,779 200,099 Financial income 26,807 31,437 34,220<br />
-217,544 -387,539 -161,948 Financial expenses -258,575 -277,619 -188,512<br />
-142,842 -298,760 38,151 Finance, net -231,768 -246,182 -154,292<br />
<strong>DFDS</strong> A/S makes forward exchange transactions, etc., on behalf of all group enterprises, and therefore foreign exchange gains and losses in <strong>DFDS</strong> A/S also include the<br />
Group’s gross transactions. Transactions entered into on behalf of group enterprises are transferred to the group enterprises on back-to-back terms.<br />
”Interest, net” is related to financial instruments measured at amortizised cost.
74 NOTEs<br />
<strong>DFDS</strong> annual report 2009<br />
Parent Company<br />
DKK ‘000<br />
Consolidated<br />
DKK ‘000<br />
2007 2008 2009 Note 9 Tax 2007 2008 2009<br />
0 0 0 Current tax -24,345 -21,627 -21,117<br />
0 -2,981 -2,824 Current joint tax contributions -1,784 -2,888 -2,663<br />
0 0 0 Deferred tax -3,556 36,922 29,970<br />
0 -7,500 0 Adjustment of corporation tax, previous years -66,423 -5,578 68,670<br />
0 0 0 Adjustment of deferred tax, previous years -18,294 25,316 -5,722<br />
0 0 0 Adjustment of deferred tax, 28% to 25% 329 0 0<br />
0 -10,481 -2,824 Total tax for the year -114,073 32,145 69,138<br />
Total tax for the year can be specified as follows:<br />
0 -10,481 -2,824 Tax in the income statement (effective tax) -114,097 32,145 69,123<br />
0 0 0 Tax of equity movements 24 0 15<br />
0 -10,481 -2,824 Total tax for the year -114,073 32,145 69,138<br />
Tax in the income statement can be specified as follows:<br />
299,098 -9,554 35,176 Profit before tax 525,794 220,932 19,705<br />
311,286 -17,838 -3,120 Of this, tonnage income 431,151 258,443 56,120<br />
-12,188 8,284 38,296 Result before tax (company taxation) 94,643 -37,511 -36,415<br />
3,047 -2,071 -9,574 25% tax of profit before tax -23,661 9,378 9,104<br />
Adjustment to computed tax in foreign subsidiaries<br />
- - -<br />
compared to the 25% tax rate -1,587 4,888 3,458<br />
Tax effect of:<br />
-1,550 547 8,282 Non-taxable items -976 52 2,476<br />
-22 0 0 Tax asset, not recognised -2,676 -2,088 -7,083<br />
0 0 0 Utilisation of non-capitalised tax asset 1,104 2,058 341<br />
0 -7,500 0 Adjustments of tax related to previous years -84,388 19,738 62,948<br />
1,475 -9,024 -1,292 Corporation tax of ordinary income -112,184 34,026 71,244<br />
-1,475 -1,457 -1,532 Tonnage tax -1,913 -1,881 -2,121<br />
0 -10,481 -2,824 Tax in the income statement -114,097 32,145 69,123<br />
0.0 -109.7 8.0 Effective tax rate 21.7 -14.5 -350.8<br />
0.0 -31.2 8.0 Effective tax rate before adjustment of previous years' tax 5.7 -5.6 -31.3<br />
Tax on changes on equity can be specified as follows:<br />
0 0 0 Adjustments to previous years 24 0 0<br />
0 0 0 Deferred tax 0 0 15<br />
0 0 0 Total tax on changes in equity 24 0 15<br />
The Parent Company has not paid Danish corporation tax in 2009 and the company has no tax liability for that year.<br />
The Parent Company and its Danish subsidiaries are within the Danish Act of compulsory joint taxation with LF Investment ApS and J. Lauritzen A/S and these two companies’<br />
Danish affiliated companies. <strong>DFDS</strong> A/S is liable for the tax of its own taxable income. LF Investment ApS is the administration company in the joint taxation and settles<br />
all payments of corporation tax with the tax authorities.<br />
<strong>DFDS</strong> A/S, AB <strong>DFDS</strong> Lisco, <strong>DFDS</strong> Container Line B.V. (on and after 1 November 2007) and <strong>DFDS</strong> Lys Line Rederi AS have entered into tonnage tax arrangements where<br />
the taxable income related from transport of passengers and goods is computed based on the tonnage used during the year. Taxable income related to other activities is<br />
taxed according to the normal tax rules.<br />
Adjustment of previous years’ tax in 2009 primarily concerns reversal of recognised tax regarding the transition to the new tonnage tax legislation in Norway. Adjustment<br />
of previous years’ tax in 2007 primarily concerns the new tonnage tax legislation in Norway. See Note 26 for further information.
<strong>DFDS</strong> annual report 2009 NOTEs 75<br />
Consolidated<br />
DKK ‘000<br />
Note 10 Earnings per share 2007 2008 2009<br />
Profit for the year 411,697 253,077 88,828<br />
Minority interest of the Group's profit for the year -11,304 -6,518 -3,100<br />
Equity holders share of profit for the year 400,393 246,559 85,728<br />
Weighted average number of issued ordinary shares 8,000,000 8,000,000 8,000,000<br />
Weighted average number of treasury shares -358,068 -325,006 -337,335<br />
Weighted average number of ordinary shares 7,641,932 7,674,994 7,662,665<br />
Weighted average number of share options issued 56,218 10,173 237<br />
Weighted average number of ordinary shares (diluted) 7,698,150 7,685,167 7,662,902<br />
Basic earnings per share (EPS) of DKK 100 52.39 32.12 11.19<br />
Diluted earnings per share (EPS-D) of DKK 100 52.01 32.08 11.19<br />
Note 11<br />
Non-current intangible assets<br />
Consolidated<br />
DKK ‘000<br />
GOODWILL<br />
OTHER NON-<br />
CURRENT<br />
INTANGIBLE<br />
ASSETS<br />
SOFTWARE<br />
DEVELOPMENT<br />
PROJECTS IN<br />
PROGRESS<br />
TOTAL<br />
Balance at 1 January 2007 308,839 196,144 82,925 1,117 589,025<br />
Foreign exchange adjustment -1,845 -2,670 0 0 -4,515<br />
Addition related to acquisition 22,587 0 0 0 22,587<br />
Addition 7,463 0 6,094 8,458 22,015<br />
Disposal 0 -13,887 0 0 -13,887<br />
Cost at 31 December 2007 337,044 179,587 89,019 9,575 615,225<br />
Balance at 1 January 2007 10,244 44,340 41,169 0 95,753<br />
Foreign exchange adjustment -597 -1,334 0 0 -1,931<br />
Depreciation 0 39,020 11,766 0 50,786<br />
Depreciation on disposal 0 -13,887 0 0 -13,887<br />
Impairment and depreciation at 31 December 2007 9,647 68,139 52,935 0 130,721<br />
Carrying amount at 31 December 2007 327,397 111,448 36,084 9,575 484,504<br />
Balance at 1 January 2008 337,044 179,587 89,019 9,575 615,225<br />
Foreign exchange adjustment -19,468 -6,399 0 0 -25,867<br />
Transfer to/from other items 0 0 26,962 -26,962 0<br />
Addition related to acquisition 123 0 0 0 123<br />
Addition 9,363 3,119 7,607 21,362 41,451<br />
Cost at 31 December 2008 327,062 176,307 123,588 3,975 630,932<br />
Balance at 1 January 2008 9,647 68,139 52,935 0 130,721<br />
Foreign exchange adjustment -1,587 -4,430 0 0 -6,017<br />
Depreciation 0 35,627 12,794 0 48,421<br />
Impairment 147 42,439 0 0 42,586<br />
Impairment and depreciation at 31 December 2008 8,207 141,775 65,729 0 215,711<br />
Carrying amount at 31 December 2008 318,855 34,532 57,859 3,975 415,221<br />
Note 11 continued on the next page >>>
76 NOTEs<br />
<strong>DFDS</strong> annual report 2009<br />
>>> Note 11 continued<br />
Consolidated<br />
DKK ‘000<br />
GOODWILL<br />
OTHER NON-<br />
CURRENT<br />
INTANGIBLE<br />
ASSETS<br />
SOFTWARE<br />
DEVELOPMENT<br />
PROJECTS IN<br />
PROGRESS<br />
TOTAL<br />
Balance at 1 January 2009 327,062 176,307 123,588 3,975 630,932<br />
Foreign exchange adjustment 10,523 2,300 0 0 12,823<br />
Transfer to/from other items 0 0 3,185 -3,185 0<br />
Addition 14,905 1,488 17,089 5,164 38,646<br />
Cost at 31 December 2009 352,490 180,095 143,862 5,954 682,401<br />
Balance at 1 January 2009 8,207 141,775 65,729 0 215,711<br />
Foreign exchange adjustment 386 1,855 0 0 2,241<br />
Depreciation 0 19,753 18,698 0 38,451<br />
Impairment 0 1,489 0 0 1,489<br />
Impairment and depreciation at 31 December 2009 8,593 164,872 84,427 0 257,892<br />
Carrying amount at 31 December 2009 343,897 15,223 59,435 5,954 424,509<br />
The Group’s carrying amount of goodwill and other non-current intangible assets are allocated to the cash flow-generating units to which the assets can be attributed.<br />
The additions of goodwill in 2009 are related to the acquisition of minority interest in Halléns N.V. (DKK 14.9 million). The additions of goodwill in 2008 are related<br />
to the acquisition of minority interest in Halléns N.V. (DKK 9.4 million) and goodwill related to the acquisition of a minor company (DKK 0.1 million). The additions of<br />
goodwill in 2007 are primary related to the acquisition of <strong>DFDS</strong> Container Line B.V. (DKK 22.6 million) and the acquisition of minority interest in a minor company<br />
(DKK 7.5 million).<br />
The carrying amount of recognised goodwill concerns the following:<br />
DKK million 2007 2008 2009<br />
<strong>DFDS</strong> Container Line B.V. 156.0 155.8 155.7<br />
Halléns N.V, 33.3 42.6 57.5<br />
Acquisition of a route/bridge 55.6 47.9 50.9<br />
<strong>DFDS</strong> Lys Line AS 41.7 33.8 39.9<br />
Canal Tours A/S 14.1 14.1 14.1<br />
Other 26.7 24.7 25.8<br />
Total 327.4 318.9 343.9<br />
Value adjustment goodwill/negative goodwill in the income statement consists of impairment loss relating to goodwill, DKK 0 million (2008: DKK 0.1 million, 2007: DKK<br />
0.0 million) and negative goodwill from acquisition of shares in AB <strong>DFDS</strong> LISCO amounting DKK 1.5 million (2008: DKK 20.1 million, 2007: DKK 2.0 million).<br />
The carrying amount of other non-current intangible assets primary consist of value of customer portfolio/-relations identified from acquisitions and the right of sailing<br />
for a route (5-year non-competition clause) acquired in 2005.<br />
The carrying amount of recognised completed software and development projects in progress is primarily related to software for Passenger Shipping’s on-line booking<br />
and finance and logistic systems on the ships of Passenger Shipping.<br />
On the basis of the impairment tests performed in 2009 an impairment loss on non-current intangible assets in 2009 of DKK 1.5 million (2008: DKK 42.4 million, 2007:<br />
no impairment loss) has been recognized. The impairment loss is recognized in “Depreciation on ships and other non-current assets” in the income statement. See<br />
Note 39.<br />
Note 11 continued on the next page >>>
<strong>DFDS</strong> annual report 2009 NOTEs 77<br />
>>> Note 11 continued<br />
Parent Company<br />
DKK ‘000<br />
GOODWILL<br />
OTHER NON-<br />
CURRENT<br />
INTANGIBLE<br />
ASSETS<br />
SOFTWARE<br />
DEVELOPMENT<br />
PROJECTS IN<br />
PROGRESS<br />
TOTAL<br />
Balance at 1 January 2007 275,188 54,693 82,925 1,117 413,923<br />
Foreign exchange adjustment -2,501 -2,008 0 0 -4,509<br />
Addition 0 0 6,094 8,458 14,552<br />
Cost at 31 December 2007 272,687 52,685 89,019 9,575 423,966<br />
Balance at 1 January 2007 0 16,506 41,169 0 57,675<br />
Foreign exchange adjustment 0 -806 0 0 -806<br />
Depreciation 0 10,721 11,766 0 22,487<br />
Impairment and depreciation at 31 December 2007 0 26,421 52,935 0 79,356<br />
Carrying amount at 31 December 2007 272,687 26,264 36,084 9,575 344,610<br />
Balance at 1 January 2008 272,687 52,685 89,019 9,575 423,966<br />
Foreign exchange adjustment -7,665 -6,155 0 0 -13,820<br />
Transfer to/from other items 0 0 26,962 -26,962 0<br />
Addition 0 1,778 7,607 21,362 30,747<br />
Cost at 31 December 2008 265,022 48,308 123,588 3,975 440,893<br />
Balance at 1 January 2008 0 26,421 52,935 0 79,356<br />
Foreign exchange adjustment 0 -4,290 0 0 -4,290<br />
Depreciation 0 10,586 12,794 0 23,380<br />
Impairment 0 4,413 0 0 4,413<br />
Impairment and depreciation at 31 December 2008 0 37,130 65,729 0 102,859<br />
Carrying amount at 31 December 2008 265,022 11,178 57,859 3,975 338,034<br />
Balance at 1 January 2009 265,022 48,308 123,588 3,975 440,893<br />
Foreign exchange adjustment 2,986 2,399 0 0 5,385<br />
Transfer to/from other items 0 0 3,184 -3,184 0<br />
Addition 0 0 17,089 5,163 22,252<br />
Kostpris 31/12 2009 268,008 50,707 143,861 5,954 468,530<br />
Balance at 1 January 2009 0 37,130 65,729 0 102,859<br />
Foreign exchange adjustment 0 1,960 0 0 1,960<br />
Depreciation 0 7,898 18,697 0 26,595<br />
Impairment and depreciation at 31 December 2009 0 46,988 84,426 0 131,414<br />
Carrying amount at 31 December 2009 268,008 3,719 59,435 5,954 337,116<br />
The carrying amount of the Parent Company’s goodwill of DKK 268.0 million (2008: DKK 265.0 million, 2007: DKK 272.7 million) is related to acquisition of Ro-Ro<br />
Shipping routes from the Swedish subsidiary in 2001 and the acquisition of a route in 2005.<br />
The carrying amount of other non-current intangible assets consist of the right of sailing for a route acquired in 2005 (5-year non-competition clause).<br />
The carrying amount of recognised completed software and development projects in progress is primarily related to software for Passenger Shipping’s on-line booking<br />
and finance and logistic systems on the ships of Passenger Shipping.<br />
On the basis of the impairment tests performed in 2009 no impairment loss on non-current intangible assets (2008: DKK 4.4 million loss, 2007: no impairment loss) has<br />
been recognised. The impairment loss in 2008 is recognised in “Depreciation on ships and other non-current assets” in the income statement. See Note 39.
78 NOTEs<br />
<strong>DFDS</strong> annual report 2009<br />
Note 12<br />
Non-current tangible assets<br />
Consolidated<br />
DKK ‘000 BUILDINGS TERMINALS SHIPS<br />
EQUIPMENT,<br />
ETC.<br />
WORK IN<br />
PROGRESS AND<br />
PREPAYMENTS<br />
TOTAL<br />
Balance at 1 January 2007 93,810 528,309 9,518,547 664,011 11,705 10,816,382<br />
Foreign exchange adjustment -2,569 -25,759 -49,302 -15,255 1 -92,884<br />
Transfer to/from other items 7,948 0 33,591 0 -41,539 0<br />
Addition 1,677 8,444 98,912 48,698 57,575 215,306<br />
Disposal 0 -25,352 -317,561 -21,709 -343 -364,965<br />
Assets held for sale 0 0 -173,010 0 0 -173,010<br />
Cost at 31 December 2007 100,866 485,642 9,111,177 675,745 27,399 10,400,829<br />
Balance at 1 January 2007 22,382 148,153 2,550,948 338,900 0 3,060,383<br />
Foreign exchange adjustment -1,017 -6,822 -8,805 -11,777 0 -28,421<br />
Depreciation 2,981 20,541 456,608 69,634 0 549,764<br />
Depreciation on disposal 0 -24,368 -251,102 -20,450 0 -295,920<br />
Assets held for sale 0 0 -41,037 0 0 -41,037<br />
Impairment and depreciation<br />
at 31 December 2007 24,346 137,504 2,706,612 376,307 0 3,244,769<br />
Carrying amount at 31 December 2007 76,520 348,138 6,404,565 299,438 27,399 7,156,060<br />
Of this, financial leased assets 62,341 22,225 84,566<br />
Interest recognised in cost at 1 January 2007 46,413 46,413<br />
Foreign exchange adjustment -835 -835<br />
Interest recognised in cost<br />
at 31 December 2007 45,578 45,578<br />
Balance at 1 January 2008 100,866 485,642 9,111,177 675,745 27,399 10,400,829<br />
Foreign exchange adjustment -8,155 -69,040 -360,050 -47,723 -3 -484,971<br />
Transfer to/from other items 3,537 0 86,138 4,747 -94,422 0<br />
Addition related to acquisition 0 0 0 73 0 73<br />
Addition 5,648 1,897 67,097 66,815 306,187 447,644<br />
Disposal 0 -365 -71,235 -26,292 -2,216 -100,108<br />
Assets held for sale 0 0 -576,577 0 0 -576,577<br />
Cost at 31 December 2008 101,896 418,134 8,256,550 673,365 236,945 9,686,890<br />
Balance at 1 January 2008 24,346 137,504 2,706,612 376,307 0 3,244,769<br />
Foreign exchange adjustment -2,865 -20,697 -98,775 -38,348 0 -160,685<br />
Depreciation 3,627 18,393 441,666 64,317 0 528,003<br />
Depreciation on disposal 0 -22 -64,862 -22,529 0 -87,413<br />
Assets held for sale 0 0 -391,606 0 0 -391,606<br />
Impairment and depreciation<br />
at 31 December 2008 25,108 135,178 2,593,035 379,747 0 3,133,068<br />
Carrying amount at 31 December 2008 76,788 282,956 5,663,515 293,618 236,945 6,553,822<br />
Of this, financial leased assets 32,772 7,368 40,140<br />
Interest recognised in cost at 1 January 2008 45,578 45,578<br />
Foreign exchange adjustment -2,364 -2,364<br />
Recognised interest for the year 0 7,599 7,599<br />
Interest recognised in cost<br />
at 31 December 2008 43,214 7,599 50,813<br />
Note 12 continued on the next page >>>
<strong>DFDS</strong> annual report 2009 NOTEs 79<br />
>>> Note 12 continued<br />
Consolidated<br />
DKK ‘000 BUILDINGS TERMINALS SHIPS<br />
EQUIPMENT,<br />
ETC.<br />
WORK IN<br />
PROGRESS AND<br />
PREPAYMENTS<br />
TOTAL<br />
Balance at 1 January 2009 101,896 418,134 8,256,550 673,365 236,945 9,686,890<br />
Foreign exchange adjustment 2,435 15,986 192,390 17,515 -4 228,322<br />
Transfer to/from other items 197 171 315,879 2,166 -318,413 0<br />
Addition 757 1,699 1,112,771 69,858 90,740 1,275,825<br />
Disposal 0 -488 -175,246 -59,137 0 -234,871<br />
Transferred to assets held for sale 0 0 -99,426 0 0 -99,426<br />
Transferred from assets held for sale 0 0 576,577 0 0 576,577<br />
Cost at 31 December 2009 105,285 435,502 10,179,495 703,767 9,268 11,433,317<br />
Balance at 1 January 2009 25,108 135,178 2,593,035 379,747 0 3,133,068<br />
Foreign exchange adjustment 751 4,856 58,559 12,974 0 77,140<br />
Depreciation 4,105 17,086 452,657 64,445 0 538,293<br />
Impairment 0 0 6,161 0 0 6,161<br />
Depreciation on disposal 0 -86 -151,032 -52,220 0 -203,338<br />
Transferred to assets held for sale 0 0 -88,442 0 0 -88,442<br />
Transferred from assets held for sale 0 0 444,606 0 0 444,606<br />
Impairment and depreciation<br />
at 31 December 2009 29,964 157,034 3,315,544 404,946 0 3,907,488<br />
Carrying amount at 31 December 2009 75,321 278,468 6,863,951 298,821 9,268 7,525,829<br />
Of this, financial leased assets 0 58,111 58,111<br />
Interest recognised in cost at 1 January 2009 43,214 7,599 50,813<br />
Foreign exchange adjustment 1,195 0 1,195<br />
Recognised interest for the year 8,606 0 8,606<br />
Transferred to/from other items 7,599 -7,599 0<br />
Interest recognised in cost<br />
at 31 December 2009 60,614 0 60,614<br />
Carrying amount of assets pledged as securities 6,539,593<br />
The carrying amount of ships includes passenger ships, DKK 1,650 million (2008: DKK 1,815 million, 2007: DKK 2,253 million) of which components with high decrease in<br />
value amounts to DKK 442 million (2008: DKK 505 million, 2007: DKK 623 million) and components with minor decrease in value amounts to DKK 1,208 million (2008:<br />
DKK 1,310 million, 2007: DKK 1,630 million).<br />
Interest included in costs for the Group are calculated by using an interest rate based on the general borrowing of the Group. The applied interest rate is 2.0 – 5.5%.<br />
The interest rate for capitalized interest is 5.5% in 2008 (no capitalized interests in 2007).<br />
The income statement includes depreciation on ships of DKK -448 million (2008: DKK -437 million, 2007: DKK -452 million). Of this, amortisation of profit/loss on sale<br />
and lease back transactions amounts to DKK 4.5 million (2008: DKK 4.7 million, 2007: DKK 4.8 million).<br />
As of 31 December 2009 one ship is classified as assets held for sale. The ship is in 2010 stored for scrap. In 2008 the realised profit from sale of assets, which as of 31<br />
December 2007 were classified as held for sale, was DKK 27.9 million.<br />
On the basis of the impairment tests performed in 2009 an impairment loss on a ship classified as an asset held for sale, DKK 53.0, million, is recognised. The ship is<br />
added back to tangible assets as of 31 December 2009. Furthermore an impairment loss on a ship classified as an asset held for sale, DKK 6.1 million, is recognised (2008<br />
and 2007: no impairment). See Note 39 for further information.<br />
Parent Company<br />
DKK ‘000 BUILDINGS TERMINALS SHIPS<br />
EQUIPMENT,<br />
ETC.<br />
WORK IN<br />
PROGRESS AND<br />
PREPAYMENTS<br />
TOTAL<br />
Balance at 1 January 2007 15,330 72,422 5,870,592 144,793 5,208 6,108,345<br />
Transfer to/from other items 0 0 24,860 0 -24,860 0<br />
Addition 906 0 78,397 17,883 44,167 141,353<br />
Disposal 0 -492 -318,392 -1,832 -345 -321,061<br />
Cost at 31 December 2007 16,236 71,930 5,655,457 160,844 24,170 5,928,637<br />
Balance at 1 January 2007 4,692 42,148 1,787,446 75,785 0 1,910,071<br />
Depreciation 1,323 2,105 274,212 16,842 0 294,482<br />
Depreciation on disposal 0 -492 -251,931 -1,575 0 -253,998<br />
Impairment and depreciation<br />
at 31 December 2007 6,015 43,761 1,809,727 91,052 0 1,950,555<br />
Carrying amount at 31 December 2007 10,221 28,169 3,845,730 69,792 24,170 3,978,082<br />
Of this, financial leased assets 15,146 4,806 19,952<br />
Interest recognised in cost at 1 January 2007 26,631 0 26,631<br />
Interest recognised in cost at 31 December 2007 26,631 0 26,631<br />
Note 12 continued on the next page >>>
80 NOTEs<br />
<strong>DFDS</strong> annual report 2009<br />
>>> Note 12 continued<br />
Parent Company<br />
DKK ‘000 BUILDINGS TERMINALS SHIPS<br />
EQUIPMENT,<br />
ETC.<br />
WORK IN<br />
PROGRESS AND<br />
PREPAYMENTS<br />
TOTAL<br />
Balance at 1 January 2008 16,236 71,930 5,655,457 160,844 24,170 5,928,637<br />
Transfer to/from other items 3,537 0 47,921 4,747 -56,205 0<br />
Addition 378 0 40,764 32,790 285,654 359,586<br />
Disposal 0 0 -33,755 -926 -21,081 -55,762<br />
Assets held for sale 0 0 -576,577 0 0 -576,577<br />
Cost at 31 December 2008 20,151 71,930 5,133,810 197,455 232,538 5,655,884<br />
Balance at 1 January 2008 6,015 43,761 1,809,727 91,052 0 1,950,555<br />
Depreciation 1,515 1,971 271,411 18,500 0 293,397<br />
Depreciation on disposal 0 0 -28,427 -926 0 -29,353<br />
Assets held for sale 0 0 -391,606 0 0 -391,606<br />
Impairment and depreciation<br />
at 31 December 2008 7,530 45,732 1,661,105 108,626 0 1,822,993<br />
Carrying amount at 31 December 2008 12,621 26,198 3,472,705 88,829 232,538 3,832,891<br />
Of this, financial leased assets 7,294 2,443 9,737<br />
Interest recognised in cost at 1 January 2008 26,631 0 26,631<br />
Recognised interest for the year 0 7,599 7,599<br />
Interest recognised in cost at 31 December 2008 26,631 7,599 34,230<br />
Balance at 1 January 2009 20,151 71,930 5,133,810 197,455 232,538 5,655,884<br />
Transfer to/from other items 130 0 152,183 298 -152,611 0<br />
Addition 646 875 35,508 10,907 110,045 157,981<br />
Disposal 0 0 -399,204 -804 -182,901 -582,909<br />
Transferred to assets held to sale 0 0 -23,988 0 0 -23,988<br />
Transferred from assets held to sale 0 0 576,577 0 0 576,577<br />
Cost at 31 December 2009 20,927 72,805 5,474,886 207,856 7,071 5,783,545<br />
Balance at 1 January 2009 7,530 45,732 1,661,105 108,626 0 1,822,993<br />
Depreciation 1,815 1,860 262,894 20,709 0 287,278<br />
Impairment 0 0 6,161 0 0 6,161<br />
Depreciation on disposal 0 0 -144,885 -303 0 -145,188<br />
Transferred to assets held to sale 0 0 -23,988 0 0 -23,988<br />
Transferred from assets held to sale 0 0 444,606 0 0 444,606<br />
Impairment and depreciation<br />
at 31 December 2009 9,345 47,592 2,205,893 129,032 0 2,391,862<br />
Carrying amount at 31 December 2009 11,582 25,213 3,268,993 78,824 7,071 3,391,683<br />
Of this, financial leased assets 0 0 0<br />
Interest recognised in cost at 1 January 2009 26,631 7,599 34,230<br />
Recognised interest for the year 1,910 0 1,910<br />
Transferred to/from other items 442 -442 0<br />
Disposal 0 -7,157 -7,157<br />
Interest recognised in cost<br />
at 31 December 2009 28,983 0 28,983<br />
Carrying amount of assets pledged as securities 3,266,287<br />
The carrying amount of ships includes passenger ships, DKK 1,624 million (2008: DKK 1,787 million, 2007: DKK 2,228 million) of which components with high<br />
decrease on value amounts to DKK 442 million (2008: DKK 505 million, 2007: DKK 623 million) and components with minor decrease in value amounts to<br />
DKK 1,182 million (2008: DKK 1,282 million, 2007: DKK 1,605 million).<br />
Interest rates included in costs for the Parent Company are calculated by using an interest rate based on the general borrowing. The applied interest rate is 2.0 –<br />
5.5%. The interest rate for capitalized interest is 5.5% in 2009 (2008: 5.5%, 2007: no capitalized interests).<br />
On the basis of the impairment tests performed in 2009 an impairment loss on a ship classified as an asset held for sale, DKK 53.0, million, and on improvements<br />
on a ship chartered from an affiliated company, DKK 6.1 million, is recognised (2008 and 2007: no impairment). For further information see Note 39.
<strong>DFDS</strong> annual report 2009 NOTEs 81<br />
Parent Company<br />
DKK ‘000<br />
Note 13 Investments in group enterprises 2007 2008 2009<br />
Balance at 1 January 1,677,600 1,703,412 1,735,368<br />
Addition 68,003 31,956 112,608<br />
Disposal -42,191 0 0<br />
Cost at 31 December 1,703,412 1,735,368 1,847,976<br />
Accumulated impairment loss at 1 January -63,997 -56,973 -135,695<br />
Impairment loss 0 -78,722 0<br />
Reversal of impairment from previous years 0 0 40,000<br />
Disposal 7,024 0 0<br />
Accumulated impairment loss at 31 December -56,973 -135,695 -95,695<br />
Carrying amount at 31 December 1,646,439 1,599,673 1,752,281<br />
Overview of group enterprises, see Note 42.<br />
Besides the above investments in group enterprises, <strong>DFDS</strong> A/S considers receivables DKK 433.7 million (2008: DKK 408.2 million, 2007: DKK 473.5 million) as a part of the<br />
net investment in group enterprises. The foreign exchange adjustment of this is DKK 25.4 million (2008: DKK -65.3 million, 2007: DKK -21.3 million), which is recognised<br />
directly in equity in the consolidated financial statements. In the financial statements for the Parent Company the foreign exchange adjustment is recognised in the income<br />
statement under financial income and expenses, net.<br />
Impairment tests of the carrying amount of the Parent Company’s investments in group enterprises are prepared at least once a year. Based on the impairment tests performed<br />
in 2009 no impairment on investments in group enterprises has been recognised (2008: impairment on investments in two group enterprises, 2007: no impairment).<br />
See Note 39. In 2009 part of an impairment on investment in group enterprises made in 2008 was reversed.<br />
DKK 20.7 million of the addition in 2007 regards cost of group enterprises, which the Parent Company has received in connection with the liquidation of own group<br />
enterprises.
82 NOTEs<br />
<strong>DFDS</strong> annual report 2009<br />
Parent Company<br />
DKK ‘000<br />
Consolidated<br />
DKK ‘000<br />
2007 2008 2009 Note 14 Investments in associates 2007 2008 2009<br />
7,333 7,333 7,333 Balance at 1 January 8,770 9,125 8,429<br />
- - - Foreign exchange adjustment 42 -310 169<br />
- - - Addition 313 0 0<br />
- - - Disposal 0 -386 -159<br />
- - -7,110 Transferred to other types of assets 0 0 -7,110<br />
7,333 7,333 223 Cost at 31 December 9,125 8,429 1,329<br />
- - - Value adjustments at 1 January 1,455 2,266 3,738<br />
- - - Foreign exchange adjustment 50 -796 566<br />
- - - Disposal 0 92 28<br />
- - - Share of profit for the year 3,264 4,478 1,412<br />
- - - Dividends from associates -2,503 -2,302 -1,350<br />
- - - Transferred to other types of assets 0 0 -940<br />
- - - Value adjustments at 31 December 2,266 3,738 3,454<br />
7,333 7,333 223 Carrying amount at 31 December 11,391 12,167 4,783<br />
The Group’s share<br />
DKK ‘000<br />
DOMICILE OWNERSHIP REVENUE<br />
PROFIT FOR<br />
THE YEAR<br />
TOTAL<br />
ASSETS<br />
TOTAL<br />
LIABILITIES<br />
EQUITY<br />
PROFIT FOR<br />
THE YEAR<br />
2007<br />
Suardiaz <strong>DFDS</strong> Autologistics NV Gent 50.0 % 1 0 -16 439 9 215 -8<br />
ICT Holding A/S Vejle 19.9 % 4 210,000 4,417 29,906 9,526 6,916 879<br />
UAB Krantas Forwarding Klaipeda 50.0 % 2,123 183 736 164 286 92<br />
Moss Containerterminal AS Moss 50.0 % 16,807 -285 2,892 2,221 336 -143<br />
Oslo Containerterminal AS Oslo 33.3 % 67,209 5,718 16,874 8,754 2,705 1,905<br />
Seafront Projects AS Kristiansand 34.0 % 74,544 1,584 17,759 15,248 854 539<br />
<strong>DFDS</strong> Suardiaz Line Ltd. Immingham 50.0 % 229,726 -10,982 58,568 73,229 -7,329 -5,490<br />
SCF Lines Ltd. Sankt Petersburg 40.0 % 3,624 0 1,137 940 79 0<br />
4,062 -2,226<br />
Of which investments in associates with negative value 7,329 5,490<br />
11,391 3,264<br />
2008<br />
Suardiaz <strong>DFDS</strong> Autologistics NV Gent 50.0 % 1 0 -16 439 25 207 -8<br />
ICT Holding A/S Vejle 19.9 % 4 275,000 11,698 38,561 10,702 8,050 2,328<br />
UAB Krantas Forwarding Klaipeda 50.0 % 1,689 -43 274 67 104 -22<br />
Moss Containerterminal AS Moss 50.0 % 2 0 58 0 0 0 29<br />
Oslo Containerterminal AS Oslo 33.3 % 39,356 3,617 15,396 8,641 2,249 1,206<br />
Seafront Projects AS Kristiansand 34.0 % 127,288 2,779 20,444 16,098 1,478 945<br />
<strong>DFDS</strong> Suardiaz Line Ltd. Immingham 50.0 % 172,748 -22,769 30,288 61,121 -15,416 -11,384<br />
SCF Lines Ltd. Sankt Petersburg 50.0 % 3,624 0 1,098 940 79 0<br />
-3,249 -6,906<br />
Of which investments in associates with negative value 15,416 11,384<br />
12,167 4,478<br />
2009<br />
Suardiaz <strong>DFDS</strong> Autologistics NV Gent 50.0 % 1 0 -16 398 0 199 -8<br />
UAB Krantas Forwarding Klaipeda 50.0 % 3 421 68 0 0 0 34<br />
Oslo Containerterminal AS Oslo 33.3 % 33,192 1,885 16,471 9,209 2,421 628<br />
Seafront Projects AS Kristiansand 34.0 % 103,737 2,217 15,649 9,531 2,080 754<br />
<strong>DFDS</strong> Suardiaz Line Ltd. Immingham 50.0 % 153,684 -3,238 20,229 67,885 -23,828 -1,619<br />
SCF Lines Ltd. Sankt Petersburg 50.0 % 0 8 166 0 83 4<br />
-19,045 -207<br />
Of which investments in associates with negative value 23,828 1,619<br />
4,783 1,412<br />
1) Owned by the Parent Company.<br />
2) Moss Containerterminal AS was an associate up to 31 March 2008 where the rest of the company was acquired. In this table the result for the period 1 January 2008<br />
up to 31 March 2008 is stated.<br />
3) UAB Krantas Forwarding was an associate up to 24 July 2009 where the company was sold.<br />
4) ICT Holding A/S has been transferred to securities because of the reduced number of directorships.
<strong>DFDS</strong> annual report 2009 NOTEs 83<br />
Parent Company<br />
DKK ‘000<br />
Consolidated<br />
DKK ‘000<br />
2007 2008 2009 Note 15 Receivables 2007 2008 2009<br />
556,513 507,522 1,282,553 Amounts owed by group enterprises - - -<br />
0 0 0 Other non-current receivables 3,029 27,644 24,826<br />
556,513 507,522 1,282,553 Total non-current receivables 3,029 27,644 24,826<br />
134,851 128,231 101,610 Trade receivables 935,178 741,335 721,558<br />
912,632 767,001 945,746 Amounts owed by group enterprises - - -<br />
0 1,082 1,140 Amounts owed by associates 9,520 2,251 2,799<br />
0 0 0 Corporation tax and joint taxation contribution, receivable 13,722 6,515 8,307<br />
2,843 27,002 18,177 Derivative financial instruments, forward transactions and bunker hedges 2,843 27,002 10,892<br />
12,462 24,986 17,122 Other receivables and current assets 62,435 69,886 77,009<br />
1,062,788 948,302 1,083,795 Total current receivables 1,023,698 846,989 820,565<br />
1,619,301 1,455,824 2,366,348 Total receivables 1,026,727 874,633 845,391<br />
Write-downs included in above receivables:<br />
711 5,542 9,565 Write-downs at 1 January 8,024 16,145 18,854<br />
- - - Foreign exchange adjustment, write-downs 1 January -243 -1,346 424<br />
6,144 9,055 24,957 Write-downs for the year 11,212 10,482 32,484<br />
-1,212 -2,826 -2,915 Realised losses for the year -1,409 -3,827 -5,906<br />
-101 -2,206 -11,378 Reversed write-downs for the year -1,439 -2,600 -13,128<br />
5,542 9,565 20,229 Write-downs at 31 December 16,145 18,854 32,728<br />
Write-downs and realised losses are recognised in operational cost in the income statement.<br />
The carrying amount of receivables is in all material respects approximate to the fair value.<br />
Age distribution of written down trade receivables<br />
Maturity period:<br />
196 1,242 3,045 Up to 30 days 751 2,452 9,764<br />
0 0 533 31-60 days 405 841 562<br />
0 0 0 61-90 days 2,438 2,326 425<br />
0 0 1,530 91-120 days 1,018 405 1,714<br />
5,346 8,323 15,121 Above 120 days 7,006 10,669 15,321<br />
0 0 0 Categorised write down 4,527 2,161 4,942<br />
5,542 9,565 20,229 16,145 18,854 32,728<br />
The write-downs are caused by the customers bankruptcy or expected bankruptcy as well as uncertainty about the customers ability and willingness to pay.<br />
Age distribution of overdue, but not written down,<br />
trade receivables<br />
Maturity period:<br />
56,049 63,589 21,480 Up to 30 days 265,974 230,409 155,982<br />
1,419 794 1,852 31-60 days 35,360 21,869 23,600<br />
0 40 1,788 61-90 days 12,115 8,994 10,747<br />
307 327 849 91-120 days 4,114 3,059 3,670<br />
1,561 1,915 3,441 Above 120 days 7,221 4,756 5,485<br />
59,336 66,665 29,410 324,784 269,087 199,484<br />
No secured receivables are overdue on 31 December 2009 (2008: none, 2007: none).
84 NOTEs<br />
<strong>DFDS</strong> annual report 2009<br />
Parent Company<br />
DKK ‘000<br />
Consolidated<br />
DKK ‘000<br />
2007 2008 2009 Note 16 Securities 2007 2008 2009<br />
14,266 5,810 10,375 Listed shares 14,266 5,810 10,375<br />
8,818 8,818 16,931 Other shares and equity investments 10,138 10,114 18,190<br />
1,404 1,529 1,529 Other investments 1,404 1,529 1,529<br />
24,488 16,157 28,835 Total securities 25,808 17,453 30,094<br />
Securities in both the Parent Company and the Group are non-current assets classified as ‘available for sale’.<br />
Other shares and equity investments as well as other investments consist of some minor unlisted enterprises and holdings. These assets are not adjusted to fair value<br />
because the fair value cannot be measured reliable. Instead the securities are recognised at cost reduced by write-downs, if any.<br />
During 2009 there has been no disposal of other shares and equity investments. In 2009 ICT Holding A/S was transferred from associate to securities because of the<br />
reduced number of directorships.<br />
During 2008 two group enterprises have disposed shares and equity investments, which were recognised at the cost of DKK 20 thousand. The profit from sale constitutes<br />
DKK 380 thousand and is included in financial income.<br />
During 2007 the Parent Company has disposed shares and equity investments, which were recognised at the cost of DKK 85 thousand. The profit from sale constitutes<br />
DKK -4 thousand and is included in financial costs.<br />
Parent Company<br />
DKK ‘000<br />
Consolidated<br />
DKK ‘000<br />
2007 2008 2009 Note 17 Inventories 2007 2008 2009<br />
49,305 40,404 32,409 Bunkers 60,822 47,644 38,340<br />
37,720 29,032 33,789 Goods for sale and raw materials for restaurants 42,810 34,369 40,385<br />
-7,444 -2,347 -1,945 Write-down of inventories for the year -7,444 -2,347 -1,945<br />
79,581 67,089 64,253 Total inventories 96,188 79,666 76,780<br />
Parent Company<br />
NUMBER OF SHARES<br />
Note 18 Holding of treasury shares 2007 2008 2009<br />
Holding of treasury shares at 1 January 391,120 338,895 339,751<br />
Disposals of the year related to share options used -52,225 -30,000 -3,000<br />
Acquisition of treasury shares 0 30,856 0<br />
Holding of treasury shares at 31 December 338,895 339,751 336,751<br />
Market value of treasury shares at 31 December, DKK '000 267,727 135,561 120,388<br />
At the Annual General Meeting in April 2009 the Board of Directors was authorised – until the Annual General Meeting 2010 – to acquire treasury shares at a nominal<br />
value totalling 10% of the <strong>DFDS</strong> A/S’ share capital.<br />
The Company’s holdings of treasury shares at 31 December 2009 are 336,751 shares (2008: 339,751 shares, 2007: 338,895 shares), corresponding to 4.21% (2008: 4.25%,<br />
2007: 4.24%) of the Company’s share capital. Treasury shares have originally been acquired to cover a share option scheme for employees.<br />
Parent Company<br />
DKK ‘000<br />
Consolidated<br />
DKK ‘000<br />
2007 2008 2009 Note 19 Deferred tax 2007 2008 2009<br />
0 0 0 Balance at 1 January 127,663 147,254 80,582<br />
- - - Foreign exchange adjustment -1,930 -4,434 3,049<br />
0 0 0 Change of corporation tax rate -329 0 0<br />
0 0 0 Deferred tax for the year recognised in the income statement 3,580 -36,922 -29,970<br />
0 0 0 Deferred tax for the year recognised in the equity 0 0 15<br />
0 0 0 Adjustment, previous years in the income statement 18,294 -25,316 5,722<br />
0 0 0 Adjustment, previous years in the equity -24 0 0<br />
0 0 0 Deferred tax at 31 December, net 147,254 80,582 59,398<br />
Deferred tax is recognised in the balance sheet as:<br />
0 0 0 Deferred tax asset -75,174 -72,996 -102,642<br />
0 0 0 Deferred tax liability 222,428 153,578 162,040<br />
0 0 0 Deferred tax, net at 31 December 147,254 80,582 59,398<br />
Note 19 continued on the next page >>>
<strong>DFDS</strong> annual report 2009 NOTEs 85<br />
>>> Note 19 continued<br />
By joining the tonnage taxation scheme, <strong>DFDS</strong> A/S is subject to the requirements of the scheme until 2012. <strong>DFDS</strong> A/S is not expected to withdraw from the scheme and<br />
consequently no deferred tax relating to assets and liabilities subject to tonnage taxation has been recognised. If <strong>DFDS</strong> A/S withdraws from the tonnage taxation scheme,<br />
deferred tax in the amount of maximum DKK 418 million (2008: DKK 429 million, 2007: DKK 401 million) may crystallise.<br />
<strong>DFDS</strong> A/S has tax losses carried forward of DKK 333 million (2008: DKK 304 million, 2007: DKK 275 million) of which the tax base has not been recognised in the deferred<br />
tax. All taxable losses have no maturity date.<br />
The tax base of the tax losses carried forward is not recognised because of uncertainty regarding the outcome of a pending tax case regarding interpretation of the tonnage<br />
tax legislation.<br />
Consolidated<br />
DKK’000<br />
BALANCE AT<br />
1 JANUARY<br />
FOREIGN<br />
EXCHANGE<br />
ADJUSTMENT<br />
RECOGNISED IN<br />
THE INCOME<br />
STATEMENT<br />
RECOGNISED IN<br />
THE EQUITY<br />
ADJUSTMENT,<br />
PREVIOUS YEARS<br />
IN THE INCOME<br />
STATEMENT<br />
BALANCE AT<br />
31 DECEMBER<br />
2007<br />
Ships 173,540 -7,334 3,052 0 19,648 188,906<br />
Buildings, terminals and operating equipment 10,690 759 1,400 0 -2,791 10,058<br />
Provisions -57,925 4,670 -1,687 0 -1,141 -56,083<br />
Value of hedging instruments 328 0 0 0 0 328<br />
Tax losses carried forward -4,699 -4 569 -24 882 -3,276<br />
Other 5,729 -21 246 0 1,367 7,321<br />
127,663 -1,930 3,580 -24 17,965 147,254<br />
2008<br />
Ships 188,906 -24,342 -2,280 0 -31,350 130,934<br />
Buildings, terminals and operating equipment 10,058 402 2,754 0 2,989 16,203<br />
Provisions -56,083 12,752 2,212 0 1,892 -39,227<br />
Value of hedging instruments 328 0 -440 0 0 -112<br />
Tax losses carried forward -3,276 3,574 -22,238 0 425 -21,515<br />
Other 7,321 3,180 -16,930 0 728 -5,701<br />
147,254 -4,434 -36,922 0 -25,316 80,582<br />
2009<br />
Ships 130,934 9,765 -6,379 0 4,740 139,060<br />
Buildings, terminals and operating equipment 16,203 -57 164 0 -1,020 15,290<br />
Provisions -39,227 -2,954 -614 0 1,828 -40,967<br />
Value of hedging instruments -112 0 0 15 0 -97<br />
Tax losses carried forward -21,515 -1,497 -23,363 0 -2,370 -48,745<br />
Other -5,701 -2,208 222 0 2,544 -5,143<br />
80,582 3,049 -29,970 15 5,722 59,398<br />
Parent Company<br />
<strong>DFDS</strong> A/S has no deferred tax.
86 NOTEs<br />
<strong>DFDS</strong> annual report 2009<br />
Note 20<br />
Share options<br />
The decision to grant share options is made by the Board of Directors. In 1999 the Group established a share option scheme for the Executive Board and other<br />
executive employees. From 2005 share options have only been granted to the Executive Board. Each share option gives the holder of the option the right to acquire<br />
one existing share in the company of nominal DKK 100. The share option scheme equals a right to acquire 1.1% of the share capital (2008: 1.1%, 2007: 1.2%)<br />
if the remaining share options are exercised.<br />
Share options granted up to and including 2004 have been granted at an exercise price equal to the average share price of the Company’s shares of 10 banking<br />
days after the publication of the annual report with an addition of 10%. Share options granted in 2005 and 2006 have been granted at an exercise price equal to<br />
the average share price of the Company’s shares in December the year before the grant. Share options granted in 2007 have been granted at an exercise price<br />
equal to the average share price of the Company’s shares in December the year before the grant with an addition of 5%. Share options granted in 2008 and 2009<br />
have been granted at an exercise price equal to the average share price of the Company’s shares 5 days before the grant with an addition of 5%. Vesting is done on<br />
a straight line basis over a period of three years from the date of grant for share options granted in 2005 and 2006. Share options granted in 2007, 2008 and 2009<br />
are fully vested from the date of grant. Special conditions apply regarding illness and death and if the capital structure of the Company is changed, etc.<br />
The share options can be exercised when a minimum 3 years and a maximum of 5 years have elapsed since the grant dates. The options can only be exercised<br />
within a period of 4 weeks after publication of annual or interim reports.<br />
For share options granted in the years 2001 to 2003 the holder of the share option can choose between settlement in shares or cash settlement. Share options<br />
granted in 2004 and later can only be settled with shares. A part of the treasury shares is reserved for settling the outstanding share options.<br />
KONCERN<br />
EXECUTIVE<br />
BOARD<br />
NUMBER<br />
EXECUTIVE<br />
EMPLOYEES<br />
NUMBER<br />
TERMINATED<br />
EMPLOYEES<br />
NUMBER<br />
TOTAL<br />
NUMBER<br />
AVERAGE<br />
EXERCISE PRICE<br />
PER OPTION<br />
DKK<br />
AVERAGE FAIR<br />
VALUE PER<br />
OPTION<br />
DKK<br />
TOTAL FAIR<br />
VALUE<br />
DKK ‘000<br />
2007<br />
Outstanding at the beginning of the year 57,875 48,000 27,500 133,375 287.21 406.58 54,228<br />
Granted during the year 30,000 0 0 30,000 690.00 263.52 7,906<br />
Exercised during the year -17,875 -38,000 1 -7,500 -63,375 259.39 498.35 31,583<br />
Expired during the year 0 -2,000 0 -2,000 149.60 600.42 1,201<br />
Transferred between categories -30,000 0 30,000 0 449.00 410.47 12,314<br />
Outstanding at the end of the year 40,000 8,000 50,000 98,000 431.31 423.11 41,465<br />
Of this exercisable at the end of the year 0 8,000 0 8,000 232.25 565.31 4,522<br />
2008<br />
Outstanding at the beginning of the year 40,000 8,000 50,000 98,000 431.31 423.11 41,465<br />
Granted during the year 20,000 0 0 20,000 728.00 158.34 3,167<br />
Exercised during the year -10,000 0 -20,000 -30,000 277.00 110.29 3,309<br />
Expired during the year 0 -2,500 0 -2,500 162.40 629.61 1,574<br />
Outstanding at the end of the year 50,000 5,500 30,000 85,500 734.53 74.19 6,343<br />
Of this exercisable at the end of the year 0 5,500 0 5,500 264.00 120.55 663<br />
2009<br />
Outstanding at the beginning of the year 50,000 5,500 30,000 85,500 734.53 74.19 6,343<br />
Granted during the year 10,000 0 0 10,000 406.00 85.60 856<br />
Exercised during the year 0 -3,000 0 -3,000 264.00 46.91 141<br />
Expired during the year 0 -2,500 0 -2,500 264.00 46.91 117<br />
Transferred between categories -30,000 0 30,000 0 0.00 0.00 0<br />
Outstanding at the end of the year 30,000 0 60,000 90,000 563.56 28.44 2,560<br />
Of this exercisable at the end of the year 10,000 0 20,000 30,000 380.00 42.40 1,272<br />
1) Hereof 10.000 shares settled cash due to special conditions.<br />
Value after deduction of the exercise price of exercised share options for the Executive Board amounts to DKK 0.0 million (2008: DKK 2.2 million, 2007: 2.8 million)<br />
in both the Group and in the Parent Company.<br />
The average weighted price per share exercised in 2009 amounts to 337 (2008: 713, 2007: 757).<br />
The cost of the year related to share based payment is recognised in the Group’s and in the Parent Company’s income statement with DKK 0.8 million<br />
(2008: DKK 2.0 million, 2007: DKK 10.0 million).<br />
The weighted average fair value per share option (market price minus average exercise prise per option) is assessed at DKK -206.1 (2008: DKK -335.5, 2007: DKK 358.7).<br />
The calculated fair values are based on the Black-Scholes formula for measuring share options.<br />
The outstanding options at 31 December 2009 have an average weighted time to maturity of 2.4 years (2008: 2.5 years, 2007: 3.1 years).<br />
Share options granted during 2002 - 2003<br />
Recognised liabilities regarding share options with the option to choose between settlement in shares or cash as of 31 December 2009 amount to DKK 0.0 million (2008:<br />
DKK 0.0 million, 2007: DKK 1.6 million). At 31 December 2009 DKK 0.0 million (2008: DKK 0.0 million, 2007: DKK 1.6 million) can be exercised by the option holder.<br />
Share options granted in 2003 have an exercise price equal to DKK 162.40, and share options granted in 2002 have an exercise prise equal to DKK 149.60.<br />
Share options granted from 2004 and later<br />
The recognised value of share options with settlement in shares amounts to DKK 14.5 million (2008: DKK 13.8 million, 2007: DKK 13.6 million).<br />
Note 20 continued on the next page >>>
<strong>DFDS</strong> annual report 2009 NOTEs 87<br />
>>> Note 20 continued<br />
Assumptions concerning the calculation of fair value at time of granting:<br />
Year of grantinG<br />
EXERCISE<br />
PRICE<br />
MARKET<br />
PRICE AT<br />
GRANT DATE<br />
EXPECTED<br />
VOLATILITY<br />
RISK-FREE<br />
INTEREST RATE<br />
DIVIDEND<br />
PER SHARE<br />
EXPECTED<br />
TERM<br />
FAIR VALUE<br />
PER OPTION<br />
AT TIME<br />
OF GRANTING<br />
2004 264 264 22.38 % 3.54 % 6 5 years 46.91<br />
2005 277 359 21.49 % 2.77 % 6 5 years 110.29<br />
2006 380 396 21.18 % 3.23 % 7.5 5 years 85.74<br />
2007 690 800 23.53 % 3.90 % 7.5 5 years 263.52<br />
2008 728 703 25.57 % 4.13 % 15 5 years 158.34<br />
2009 406 380 31.28 % 2.86 % 10 5 years 85.60<br />
The expected volatility is based on the historic volatility for the past 36-60 months. The risk free interest rate is based on 5 year treasury bond.<br />
Note 21<br />
Pension and jubilee liabilities<br />
The Group contributes to defined contribution plans as well as defined benefit plans. The majority of the pension plans are funded through payments of annual premiums<br />
to independent insurance companies responsible for the pension obligation towards the employees (defined contribution plans). In these plans the Group has no<br />
legal or constructive obligation to pay further contributions irrespective of the funding of these insurance companies. Pension costs from such plans are charged to the<br />
income statement when incurred.<br />
In the United Kingdom the Group has pension plans, which are defined benefit plans and are included in the balance sheet as shown below. In addition there are<br />
minor defined benefit plans in Norway, Holland, Denmark and Sweden.<br />
Some of the pension plans in Sweden are multi-employer plans. The plans are collective and are covered through premiums paid to Alecta. The Swedish Financial Accounting<br />
Standards Council’s interpretations committee (Redovisningsrådet) has defined this plan as a multi-employer defined benefit plan. Presently, it is not possible<br />
to obtain sufficient information from Alecta to assess the plans as defined benefit plans. Consequently, the pension plans are treated as defined contribution plans. The<br />
contributions made amount to DKK 5.9 million (2008: DKK 5.1 million, 2007: DKK 6.3 million). The collective funding ration at Alecta amounts to 141% as per December<br />
2009 (December 2008:112%, December 2007: 152%). For 2010 the contributions are expected to amont to DKK 5.9 million. <strong>DFDS</strong>’ share of the multi-employer<br />
plan is 0.037% and the liability follows the share of the total plan.<br />
In the below the calculation of the defined benefit plans is specified in accordance with actuarial methods.<br />
Parent Company<br />
DKK ‘000<br />
Consolidated<br />
DKK ‘000<br />
2007 2008 2009 2007 2008 2009<br />
0 0 0 Present value of funded obligations 542,492 370,220 497,880<br />
0 0 0 Fair value of plan assets -432,368 -254,044 -333,920<br />
0 0 0 Remaining external coverage of funded obligations, net 110,124 116,176 163,960<br />
6,397 6,214 5,196 Present value of unfunded obligations 23,909 20,109 20,124<br />
0 0 0 Unrecognised actuarial gains and losses 83,963 24,671 -13,969<br />
6,397 6,214 5,196<br />
Recognised liabilities for defined benefit<br />
obligations at 31 December 217,996 160,956 170,115<br />
8,272 8,837 8,237 Provision for jubilee liabilities 8,727 9,284 8,780<br />
14,669 15,051 13,433 Total actuarial liabilities at 31 December 226,723 170,240 178,895<br />
Movements in the net liability for defined benefit<br />
funded and unfunded obligations<br />
8,098 6,397 6,214 Balance at 1 January 715,642 566,401 390,329<br />
- - - Foreign exchange adjustments -40,796 -117,108 33,729<br />
-824 453 -162 Current service costs 4,850 6,123 5,312<br />
0 0 0 Calculated interest rate on obligations 34,029 28,265 21,543<br />
0 0 0 Actuarial gain/loss on obligations, net -128,502 -74,040 84,066<br />
-877 -636 -856 Benefits paid -16,797 -18,545 -16,431<br />
0 0 0 Employee contributions -486 -767 -544<br />
0 0 0 Settlements and curtailments -1,539 0 0<br />
6,397 6,214 5,196 Funded and unfunded obligations at 31 December 566,401 390,329 518,004<br />
Movements in the defined benefit plan assets<br />
0 0 0 Balance at 1 January -448,787 -432,368 -254,044<br />
- - - Foreign exchange adjustments 31,307 81,143 -22,078<br />
0 0 0 Expected return on plan assets -25,430 -25,622 -17,320<br />
0 0 0 Actuarial gain/loss on plan assets, net 2,776 118,203 -38,738<br />
0 0 0 Employer and employee contributions -6,686 -11,386 -15,633<br />
0 0 0 Benefits paid 13,716 15,986 13,893<br />
0 0 0 Settlements and curtailments 736 0 0<br />
0 0 0 Plan assets at 31 December -432,368 -254,044 -333,920<br />
Note 21 continued on the next page >>>
88 NOTEs<br />
<strong>DFDS</strong> annual report 2009<br />
>>> Note 21 continued<br />
Parent Company<br />
DKK ‘000<br />
Consolidated<br />
DKK ‘000<br />
2007 2008 2009 2007 2008 2009<br />
Movements in unrecognised actuarial gains/losses<br />
0 0 0 Balance at 1 January -35,827 83,963 24,671<br />
- - - Foreign exchange adjustments -6,700 -12,137 2,005<br />
0 0 0 Actuarial gain/loss, net on funded and unfunded liabilities 128,502 74,040 -84,066<br />
0 0 0 Actuarial gain/loss, net on plan assets -2,776 -118,203 38,738<br />
0 0 0 Actuarial gain/loss, recognised in income statement 764 -2,992 4,683<br />
0 0 0 Unrecognised actuarial gains/losses at 31 December 83,963 24,671 -13,969<br />
Expenses recognised as staff costs in the income statement<br />
-824 453 -162 Current service costs 4,850 6,123 5,312<br />
0 0 0 Net actuarial gain/loss recognised (corridor) 764 -2,992 4,683<br />
-824 453 -162 5,614 3,131 9,995<br />
0 0 0 Gain/loss on settlements and curtailments -803 0 0<br />
-824 453 -162 Total included in staff costs regarding defined contribution plans 4,811 3,131 9,995<br />
Expenses recognised as financial expenses<br />
in the income statement<br />
0 0 0 Calculated interest rate on obligations 34,029 28,265 21,543<br />
0 0 0 Expected return on plan assets -25,430 -25,622 -17,320<br />
0 0 0<br />
-824 453 -162<br />
Total included in financial expenses regarding defined<br />
contribution plans 8,599 2,643 4,223<br />
Total expenses for defined benefit plans recognised<br />
in the income statement 13,410 5,774 14,218<br />
Actual return on plan assets in the Group’s plans amounts to DKK 56.1 million (2008: DKK -92.6 million, 2007: DKK 22.7 million). There are no plan assets<br />
in the Parent Company’s plans.<br />
The expected return on plan assets is assessed as a limited spread against the used discount rate for each plan.<br />
The Group expects to contribute DKK 14.6 million (expected for 2009: DKK 13.3 million, expected for 2008: DKK 12.3 million) to the defined benefit plans<br />
in 2010. The parent company expects to contribute DKK 0.9 million in 2010 (expected for 2009: DKK 0.4 million, expected for 2008: DKK 0.4 million).<br />
Plan assets consist of the following<br />
0 0 0 Listed shares (<strong>DFDS</strong> A/S shares not included) 340,131 172,484 236,842<br />
0 0 0 Bonds 82,186 64,770 77,573<br />
0 0 0 Cash and cash equivalents 0 4,191 66<br />
0 0 0 Properties 7,086 7,933 8,967<br />
0 0 0 Other assets 2,965 4,666 10,472<br />
0 0 0 432,368 254,044 333,920<br />
Defined benefit plans – assumptions 1)<br />
2.0 % 1.9 % 1.9 % Discount rate 5.5 % 5.3 % 5.4 %<br />
- - - Expected return on plan assets 6.4 % 6.2 % 6.3 %<br />
0.0 % 0.0 % 0.0 % Social security rate 0.8 % 0.9 % 0.7 %<br />
0.0 % 0.0 % 0.0 % Future salary increase 0.9 % 1.0 % 0.7 %<br />
0.9 % 0.8 % 0.8 % Future pension increase 3.4 % 2.6 % 3.2 %<br />
0.9 % 0.8 % 0.8 % Inflation 3.4 % 2.7 % 3.1 %<br />
1)<br />
All factors are weighted at the pro rata share of the individual actuarial obligation and the expected return on plan assets is weighted at the pro rata share<br />
of the individual plan asset.<br />
Note 21 continued on the next page >>>
<strong>DFDS</strong> annual report 2009 NOTEs 89<br />
>>> Note 21 continued<br />
2005 2006 2007 2008 2009<br />
The Group’s obligations for defined benefit plans<br />
for the past five years consists of the following:<br />
Present value of the defined benefit obligation -671,734 -715,642 -566,401 -390,329 -518,004<br />
Fair value of plan assets 401,149 448,787 432,368 254,044 333,920<br />
Deficit in the plan -270,585 -266,855 -134,033 -136,285 -184,084<br />
Experience adjustments arising on plan liabilities -6,987 -1,359 107,569 11,893 -24,553<br />
Experience adjustments arising on plan assets 38,237 21,845 1,757 -114,563 33,937<br />
The Parent Company’s obligations for defined benefit<br />
plans for the past five years consists of the following:<br />
Present value of the defined benefit obligation -9,099 -8,098 -6,397 -6,214 -5,196<br />
Experience adjustments arising on plan liabilities 0 0 0 0 0<br />
<strong>DFDS</strong>’s future obligations in the defined benefit plans can be influenced significantly by changes in the discount rate, the fair value of the plan assets and the expected<br />
return of these, the inflation, the future salary and pension increase, and demographic changes, such as the expected lifetime or other changes.<br />
Parent Company<br />
DKK ‘000<br />
Consolidated<br />
DKK ‘000<br />
2007 2008 2009 Note 22 Other provisions 2007 2008 2009<br />
2,610 2,610 0 Balance at 1 January 11,247 26,293 9,720<br />
0 0 0 Provisions made during the year 15,046 1,167 0<br />
0 -2,610 0 Used during the year 0 -6,010 -1,339<br />
0 0 0 Reversal of unused provisions 0 -11,730 -2,168<br />
2,610 0 0 Other provisions at 31 December 26,293 9,720 6,213<br />
Other provisions are expected to be payable in:<br />
2,610 0 0 0 - 1 year 25,168 9,720 6,213<br />
0 0 0 1 - 5 year 1,125 0 0<br />
2,610 0 0 Other provisions at 31 December 26,293 9,720 6,213<br />
Of the Group’s provision of DKK 6.2 million (2008: DKK 9.7 million, (2007: DKK 26.3 million)), DKK 0 million (2008: DKK 0.0 million, 2007: DKK 14.8 million) relate to costs<br />
incurred in connection with the sale of a ship, DKK 6.0 million (2008: DKK 8.2 million, 2007: DKK 7.0 million) relate to costs incurred in connection with a contamination issue,<br />
DKK 0 million (2008: DKK 0.0 million, 2007: DKK 2.6 million) relate to a terminated tenancy no longer in use and DKK 0.2 million (2008: DKK 1.5 million, 2007: DKK 1.9 million)<br />
relate to other provisions.<br />
The reversal of unused provisions amounting DKK 2.2 million in 2009 regards expected costs regarding a pollution case. The reversal of unused provisions amounting<br />
DKK 11.7 million in 2008 regards the sale of a ship in 2006.<br />
The Parent Company’s other provisions consist of DKK 0.0 million (2008: DKK 0.0 million, 2007: DKK 2.6 million) relating to a terminated tenancy no longer in use.<br />
Parent Company<br />
DKK ‘000<br />
Consolidated<br />
DKK ‘000<br />
2007 2008 2009 Note 23 Interest-bearing liabilities 2007 2008 2009<br />
2,526,157 1,929,419 2,507,579 Mortgage on ships 3,207,236 2,432,915 2,934,788<br />
12,561 0 0 Financial lease liabilities 51,237 20,098 48,839<br />
0 0 51,045 Owed to group enterprises - - -<br />
178,958 119,771 59,532 Bank loans 258,052 164,475 59,532<br />
38,073 19,108 0 Other non-current liabilities 128,250 107,143 30,562<br />
0 -42,500 0 Transferred to liabilities regarding assets held for sale 0 -42,500 0<br />
2,755,749 2,025,798 2,618,156 Total interest bearing non-current liabilities 3,644,775 2,682,131 3,073,721<br />
342,598 533,327 408,301 Mortgage on ships 565,851 722,520 469,159<br />
9,656 11,662 0 Financial lease liabilities 35,294 34,275 8,930<br />
527,869 840,493 466,033 Owed to group enterprises - - -<br />
59,653 178,565 500,097 Bank loans 69,675 212,435 581,701<br />
20,175 18,146 19,401 Other non-current liabilities 36,830 27,310 24,148<br />
0 -42,500 42,500 Transferred to/from liabilities regarding assets held for sale 0 -42,500 42,500<br />
959,951 1,539,693 1,436,332 Total interest bearing current liabilities 707,650 954,040 1,126,438<br />
3,715,700 3,565,491 4,054,488 Total interest bearing liabilities 4,352,425 3,636,171 4,200,159<br />
Note 23 continued on the next page >>>
90 NOTEs<br />
<strong>DFDS</strong> annual report 2009<br />
>>> Note 23 continued<br />
The fair value of the interest-bearing liabilities in the Group amounts to DKK 4,212 million (2008: DKK 3,636 million, 2007: DKK 4,352 million). The fair value of the<br />
interest-bearing liabilities in the Parent Company amounts to DKK 4,066 million (2008: DKK 3,565 million, 2007: DKK 3,716 million). The fair value of the financial liabilities<br />
is determined as the present value of expected future repayments and interest rates. The Group’s actual borrowing rate for equivalent terms are used as the discount rate.<br />
DKK 301 million of the interest-bearing liabilities in the Group fall due after five years (2008: DKK 926 million, 2007: DKK 1,462 million). DKK 150 million of the interest<br />
bearing liabilities in the Parent Company fall due after five years (2008: DKK 685 million, 2007: DKK 1,191 million).<br />
No exceptional conditions in connection with borrowing are made. The loan agreements can be settled at fair value plus a small surcharge.<br />
See Note 12 for assets pledged as securities and Note 28 for financial risks etc.<br />
Parent Company<br />
DKK ‘000<br />
Consolidated<br />
DKK ‘000<br />
2007 2008 2009 Allocation of currency, principal nominal amount 2007 2008 2009<br />
1,851,165 1,521,308 2,463,274 DKK 2,171,051 1,801,274 2,539,161<br />
1,269,271 1,540,182 1,119,846 EUR 1,069,014 1,051,789 1,094,974<br />
550,387 431,957 379,595 SEK 736,162 529,288 370,654<br />
51,652 42,455 37,896 NOK 351,843 227,707 151,129<br />
0 28,961 46,412 GBP 24,355 26,113 43,107<br />
558 0 2,227 USD 0 0 2,163<br />
-7,333 628 6,267 LTL 1 0 0 0<br />
0 0 -1,029 Other 1 0 0 -1,029<br />
3,715,700 3,565,491 4,054,488 Total interest bearing liabilities 4,352,425 3,636,171 4,200,159<br />
1) The Parent Company has a right of set-off against the individual group enterprises. As a consequence of this, negative liabilities for the individual currency is possible.<br />
Parent Company<br />
DKK ‘000<br />
Consolidated<br />
DKK ‘000<br />
2007 2008 2009 Note 24 Other payables 2007 2008 2009<br />
9,981 9,071 16,624 Amounts owed to group enterprises - - -<br />
0 2,161 0 Amounts owed to associates 121 2,546 4,032<br />
40,585 30,870 23,731 Accrued interests 53,070 36,970 27,850<br />
7,098 11,271 4,622 Public authorities 57,457 41,072 43,860<br />
97,126 76,525 80,218 Holiday pay obligations, etc. 132,237 116,351 118,305<br />
1,574 0 0 Share based payments, cash-settled 1,574 0 0<br />
28,531 146,510 80,036 Derivative financial instruments, forward transactions and bunker hedges 28,931 147,805 80,148<br />
154,999 171,413 177,555 Other, primarily payables 330,907 323,847 373,787<br />
339,894 447,821 382,786 Total other payables 604,297 668,591 647,982<br />
Parent Company<br />
DKK ‘000<br />
Consolidated<br />
DKK ‘000<br />
2007 2008 2009 Note 25 Deferred income 2007 2008 2009<br />
29,437 24,579 28,552 Prepayments from customers 72,132 64,936 68,570<br />
0 0 0 Other deferred income 11,039 5,604 4,914<br />
29,437 24,579 28,552 Total other payables 83,171 70,540 73,484
<strong>DFDS</strong> annual report 2009 NOTEs 91<br />
Parent Company<br />
DKK ‘000<br />
Consolidated<br />
DKK ‘000<br />
2007 2008 2009 Note 26 Corporation tax 2007 2008 2009<br />
0 0 0 Balance at 1 January 16,585 8,794 17,258<br />
- - - Foreign exchange adjustment 181 -1,690 426<br />
0 0 0 Tax for the year recognised in the income statement 26,128 24,515 23,795<br />
0 0 0 Adjustment, previous years in the income statement 66,423 5,578 -68,670<br />
0 0 0 Corporation taxes paid in the year -19,575 -23,726 -25,056<br />
0 0 0 Transferred to liabilities related to assets held for sale -134 0 0<br />
- - - Transferred to other interest-bearing liabilities -80,814 3,787 70,324<br />
0 0 0 Corporation tax at 31 December 8,794 17,258 18,077<br />
Corporation tax recognised in the balance sheet<br />
0 0 0 Current corporation tax receivables 13,722 6,515 8,307<br />
0 0 0 Current corporation tax 22,516 23,773 26,384<br />
0 0 0 Total corporation tax 8,794 17,258 18,077<br />
New tonnage tax regulations in Norway<br />
The Norwegian government has passed an act on a new regulation of tonnage tax for taxation of Norwegian shipping companies. The new act is effective as of 2007.<br />
2007<br />
The transitional provisions for the new regulation imply taxation of untaxed equity (result) generated under the existing system for taxation of shipping companies recognised<br />
by the end of 2006. Based on the approved act calculations show a tax cost of DKK 104.6 million for <strong>DFDS</strong>. The discounted value of this amounts to DKK 80.8 million,<br />
which has been recognised in the income statement for 2007. Provisions to use 1/3 of the amount for environmental improvements latest in 2016 are available, of which<br />
unutilised amounts must be paid as taxes in 2016.<br />
The tax must be paid evenly over the next 10 years with annually 1/10 of 2/3 of the total amount. The total annual cash flow effect is estimated to be lower, as the Norwegian<br />
tax payables are anticipated to be reduced as a consequence of the new Norwegian tonnage tax.<br />
2009<br />
The deadline for using 1/3 of the amount for environmental improvements has been removed. Therefore there is no longer basis for recognising this part in non-current<br />
liabilities. Reversal of this reduces the non-current liabilities NOK 19.9 million. The reversal is recognised in the income statement as an adjustment to previous years tax.<br />
It is instead reported as a contingent liability, see Note 36.<br />
On 12 February 2010 the Supreme Court in Norway made the decision that the charge of tax concerning the transition to the new regulation of tonnage tax in 2007<br />
was against the Norwegian constitution. As a result of this the recognised corporation tax is reversed and the paid instalments can be recovered. Therefore the paid instalments<br />
are recognised in the income statement as ’adjustment of tax related to previous years’ and is recognised as other receivables.<br />
Parent Company<br />
DKK ‘000<br />
Consolidated<br />
DKK ‘000<br />
2007 2008 2009 Note 27 Information on financial instruments 2007 2008 2009<br />
Carrying amount per category of financial instruments<br />
19,499 28,259 10,892 Financial assets used for hedge 24,445 28,259 10,892<br />
1,740,754 1,514,974 2,363,985 Loans and receivables (assets) 1,496,561 1,147,943 989,091<br />
24,488 16,157 28,835 Financial assets available for sale 25,808 17,453 30,094<br />
-47,836 -119,382 -76,492 Financial liabilities used for hedge -49,374 -148,989 -80,148<br />
-4,168,705 -4,067,847 -4,446,093 Financial liabilities measured at amortised cost -5,326,222 -4,549,090 -5,083,006<br />
-2,431,800 -2,627,839 -2,118,873 Total -3,828,782 -3,504,424 -4,133,077<br />
Note 27 continued on the next page >>>
92 NOTEs<br />
<strong>DFDS</strong> annual report 2009<br />
>>> Note 27 continued<br />
Fair value hierarchy of financial instruments<br />
The table below analyses financial instruments carried at fair value, by valuation method. The different levels have been defined as follows:<br />
Level 1: quoted prices (unadjusted) in active markets for identical assets or liabilities<br />
Level 2: inputs other than quoted prices included within Level 1 that are observable for the asset or liability, either directly (i.e., as prices) or indirectly (i.e., derived from prices)<br />
Level 3: inputs for the asset or liability that are not based on observable market data (unobservable inputs)<br />
The Group<br />
DKK ‘000 Level 1 Level 2 Level 3 TOTAL<br />
2007<br />
Financial assets used for hedge 24,445 24,445<br />
Financial assets available for sale 14,266 11,542 25,808<br />
Financial liabilities used for hedge -49,374 -49,374<br />
Total 14,266 -24,929 11,542 879<br />
2008<br />
Financial assets used for hedge 28,259 28,259<br />
Financial assets available for sale 5,810 11,643 17,453<br />
Financial liabilities used for hedge -148,989 -148,989<br />
Total 5,810 -120,730 11,643 -103,277<br />
2009<br />
Financial assets used for hedge 10,892 10,892<br />
Financial assets available for sale 10,375 19,719 30,094<br />
Financial liabilities used for hedge -80,148 -80,148<br />
Total 10,375 -69,256 19,719 -39,162<br />
Parent Company<br />
DKK ‘000 Level 1 Level 2 Level 3 TOTAL<br />
2007<br />
Financial assets used for hedge 19,499 19,499<br />
Financial assets available for sale 14,266 10,222 24,488<br />
Financial liabilities used for hedge -47,836 -47,836<br />
Total 14,266 -28,337 10,222 -3,849<br />
2008<br />
Financial assets used for hedge 28,259 28,259<br />
Financial assets available for sale 5,810 10,347 16,157<br />
Financial liabilities used for hedge -119,382 -119,382<br />
Total 5,810 -91,123 10,347 -74,966<br />
2009<br />
Financial assets used for hedge 10,892 10,892<br />
Financial assets available for sale 10,375 18,460 28,835<br />
Financial liabilities used for hedge -76,492 -76,492<br />
Total 10,375 -65,600 18,460 -36,765<br />
Financial assets and liabilities used for hedge are all measured at level 2. See note 28 for description of the valuation method.<br />
Financial assets available for sale measured at level 1 are listed shares and is measured at the quoted prices. Financial assets available for sale measured at level 3 consist of<br />
other shares and equity investments as well as other investments (some minor unlisted enterprises and holdings). They are measured at cost reduced by write-downs, if any.
<strong>DFDS</strong> annual report 2009 NOTEs 93<br />
Note 28<br />
Financial and operational risks<br />
<strong>DFDS</strong>’ risk management policy<br />
The most important financial risk factors for <strong>DFDS</strong> are oil, currency, interest rate, investments and liquidity. It is the policy of the Group not to enter into active speculation<br />
in financial risks. The intention of the financial risk management of the Group is only to manage the financial risks attached to operational and financing activities. The Group<br />
uses forward exchange contracts and currency options to hedge forecasted transactions in foreign currencies. Furthermore, the Group uses interest-rate swaps to hedge the<br />
forecasted transactions related to interest transactions as well as forward oil contracts to hedge the forecasted oil transactions. The Board of Directors annually approves the<br />
financial risk management policy and strategy.<br />
Financial risks<br />
Currency risks<br />
Financial currency risks arise from net investments in foreign companies (translation risks) and from other investments or liabilities denominated in foreign currencies (transactions<br />
risks). Currency risks are monitored continuously throughout the year to ensure compliance with the financial risk management policy. <strong>DFDS</strong> actively seeks to reduce<br />
currency exposure by matching the currencies, obtaining multi currency loans and by directing all currency balance positions towards the Parent Company (the transaction risk)<br />
if possible.<br />
Transaction risks<br />
The Group’s and the Parent Company’s most substantial currency balance position is in SEK. A fall of 10% in SEK compared to the level at year-end 2009 would have meant a decreased<br />
value for the Group and the Parent Company of DKK 52.0 million in 2009 (2008: DKK 22.7 million, 2007: DKK 17.5 million). A raise would have had a similar positive effect on<br />
the balance position.<br />
A strengthening of DKK, as indicated below, against the SEK, GBP and NOK at 31 December would have increased (decreased) equity and profit or loss by the amounts shown below.<br />
This analysis is based on foreign currency exchange rate variances that the Group considered to be reasonably possible at the end of the reporting period. The analysis assumes that all<br />
other variables, in particular interest rates, remain constant. The analysis is performed on the same basis for 2008 and 2007. As all subsidiaries are operating in there one base currency<br />
no effect will occur on the equity. Hedge is done in the Parent Company. Both the parent company and subsidiaries within the <strong>DFDS</strong> Group are exposed against fluctuations in EUR<br />
vs. DKK. However, due to Denmark’s fixed exchange rate regime where the Danish Krone is pegged to the Euro, this is considered an insignificant currency exposure.<br />
Parent Company<br />
DKK ‘000<br />
Consolidated<br />
DKK ‘000<br />
2007 2008 2009 2007 2008 2009<br />
Hypothetical effect of reasonable possible<br />
change against DKK<br />
0 1.3 0 SEK, equity effect, 10% strengthening (2008: 10%, 2007: 10%) 0 1.3 0<br />
25.4 48.2 84.9 SEK, profit or loss effect, 10% strengthening (2008: 10%, 2007: 10%) 25.4 48.2 84.9<br />
0 0 0 GBP, equity effect, 10% strengthening (2008: 10%, 2007: 10%) 0 0 0<br />
3.1 2.1 0.6 GBP, profit or loss effect, 10% strengthening (2008: 10%, 2007: 10%) 3.1 2.1 0.6<br />
2.1 0 0 NOK, equity effect, 10% strengthening (2008: 10%, 2007: 10%) 2.1 0 0<br />
-5.3 -4.4 21.1 NOK, profit or loss effect, 10% strengthening (2008: 10%, 2007: 10%) -5.3 -4.4 21.1<br />
A weakening would have had the opposite effect on equity and profit or loss with the same amount.<br />
The sensitivity analysis on currency risk has been prepared under the assumptions that the effect is calculated on the balance sheet items at the balance sheet date; the included<br />
hedges are 100% effective and based on the actual market situation and expectations to the development in the currencies.<br />
Translation risks<br />
Translation risks relate to translation of the profit and equity of foreign group enterprises into DKK. These risks are to some extent covered by loans in the respective foreign currencies.<br />
Derivatives are not used to hedge translation risks.<br />
The Group’s most substantial translation risks are SEK and NOK. A fall in these currencies of 10% compared to the level at year-end 2009 would have meant a value decrease for SEK of<br />
DKK 52.1 million in 2009 (2008: DKK -4.9 million, 2007: DKK -3.0 million) and for NOK a value decrease of DKK 39.2 million in 2009 (2008: DKK -34.8 million, 2007: DKK -33.7 million).<br />
Interest rate risks<br />
<strong>DFDS</strong> is primarily exposed to interest rate risks through the loan portfolio (interest-bearing debt less the short-term bank debts and other debts). The intention of the interest rate<br />
risk management is to limit the negative effects of interest rate fluctuation on the earnings. It is <strong>DFDS</strong>’ strategy that a minimum of 50% of the loan portfolio must be fixed-rate loans in<br />
view of contracted interest rate swaps etc. The total interest-bearing debt of the Group amounts to DKK 4,200 million at year-end 2009 (2008: DKK 3,721, 2007: DKK 4,352 million),<br />
of which the floating-rate debt amounts to DKK 2,690 million at year-end 2009 (2008: DKK 1,631 million, 2007: DKK 1,929 million). Thereby the fixed interest-bearing debt share is<br />
37% at year-end 2009 (2008: 56%, 2007: 56%) including the effect of interest rate swaps etc.<br />
An increase in the interest rate of 1%-point compared to the actual interest rate in 2009 would, other things being equal, have increased net interest payments about DKK 24 million<br />
for the Group in 2009 (2008: DKK 18 million, 2007: DKK 20 million). The effect on the Parent Company would have been DKK 27 million in 2009 (2008: DKK 18 million, 2007: DKK 19<br />
million). A decrease in the interest rate would have had the equivalent positive effect.<br />
The total interest-bearing debt except bank overdrafts had an average time to maturity of 3.7 years (2008: 4.6 years, 2007: 5.2 years), and consists primarily of syndicated floating-rate<br />
bank loans with security in the ships. The financing is obtained at market rate with addition of a marginal rate reflecting <strong>DFDS</strong>’ financial strength. As part of the financial strategies in<br />
<strong>DFDS</strong> interest rate swaps with a principal amount totalling DKK 1,351 million (2008: DKK 1,844 million, 2007: DKK 2,143 million) have been entered in partial change from floatingrate<br />
bank loans to fixed-rate bank loans.<br />
An increase in the interest rate of 1%-point compared to the actual interest rate at balance sheet date would, other things being equal, have had a hypothetical effect on the equity reserve for<br />
cash flow hedge of DKK 23 million (2008: DKK 48 million, 2007: DKK 50 million). This is due to the interest rate swaps entered to hedge variable interest rate loans. A decrease in the interest<br />
rate would have had a similar negative effect. The sensitivity analysis is based on the assumption that the effectiveness of the included hedges will stay unaffected by the change in the interest rate.<br />
Note 28 continued on the next page >>>
94 NOTEs<br />
<strong>DFDS</strong> annual report 2009<br />
>>> Note 28 continued<br />
Consolidated 2007<br />
Principal amount/outstanding debt at<br />
Category 31/12/07 31/12/08 31/12/10 31/12/12<br />
Mortgages on ships 3,773,088 3,207,236 2,030,941 1,418,134<br />
Bank loans 327,726 258,052 59,653 0<br />
Other interest-bearing loans 165,080 128,250 90,932 43,946<br />
Financial lease liabilities 86,531 51,237 0 0<br />
Interest-bearing liabilities 4,352,425 3,644,775 2,181,526 1,462,080<br />
Financial lease liabilities, fixed interest rate -86,531 -51,237 0 0<br />
Mortgages on ships, fixed interest rate -97,135 -82,781 -54,073 -25,365<br />
Other liabilities, fixed interest rate -97,368 -85,130 -66,484 -58,441<br />
Interest swap, (principal amount), fixed rate, (interest paid) -2,142,845 -1,856,692 -986,376 -597,759<br />
Loans with floating interest rates 1,928,546 1,568,935 1,074,593 780,515<br />
Consolidated 2008<br />
Principal amount/outstanding debt at<br />
Category 31/12/08 31/12/09 31/12/11 31/12/13<br />
Mortgages on ships 3,155,435 2,432,915 1,701,786 861,754<br />
Bank loans 252,441 164,475 0 0<br />
Bank overdrafts 124,469 0 0 0<br />
Other interest-bearing loans 134,453 107,143 74,676 63,878<br />
Financial lease liabilities 54,373 20,098 0 0<br />
Interest-bearing liabilities 3,721,171 2,724,631 1,776,462 925,632<br />
Financial lease liabilities, fixed interest rate -54,373 -20,098 0 0<br />
Mortgages on ships, fixed interest rate -82,714 -68,372 -39,687 -11,002<br />
Other fixed-interest liabilities -108,817 -81,501 -47,978 -39,104<br />
Interest swap, (principal amount), fixed rate, (interest paid) -1,844,358 -1,333,924 -851,998 -398,254<br />
Loans with floating interest rates 1,630,909 1,220,736 836,799 477,272<br />
Consolidated 2009<br />
Principal amount/outstanding debt at<br />
Category 31/12/09 31/12/10 31/12/12 31/12/14<br />
Mortgages on ships 3,446,447 2,934,788 1,398,712 257,687<br />
Bank loans 184,031 59,532 0 0<br />
Bank overdrafts 457,202 0 0 0<br />
Other interest-bearing loans 54,710 30,562 58,030 43,292<br />
Financial lease liabilities 57,769 48,839 30,040 0<br />
Interest-bearing liabilities 4,200,159 3,073,721 1,486,782 300,979<br />
Financial lease liabilities, fixed interest rate -57,768 -48,838 -30,040 0<br />
Mortgages on ships, fixed interest rate -68,289 -53,972 -25,318 0<br />
Other fixed-interest liabilities -76,913 -47,353 -30,288 -18,921<br />
Interest swap, (principal amount), fixed rate, (interest paid) -1,350,659 -1,001,220 -663,235 -93,154<br />
Loans with floating interest rates 2,646,530 1,922,338 737,901 188,904<br />
Note 28 continued on the next page >>>
<strong>DFDS</strong> annual report 2009 NOTEs 95<br />
>>> Note 28 continued<br />
PArent company 2007<br />
Principal amount/outstanding debt at<br />
Category 31/12/07 31/12/08 31/12/10 31/12/12<br />
Mortgages on ships 2,868,755 2,526,157 1,640,963 1,190,767<br />
Bank loans 238,611 178,958 59,653 0<br />
Debt to group enterprises 527,869 0 0 0<br />
Other interest-bearing loans 58,248 38,073 0 0<br />
Financial lease liabilities 22,217 12,561 0 0<br />
Interest-bearing liabilities 3,715,700 2,755,749 1,700,616 1,190,767<br />
Financial lease liabilities, fixed interest rate -22,217 -12,561 0 0<br />
Other fixed-interest liabilities -16,554 -11,292 0 0<br />
Interest swap, (principal amount), fixed rate, (interest paid) -1,861,200 -1,610,092 -907,876 -597,759<br />
Loans with floating interest rates 1,815,729 1,121,804 792,740 593,008<br />
PArent company 2008<br />
Principal amount/outstanding debt at<br />
Category 31/12/08 31/12/09 31/12/11 31/12/13<br />
Mortgages on ships 2,462,746 1,929,419 1,380,234 685,028<br />
Bank loans 179,376 119,771 0 0<br />
Bank overdrafts 118,959 0 0 0<br />
Debt to group enterprises 840,494 0 0 0<br />
Other interest-bearing loans 37,254 19,108 0 0<br />
Financial lease liabilities 11,662 0 0 0<br />
Interest-bearing liabilities 3,650,491 2,068,298 1,380,234 685,028<br />
Financial lease liabilities, fixed interest rate -11,662 0 0 0<br />
Other fixed-interest liabilities -37,260 -19,108 0 0<br />
Interest swap, (principal amount), fixed rate, (interest paid) -1,614,495 -1,164,263 -786,298 -398,254<br />
Loans with floating interest rates 1,987,074 884,927 593,936 286,774<br />
PArent company 2009<br />
Principal amount/outstanding debt at<br />
Category 31/12/09 31/12/10 31/12/12 31/12/14<br />
Mortgages on ships 2,958,380 2,507,579 1,174,295 149,614<br />
Bank loans 119,626 59,532 0 0<br />
Bank overdrafts 440,003 0 0 0<br />
Debt to group enterprises 536,479 51,045 0 0<br />
Interest-bearing liabilities 4,054,488 2,618,156 1,174,295 149,614<br />
Interest swap, (principal amount), fixed rate, (interest paid) -1,174,963 -922,720 -663,235 -93,154<br />
Loans with floating interest rates 2,879,525 1,695,436 511,060 56,460<br />
Oil risks<br />
Financial oil risks in the <strong>DFDS</strong> Group are caused by oil swaps used to hedge bunker costs.<br />
An increase in the oil price of 10%-point compared to the actual oil price at balance sheet date would, other things being equal, have had a hypothetical positive effect on<br />
the equity reserve for cash flow hedge of DKK 2.8 million (2008: DKK 8.5 million, 2007: DKK 0 million). This is due to the oil contracts for future delivery entered to hedge<br />
the cost for bunkers. A decrease in the oil price would have had a similar negative effect.<br />
The sensitivity analysis on oil contracts has been prepared under the assumptions that the effect is calculated on the oil contracts entered at the balance sheet date; the<br />
hedges are 100% effective and based on the actual market situation and expectations to the development in the oil prices.<br />
Note 28 continued on the next page >>>
96 NOTEs<br />
<strong>DFDS</strong> annual report 2009<br />
>>> Note 28 continued<br />
Liquidity risks<br />
<strong>DFDS</strong> aims to maintain a minimum cash resource of DKK 300 million, which is regarded as sufficient for the current operation. The cash resources are managed at Group<br />
level, and 12-months rolling cash forecasts are prepared on a monthly basis. The cash resources at 31 December 2009 is DKK 466 million (2008: DKK 913 million, 2007:<br />
DKK 1,181 million). The central treasury department manages excess liquidity and cash resources. Cash at bank and in hand are primarily placed in the short money<br />
market and due to banks are drawn mostly on money market lines.<br />
The following are the contractual maturities of financial liabilities, including estimated interest payments and excluding the impact of netting agreements:<br />
Consolidated<br />
(DKK ‘000)<br />
CARRYING<br />
AMOUNT<br />
CONTRACTUAL<br />
CASH FLOW<br />
1 YEAR<br />
OR LESS 1-3 YEARS 3-5 YEARS<br />
MORE THAN<br />
5 YEARS<br />
2007<br />
Non-derivative financial assets<br />
Liquidity in banks 104,952 104,952 104,952 0 0 0<br />
Non-derivative financial liabilities<br />
Mortgages on ships -3,773,088 -4,065,594 -699,662 -1,129,014 -731,076 -1,505,842<br />
Bank loans -327,726 -350,991 -89,389 -201,016 -60,586 0<br />
Other interest-bearing loans -165,080 -176,864 -41,558 -83,220 -18,514 -33,572<br />
Financial lease liabilities -86,531 -93,528 -36,519 -57,009 0 0<br />
Trade and other payables -411,484 -411,484 -411,484 0 0 0<br />
Derivative financial assets<br />
Interest swaps 21,602 28,049 8,279 12,454 5,566 1,750<br />
Forward exchange contracts used for hedging 2,843 2,843 2,778 65 0 0<br />
Derivative financial liabilities<br />
Interest swaps -33,244 -41,860 -8,471 -14,448 -11,352 -7,589<br />
Forward exchange contracts used for hedging -16,130 -16,130 -16,130 0 0 0<br />
-4,683,886 -5,020,607 -1,187,204 -1,472,188 -815,962 -1,545,253<br />
2008<br />
Non-derivative financial assets<br />
Liquidity in banks 87,409 87,409 87,409 0 0 0<br />
Non-derivative financial liabilities<br />
Mortgages on ships -3,155,435 -3,614,317 -886,864 -828,491 -974,066 -924,896<br />
Bank loans -252,441 -262,190 -94,566 -167,624 0 0<br />
Bank overdrafts -124,469 -124,469 -124,469 0 0 0<br />
Other interest-bearing loans -134,453 -160,561 -50,123 -40,694 -13,120 -56,624<br />
Financial lease liabilities -54,373 -57,009 -35,341 -21,668 0 0<br />
Trade and other payables -308,317 -308,317 -308,317 0 0 0<br />
Derivative financial assets<br />
Interest swaps 1,257 1,998 3,640 -1,642 0 0<br />
Forward exchange contracts used for hedging 27,002 27,002 27,002 0 0 0<br />
Derivative financial liabilities<br />
Interest swaps -69,495 -110,188 -20,950 -61,675 -22,852 -4,711<br />
Forward exchange contracts used for hedging -44,022 -44,022 -44,022 0 0 0<br />
Oil contracts -35,472 -35,472 -35,472 0 0 0<br />
-4,062,809 -4,600,136 -1,482,073 -1,121,794 -1,010,038 -986,231<br />
Note 28 continued on the next page >>>
<strong>DFDS</strong> annual report 2009 NOTEs 97<br />
>>> Note 28 continued<br />
Consolidated<br />
(DKK ‘000)<br />
CARRYING<br />
AMOUNT<br />
CONTRACTUAL<br />
CASH FLOW<br />
1 YEAR<br />
OR LESS 1-3 YEARS 3-5 YEARS<br />
MORE THAN<br />
5 YEARS<br />
2009<br />
Non-derivative financial assets<br />
Liquidity in banks 8,529 8,529 8,529 0 0 0<br />
Non-derivative financial liabilities<br />
Mortgages on ships -3,446,447 -3,832,301 -649,578 -1,684,523 -1,224,704 -273,496<br />
Bank loans -184,031 -187,065 -126,551 -60,514 0 0<br />
Bank overdrafts -457,202 -457,202 -457,202 0 0 0<br />
Other interest-bearing loans -54,710 -56,491 -24,397 -3,279 1,324 -30,139<br />
Financial lease liabilities -57,768 -67,991 -12,172 -24,343 -31,476 0<br />
Trade and other payables -315,013 -315,013 -315,013 0 0 0<br />
Derivative financial assets<br />
Forward exchange contracts used for hedging 472 472 472 0 0 0<br />
Oil contracts 10,420 10,420 10,420 0 0 0<br />
Derivative financial liabilities<br />
Interest swaps -78,401 -93,667 -40,051 -39,209 -13,844 -563<br />
Forward exchange contracts used for hedging -1,747 -1,747 -1,747 0 0 0<br />
-4,575,898 -4,992,056 -1,607,290 -1,811,868 -1,268,700 -304,198<br />
Parent Company<br />
(DKK ‘000)<br />
CARRYING<br />
AMOUNT<br />
CONTRACTUAL<br />
CASH FLOW<br />
1 YEAR<br />
OR LESS 1-3 YEARS 3-5 YEARS<br />
MORE THAN<br />
5 YEARS<br />
2007<br />
Non-derivative financial assets<br />
Liquidity in banks 104,952 104,952 104,952 0 0 0<br />
Non-derivative financial liabilities<br />
Mortgages on ships -2,868,755 -3,305,192 -504,769 -751,254 -543,327 -1,505,842<br />
Bank loans -238,611 -259,015 -74,082 -124,347 -60,586 0<br />
Other interest-bearing loans -58,248 -97,467 -22,972 -40,923 0 -33,572<br />
Financial lease liabilities -22,217 -28,523 -14,850 -13,673 0 0<br />
Trade and other payables -160,749 -160,749 -160,749 0 0 0<br />
Derivative financial assets<br />
Interest swaps 17,505 24,077 7,192 10,310 4,825 1,750<br />
Forward exchange contracts used for hedging 1,994 1,994 1,994 0 0 0<br />
Derivative financial liabilities<br />
Interest swaps -32,953 -41,410 -8,273 -14,196 -11,352 -7,589<br />
Forward exchange contracts used for hedging -14,883 -14,883 -14,883 0 0 0<br />
-3,271,965 -3,776,216 -686,440 -934,083 -610,440 -1,545,253<br />
Note 28 continued on the next page >>>
98 NOTEs<br />
<strong>DFDS</strong> annual report 2009<br />
>>> Note 28 continued<br />
Parent Company<br />
(DKK ‘000)<br />
CARRYING<br />
AMOUNT<br />
CONTRACTUAL<br />
CASH FLOW<br />
1 YEAR<br />
OR LESS 1-3 YEARS 3-5 YEARS<br />
MORE THAN<br />
5 YEARS<br />
2008<br />
Non-derivative financial assets<br />
Liquidity in banks 87,409 87,409 87,409 0 0 0<br />
Non-derivative financial liabilities<br />
Mortgages on ships -2,462,746 -2,801,705 -624,992 -645,291 -802,866 -728,556<br />
Bank loans -179,376 -217,198 -94,566 -122,632 0 0<br />
Bank overdrafts -118,959 -118,959 -118,959 0 0 0<br />
Other interest-bearing loans -37,254 -40,923 -20,342 -20,581 0 0<br />
Financial lease liabilities -11,662 -13,673 -13,673 0 0 0<br />
Trade and other payables -88,917 -88,917 -88,917 0 0 0<br />
Derivative financial assets<br />
Interest swaps 1,257 1,998 3,640 -1,642 0 0<br />
Forward exchange contracts used for hedging 27,002 27,002 27,002 0 0 0<br />
Derivative financial liabilities<br />
Interest swaps -65,355 -104,657 -20,320 -57,242 -22,384 -4,711<br />
Forward exchange contracts used for hedging -18,555 -18,555 -18,555 0 0 0<br />
Oil contracts -35,472 -35,472 -35,472 0 0 0<br />
-2,902,628 -3,323,650 -917,745 -847,388 -825,250 -733,267<br />
2009<br />
Non-derivative financial assets<br />
Liquidity in banks 8,529 8,529 8,529 0 0 0<br />
Non-derivative financial liabilities<br />
Mortgages on ships -2,958,380 -3,101,222 -502,476 -1,214,745 -1,224,704 -159,297<br />
Bank loans -119,626 -122,298 -61,784 -60,514 0 0<br />
Bank overdrafts -440,003 -440,003 -440,003 0 0 0<br />
Other interest-bearing loans -19,401 -20,403 -20,403 0 0 0<br />
Trade and other payables -85,311 -85,311 -85,311 0 0 0<br />
Derivative financial assets<br />
Forward exchange contracts used for hedging 472 472 472 0 0 0<br />
Oil contracts 10,420 10,420 10,420 0 0 0<br />
Derivative financial liabilities<br />
Interest swaps -74,745 -88,590 -36,602 -37,581 -13,844 -563<br />
Forward exchange contracts used for hedging -1,747 -1,747 -1,747 0 0 0<br />
-3,679,792 -3,840,153 -1,128,905 -1,312,840 -1,238,548 -159,860<br />
Assumptions for the maturity table:<br />
The maturity analysis is based on undiscounted cash flows including estimated interest payments. Interest payments are estimated based on existing market conditions.<br />
The undiscounted cash flows related to derivative financial liabilities are presented at gross amounts unless the parties according to the contract have a right or obligation<br />
to settle at net amount.<br />
Credit risks<br />
<strong>DFDS</strong>’s primary financial assets are trade receivables, other receivables, cash at bank and in hand and derivative financial instruments..<br />
The credit risk is primarily attributable to trade receivables and other receivables.<br />
The amounts in the balance sheet are stated net of reservation for bad debts, which has been estimated based on a specific assessment of the present economic situation.<br />
<strong>DFDS</strong>’s risks regarding trade receivables are not considered unusual and no material risk is attached to a single customer or cooperative partner. According to the Group’s<br />
policy of undertaking credit risks, current credit ratings of all major customers and other cooperative partners are performed. A few customers have provided guarantees<br />
for payment. These guarantees constitutes totally DKK 3.3 million in 2009 (2008: DKK 62.5 million, 2007: 4,4 million). Besides the reservations mentioned in Note 15 no<br />
other reservations on receivables have been done and no insurance cover has been taken out on any of the receivables.<br />
The credit risk of cash at bank and in hand and derivative financial instruments is limited, because <strong>DFDS</strong> and 100% owned group enterprises uses financial partners, which<br />
at a minimum have a solid credit rating (P-1 from Moody’s). The financial partners are monitored continuously throughout the year.<br />
Note 28 continued on the next page >>>
<strong>DFDS</strong> annual report 2009 NOTEs 99<br />
>>> Note 28 continued<br />
Capital management<br />
The Group continuously assesses the need for adjustment of the capital structure to balance the required rate of return on equity against the increased uncertainty<br />
connected with loan capital. The equity’s share of the total liabilities totals 39% at year-end 2009 (2008: 40%, 2007: 38%). The aim is to have an equity ratio of around 40%.<br />
The Group’s cost of capital for 2009 was calculated at 7% (2008:7%, 2007: 7%) and the return on invested capital achieved was 2.2% (2008: 6.1%, 2007: 8.6%).<br />
The Group’s dividend policy is to distribute around 30% of the <strong>DFDS</strong> shareholders’ share of the Group’s profits, however, taking into consideration any significant<br />
investments. Proposed dividends for 2009 amount to DKK 0.00 per share equal to 0.0% of the profits (2008: DKK 0 per share or 0% of the profits, 2007: DKK 15 per<br />
share or 30.0% of the profits after minority interests).<br />
Hedging of expected future transactions (DKK ‘000)<br />
Consolidated<br />
EXPECTED FUTURE TRANSACTIONS<br />
HEDGE INSTRUMENT<br />
TIME TO<br />
MATURITY<br />
NOTIONAL<br />
PRINCIPAL<br />
AMOUNT<br />
EXPECTED TIMING OF RECYCLING TO PROFIT AND LOSS<br />
OF GAINS/LOSSES RECOGNISED IN THE EQUITY<br />
0-1 YEAR 1-3 YEARS 3-5 YEARS<br />
MORE THAN<br />
5 YEARS FAIR VALUE<br />
2007<br />
Goods purchased and sold Forward exchange contracts 0-2 years 3,841 65 65<br />
Goods purchased and sold Forward exchange contracts 0-2 years 1,452,668 -12,905 -12,905<br />
Interest Interest swaps 0-10 years 1,189,175 5,342 8,386 4,311 2,960 21,602<br />
Interest Interest swaps 0-10 years 953,670 -5,125 -10,121 -9,970 -7,968 -33,244<br />
-12,688 -1,670 -5,659 -5,008 -24,482<br />
2008<br />
Goods purchased and sold Forward exchange contracts 0-2 years 247,533 26,093 26,108<br />
Goods purchased and sold Forward exchange contracts 0-2 years 153,964 -25,465 -25,465<br />
Interest Interest swaps 0-7 years 445,000 902 301 1,257<br />
Interest Interest swaps 0-7 years 2,383,531 -15,131 -23,597 -22,442 -6,901 -68,228<br />
Interest Currency swaps 0-1 years 208,333 -1,267 -1,267<br />
Goods purchased<br />
Oil contracts for forward<br />
delivery (tons) 0-6 months 84,000 -35,472 -35,472<br />
-50,340 -23,296 -22,442 -6,901 -103,067<br />
2009<br />
Interest Interest swaps 0-6 years 1,350,659 -17,671 -32,691 -21,672 -915 -78,401<br />
Goods purchased<br />
Oil contracts for forward<br />
delivery (tons) 0-6 months 12,000 10,420 10,420<br />
-7,251 -32,691 -21,672 -915 -67,981<br />
For 2009 an income of DKK -5.4 million (2008 DKK 0.0 million, 2007: DKK 0.2 million) is recognised in the income statement due to inefficiency in hedging of<br />
expected future transactions.<br />
The fair values have been calculated by discounting the expected future interest payments. The discount rate for each interest payment is estimated on the basis<br />
of a swap interest curve, which is calculated based on a wide spread of market interest rates.<br />
Note 28 continued on the next page >>>
100 NOTEs<br />
<strong>DFDS</strong> annual report 2009<br />
>>> Note 28 continued<br />
Parent Company<br />
EXPECTED FUTURE TRANSACTIONS<br />
HEDGE INSTRUMENT<br />
TIME TO<br />
MATURITY<br />
NOTIONAL<br />
PRINCIPAL<br />
AMOUNT<br />
EXPECTED TIMING OF RECYCLING TO PROFIT AND LOSS<br />
OF GAINS/LOSSES RECOGNISED IN THE EQUITY<br />
0-1 YEAR 1-3 YEARS 3-5 YEARS<br />
MORE THAN<br />
5 YEARS FAIR VALUE<br />
2007<br />
Goods purchased and sold Forward exchange contracts 0-2 years 1,456,509 -12,443 -12,443<br />
Interest Interest swaps 0-10 years 962,000 4,113 6,653 3,508 2,960 17,505<br />
Interest Interest swaps 0-10 years 899,200 -4,985 -9,970 -9,970 -7,968 -32,953<br />
-13,315 -3,317 -6,462 -5,008 -27,891<br />
2008<br />
Goods purchased and sold Forward exchange contracts 0-2 years 247,533 26,093 26,108<br />
Interest Interest swaps 0-7 years 445,000 902 301 1,257<br />
Interest Interest swaps 0-7 years 2,153,668 -12,021 -24,199 -22,222 -6,901 -65,355<br />
Goods purchased<br />
Oil contract for forward<br />
delivery (tons) 0-6 months 84,000 -35,472 -35,472<br />
-20,498 -23,898 -22,222 -6,901 -73,462<br />
2009<br />
Interest Interest swaps 0-6 years 1,174,963 -16,529 -31,320 -21,672 -915 -74,745<br />
Goods purchased<br />
Oil contract for forward<br />
delivery (tons) 0-6 months 12,000 10,420 10,420<br />
-6,109 -31,320 -21,672 -915 -64,325<br />
For 2009 DKK -4.3 million (2008 DKK 0.0 million, 2007: DKK 0.2 million) is recognised in the income statement due to inefficiency in hedging of expected<br />
future transactions.<br />
The fair values have been calculated by discounting the expected future interest payments. The discount rate for each interest payment is estimated on the<br />
basis of a swap interest curve, which is calculated based on a wide spread of market interest rates.<br />
The fair values have been calculated by discounting the expected future interest payments. The discount rate for each interest payment is estimated basis a<br />
swap interest curve, which is calculated based on a wide spread of market interest rates. The fair values on forward contracts are based on interest curve<br />
calculations in <strong>DFDS</strong> treasury system. Calculations are based on a spread of market interest rates in the various currencies. Calculation on Oil contracts are<br />
based on Morgan Stanley’s quoted forward curve.<br />
Operational risks<br />
Operational risks arise from the cash flow transactions. The size of the transactions made through the financial year is affected by the change in different market<br />
rates such as interest and foreign exchange rates. Currency risks are monitored continuously throughout the year to ensure compliance with the financial<br />
risk management policy.<br />
Currency cash flow risks<br />
Approximately 79% of <strong>DFDS</strong>’ revenues are invoiced in unhedged foreign currencies (2008: 79%, 2007: 76%) with the most substantial net income currencies<br />
being SEK and NOK. USD was the most substantial net expense currency. EUR is considered as minor risk bearing due to the currency peg. For other entities<br />
than the Parent Company the currencies used are primarily their functional currency. The table below shows the unhedged currency cash flow exposure.<br />
Parent Company<br />
DKK ‘000<br />
Consolidated<br />
DKK ‘000<br />
2007 2008 2009 2007 2008 2009<br />
Profit or loss effect of reasonable possible change against DKK<br />
-19.0 -42.4 -21.2 SEK, profit or loss effect, 10% weakening (2008: 10%, 2007: 10%) -18.9 -42.2 -21.2<br />
-5.4 -7.9 -7.7 NOK, profit or loss effect, 10% weakening (2008: 10%, 2007: 10%) -5.4 -7.9 -7.7<br />
-1.5 -36.8 -41.5 USD, profit or loss effect, 10% strengthening (2008: 10%, 2007: 10%) -14.2 -62.8 -48.8<br />
Oil risks<br />
The cost of bunkers constitutes a specific and significant operational risk partly due to large fluctuations in oil prices and partly due to the total annual bunker costs of<br />
approximately DKK 794 million or 12.1% of the Group’s turnover in 2009 (2008: DKK 1,298 million or 15.8% of the Group’s turnover, 2007: DKK 1,036 million or 12% of<br />
the Group’s turnover).<br />
In the freight sector, bunker costs are hedged by price-adjustment clauses in freight contracts. In the passenger sector, fluctuations in the cost of bunkers are reflected in the<br />
ticket price to the extent possible. In addition, hedging transactions, primarily oil swaps, are to some extent also used to manage risk.<br />
The bunker consumption in 2009 was approximately 402,000 tons (2008: 462,000 tons, 2007 477.000 tons). A rise of 10% in the price of bunker compared to the level<br />
at year-end 2009 would have meant increased costs for the Group of DKK 14.0 million (2008: DKK 14.3 million, 2007: DKK 21,9 million), and increased cost for the Parent<br />
Company of DKK 7.4 million (2008: DKK 6.9 million, 2007: 21,9 milllion).
<strong>DFDS</strong> annual report 2009 NOTEs 101<br />
Parent Company<br />
DKK ‘000<br />
Consolidated<br />
DKK ‘000<br />
2007 2008 2009 Note 29 Non-liquid operating items 2007 2008 2009<br />
1,687 764 -167 Change in provisions 10,302 3,519 -2,145<br />
5,575 -5,097 -402 Change in write-down of inventories 5,575 -5,097 -402<br />
-824 453 -162 Defined benefit plans in the income statement 4,811 3,131 9,995<br />
9,970 2,013 807 Fair value of the share options in the income statement 9,970 2,013 807<br />
16,408 -1,867 76 Non-liquid operating items 30,658 3,566 8,255<br />
Parent Company<br />
DKK ‘000<br />
Consolidated<br />
DKK ‘000<br />
2007 2008 2009 Note 30 Change in working capital 2007 2008 2009<br />
-20,163 17,589 3,238 Change in inventories -23,930 23,180 4,306<br />
74,357 83,975 61,719 Change in receivables 52,382 -79,510 119,080<br />
7,243 -123,834 -4,762 Change in current liabilities -76,151 69,195 -36,637<br />
61,437 -22,270 60,195 Change in working capital -47,699 12,865 86,749<br />
Parent Company<br />
DKK ‘000<br />
Consolidated<br />
DKK ‘000<br />
2007 2008 2009 Note 31 Investments in non-current fixed assets, net 2007 2008 2009<br />
-2,032 -3,745 -1,521 Investments -18,197 -11,083 -2,483<br />
0 0 0 Sale 3,242 216 1,072<br />
-2,032 -3,745 -1,521 Investments in buildings and terminals, net -14,955 -10,867 -1,411<br />
-19,069 -35,824 -10,907 Investments -49,884 -71,786 -69,858<br />
583 497 527 Sale 5,507 9,561 18,007<br />
-18,486 -35,327 -10,380 Investments in operating equipment, etc., net -44,377 -62,225 -51,851<br />
Parent Company<br />
DKK ‘000<br />
Consolidated<br />
DKK ‘000<br />
2007 2008 2009 Note 32 Change in other loans 2007 2008 2009<br />
-93,141 -79,060 -77,963 Repayments of loans -121,823 -104,379 -98,487<br />
22,571 562 60,910 Raising of loans 42,214 1,322 60,083<br />
-70,570 -78,498 -17,053 Change in other loans, net -79,609 -103,057 -38,404
102 NOTEs<br />
<strong>DFDS</strong> annual report 2009<br />
Note 33<br />
Acquisition of companies and activities<br />
2007<br />
The Group and the Parent Company have not made any acquisitions of companies in<br />
2007. The purchase price regarding the acquisition of <strong>DFDS</strong> Container Line B.V. have<br />
been adjusted DKK 22.6 million.<br />
2008<br />
The Group and the Parent Company have not made any material acquisitions of<br />
companies in 2008.<br />
2009<br />
The Group and the Parent Company have not made any acquisitions of companies in<br />
2009.<br />
As of 17 December 2009 <strong>DFDS</strong> entered into an agreement with A. P. Moller<br />
- Maersk to acquire 100% of the shares in the Norfolk Holdings B.V. - Group<br />
for a debt free purchase price of DKK 2.6 billion. The purchase price consists of a<br />
cash payment of DKK 1.3 billion and an owner share in <strong>DFDS</strong> A/S of 28.8% (after<br />
completion of the transaction).<br />
A. P. Moller – Maersk subscribes 28.2% of the shares on a directed share issue<br />
and receives 0.6% of <strong>DFDS</strong>’ own shares. The financing of the transaction includes<br />
furthermore a cash pre-emptive rights issue of DKK 550 million.<br />
The transaction is subject to usual conditions, including satisfactory approvals<br />
from relevant competition authorities and the completion of the issues.<br />
Please see company Announcement no 24/2009 of 17 December 2009.<br />
The acquisition is recognised as soon as all approvals are available and <strong>DFDS</strong> A/S<br />
obtain the control of the company, which is expected to happen Q2 2010.<br />
Parent Company<br />
DKK ‘000<br />
Consolidated<br />
DKK ‘000<br />
2007 2008 2009 Note 34 Acquisition of minority interests 2007 2008 2009<br />
-1,626 -13,159 -935 AB <strong>DFDS</strong> LISCO -1,626 -13,159 -935<br />
0 -7,611 -111,673 Halléns N.V. 0 -26,637 -38,494<br />
0 0 0 Transport Partners Intermodal Ltd. -11,017 0 0<br />
-1,626 -20,770 -112,608 Cash flow from acquisition of minority interests -12,643 -39,796 -39,429<br />
2007<br />
AB <strong>DFDS</strong> Lisco<br />
During 2007 acquisition of shares in AB <strong>DFDS</strong> LISCO amounts to DKK 1.6 million,<br />
equivalent to an ownership of 0.3%, providing an ownership share of 92.6%.<br />
Transport Partners Intermodal Ltd.<br />
On 10 January 2007 the remaining ownership of 49% in Transport Partners Intermodal<br />
Ltd. was acquired, and the company is now owned 100% by <strong>DFDS</strong> Lys Line Ireland.<br />
2008<br />
AB <strong>DFDS</strong> Lisco<br />
During 2008 acquisition of shares in AB <strong>DFDS</strong> LISCO amounts to DKK 13.2 million,<br />
equivalent to an ownership of 3.2%, providing an ownership share of 95.8%.<br />
Parent Company<br />
DKK ‘000<br />
Halléns N.V.<br />
The Parent Company have during 2008 acquired 4% of shares in Halléns N.V.<br />
amounting to DKK 7.6 million and <strong>DFDS</strong> Tor Line N.V. have acquired 10% of shares<br />
in Halléns N.V. amounting to DKK 19.0 million. The consolidated ownership by the<br />
Group is hereafter 80%.<br />
2009<br />
AB <strong>DFDS</strong> Lisco<br />
During 2009 acquisition of shares in AB <strong>DFDS</strong> LISCO amounts to DKK 0.9 million,<br />
equivalent to an ownership of 0.2%, providing an ownership share of 96.0%.<br />
Halléns N.V.<br />
The Parent Company has in 2009 acquired 20% of the shares in Halléns N.V.<br />
amounting to DKK 38.5 million. Furthermore the Parent Company has acquired<br />
42% of the shares in Halléns N.V. from the affiliated company <strong>DFDS</strong> Tor Line N.V.<br />
The Parent Company owns hereafter 100% of the shares in Halléns N.V.<br />
Consolidated<br />
DKK ‘000<br />
2007 2008 2009 Note 35 Assets and liabilities held for sale 2007 2008 2009<br />
0 184,971 0 Non-current assets (see Note 12) 131,973 184,971 10,984<br />
Current assets<br />
0 0 0 Inventories 1,561 0 0<br />
0 0 0 Receivables 7,554 0 0<br />
0 0 0 Prepayments 708 0 0<br />
0 0 0 Total current assets 9,823 0 0<br />
0 184,971 0 Total assets held for sale 141,796 184,971 10,984<br />
0 42,500 0 Non-current liabilities (see Note 23) 0 42,500 0<br />
Current liabilities<br />
0 42,500 0 Interest-bearing liabilities (see Note 23) 0 42,500 0<br />
0 0 0 Corporation tax 134 0 0<br />
0 0 0 Other liabilities 7,256 0 0<br />
0 85,000 0 Total liabilities related to assets held for sale 7,390 85,000 0<br />
2007<br />
The Tramp activity comprises of the operation of four multi-purpose ships. The activity<br />
has no connection to the route network as defined in the strategy announced<br />
on 12 September 2007. The four multi-purpose ships were disposed of in 2008 with a<br />
profit of DKK 27.9 million. The profit is included in the income statement in<br />
the line “Profit on disposal of tangible assets”.<br />
2009<br />
The freighter Tor Anglia is for sale and it is expected to be disposed of during 2010.<br />
The passenger ship Queen of Scandinavia is at the end of 2009 transferred to noncurrent<br />
tangible assets because it is considered more likely to charter out the ship than<br />
to dispose it of, see Note 41. The ship has been impaired in 2009 (DKK 53 million).<br />
See Note 39.<br />
2008<br />
The passenger ship Queen of Scandinavia is expected to be disposed of during 2009.
<strong>DFDS</strong> annual report 2009 NOTEs 103<br />
Note 36<br />
Guarantees and contingent liabilities<br />
Guarantees and contingent liabilities amounts to DKK 88.0 million (2008: 79.4<br />
million, 2007: DKK 133.3 million) for the Group.<br />
Guarantees and contingent liabilities amounts to DKK 576.7 million (2008: 802.6<br />
million, 2007: DKK 1,038.0 million) for the Parent Company.<br />
Subsidiaries have provided bank guarantees for the benefit of the Parent Company<br />
in the amount of DKK 1,020.0 million (2008: DKK 0 million, 2007: DKK 0 million).<br />
A contaminated land has been registered in one of the Groups companies.<br />
Currently the Group does not have a commitment to cleanse the land. If such a<br />
commitment should occur, the Group has the possibility to get the cost adjusted in<br />
the original purchase price for the company. The deferred payments regarding the<br />
purchase price reflect among other things the opportunity for a set-off.<br />
The Parent Company is part of a tax suit regarding interpretation of the tonnage<br />
tax regulations, which is not expected to have material impact on the financial<br />
position. On grounds of further developments and outcome of the suit no further<br />
details can be disclosed.<br />
In case the acquisition of Norfolk Holdings B.V. is not concluded, <strong>DFDS</strong> A/S is in<br />
some cases committed to pay A. P. Moller - Maersk EUR 5 million.<br />
As part of the transitional rules from the old tonnage tax regulations to the new<br />
tonnage tax regulations in Norway the companies could choose that 1/3 of the<br />
calculated tax by the transition could be invested in improving environmental<br />
arrangements. Until now this commitment has been measured as a non-current<br />
liability, because the investments must have been carried out within a certain<br />
period of time. The deadline has at the beginning of 2009 been removed and<br />
the commitment is transferred to contingent liabilities. It is required to make<br />
investments in improving environmental arrangements for a minimum of NOK 37.3<br />
million, but without a deadline.<br />
As at 31 December 2009 the Group and the Parent Company are parties in a<br />
number of lawsuits. The outcome of these lawsuits is not expected to affect the<br />
Group’s financial position apart from amounts recognised in the balance sheet.<br />
Parent Company<br />
DKK ‘000<br />
Consolidated<br />
DKK ‘000<br />
2007 2008 2009 Note 37 Contractual commitments 2007 2008 2009<br />
0 1,026,013 0 Contracting of ships and rebuildings, term 0-1 year 0 1,026,013 0<br />
0 1,026,013 0 Total contracting obligations 0 1,026,013 0<br />
Contracting obligations in 2008 consist of purchase of one ro-pax ship, two ro-ro ships and extension of three ro-ro ships. These three ships and the extension of three<br />
ships have all been delivered in 2009.<br />
Operating lease contracts as lessee<br />
Minimum lease payments<br />
21,046 23,066 23,733 0-1 year 30,546 30,776 35,675<br />
88,942 88,856 65,818 1-5 years 100,454 95,579 80,647<br />
15,657 0 0 After 5 years 41,661 21,585 29,182<br />
125,645 111,922 89,551 Total buildings 172,661 147,940 145,504<br />
9,262 9,507 9,808 0-1 year 103,948 85,558 90,729<br />
39,423 40,451 41,748 1-5 years 407,807 333,645 355,525<br />
133,913 123,217 113,240 After 5 years 1,763,923 1,343,217 1,340,542<br />
182,598 173,175 164,796 Total terminals 2,275,678 1,762,420 1,786,796<br />
722,602 1,767,057 799,956 0-1 year 530,392 489,212 401,087<br />
1,203,216 1,093,781 865,562 1-5 years 1,144,305 1,011,824 807,443<br />
1,058,219 875,220 692,096 After 5 years 1,058,219 875,220 692,096<br />
2,984,037 3,736,058 2,357,614 Total ships 2,732,916 2,376,256 1,900,626<br />
14,310 24,290 35,512 0-1 year 30,662 46,461 56,766<br />
20,128 37,085 52,344 1-5 years 43,177 61,098 86,212<br />
0 0 157 After 5 years 0 0 157<br />
34,438 61,375 88,013 Total machinery and equipment 73,839 107,559 143,135<br />
Total minimum lease payments are expected to fall due as follows:<br />
767,220 1,823,920 869,009 0-1 year 695,548 652,007 584,257<br />
1,351,709 1,260,173 1,025,471 1-5 years 1,695,743 1,502,146 1,329,827<br />
1,207,789 998,437 805,494 After 5 years 2,863,803 2,240,022 2,061,977<br />
3,326,718 4,082,530 2,699,974 Total minimum lease payments 5,255,094 4,394,175 3,976,061<br />
The specified obligations are not discounted.<br />
Operational leasing and rent costs recognised in the income statement amount for the Group to DKK 734.2 million for 2009 (2008: DKK 695.6 million,<br />
2007: DKK 667.0 million) and for the Parent Company to DKK 947.5 million for 2009 (2008: DKK 854.9 million, 2007: DKK 701.6 million).<br />
Operating lease contracts on ships are typical made with lease terms between three and ten years. The main part of the lease contracts on ships includes an<br />
option to extend the lease term. Lease contracts on other assets are normal lease agreements including a minimum lease term after which the lease term can<br />
be terminated by giving 1-12 months notice.<br />
Future minimum sublease payments expected to be received under non-cancellable subleases amount for the Group to DKK 177.0 million for 2009 (2008:<br />
DKK 203.6 million, 2007: DKK 97.5 million) and for the Parent Company to DKK 243.9 million for 2009 (2008: DKK 348.5 million, 2007: DKK 258.5 million).<br />
<strong>DFDS</strong> has not entered any substantial agreements, which will be effected, changed nor expired, if the control of the company is changed as a consequence<br />
of an effected takeover bid.<br />
No purchase options of operational leased assets are present.<br />
Note 37 continued on the next page >>>
104 NOTEs<br />
<strong>DFDS</strong> annual report 2009<br />
>>> Note 37 continued<br />
Parent Company<br />
DKK ‘000<br />
Consolidated<br />
DKK ‘000<br />
2007 2008 2009 2007 2008 2009<br />
Operating lease contracts as lessor<br />
Minimum lease payments<br />
Ships<br />
0 0 0 0-1 year 71,090 71,090 16,067<br />
0 0 0 1-5 years 66,833 50,698 0<br />
0 0 0 Total ships 137,923 121,788 16,067<br />
The specified obligations are not discounted.<br />
Operational leasing and rent income recognised in the income statement amounts for the Group to DKK 308.2 million in 2009 (2008: DKK 250.3 million, 2007:<br />
DKK 284.0 million) and for the Parent Company to DKK 388.7 million in 2009 (2008:DKK 269.6 million, 2007: DKK 205.6 million).<br />
The contracts are entered on usual conditions.<br />
2007 2008 2009 2007 2008 2009<br />
Financial lease contracts as lessee<br />
Minimum lease payments<br />
25,250 22,699 0 0-1 year 80,278 72,956 12,174<br />
22,688 0 0 1-5 years 115,907 50,087 55,827<br />
47,938 22,699 0 Total minimum lease payments 196,185 123,043 68,001<br />
-20,064 -9,662 0 Elements of timecharter -94,801 -62,661 0<br />
-5,657 -1,375 0 Elements of finance -14,853 -6,009 -10,232<br />
22,217 11,662 0 I alt 86,531 54,373 57,769<br />
Current liabilities<br />
9,656 11,662 0 Non-current liabilities 35,294 34,275 8,930<br />
12,561 0 0 Total recognised in the balance 51,237 20,098 48,839<br />
22,217 11,662 0 Total 86,531 54,373 57,769<br />
The financial lease contracts included in the balance sheet up to 2008 were primarily related to lease of ships (2008: 4 ships, 2007: 4 ships). During 2009 the contract regarding<br />
1 ship expired and 3 ships were returned prior to time. The 3 ships were previous leased on timecharter agreements until 2010. The lease payments were fixed during<br />
the lease terms. <strong>DFDS</strong> had an option to extend the lease terms by an additional three years for 3 of the ships. None of the lease contracts included an option to acquire<br />
the ships. A small part of the financial lease contracts included in the balance sheet up to 2008 related to cargo carrying equipment. These financial lease contracts expired<br />
during 2009.<br />
In 2009 the financial lease contracts included in the balance sheet are all related to cargo carrying equipment. The lease contracts are entered during 2009 and they<br />
expire in 2014.<br />
Note 38<br />
Related parties<br />
The Group’s related parties exercising control are Lauritzen Fonden, Copenhagen, which indirectly holds more than 50% of the shares in <strong>DFDS</strong> A/S. The members of the<br />
Board of Directors and the Executive Board at Lauritzen Fonden are also related parties.<br />
Furthermore, related parties comprise all companies owned by Lauritzen Fonden, <strong>DFDS</strong>’s group enterprises and associates, cf. page 107 and Note 14, and these<br />
companies’ Executive Board and Board of Directors, executive employees and close members of the family of those.<br />
Apart from intra-group balances and transactions (primary charter hire, trade in ships and commissions etc.), which are eliminated on consolidation, the usual Executive<br />
Board remuneration and Board of Directors emoluments (informed in Note 5), share option to the Executive Board (informed in Note 20) and the below transactions,<br />
no related-party transactions have been carried out during the year.<br />
Regarding J. Lauritzen A/S, trade in 2007 has primarily related to rendering of services. Trade is conducted on arm’s length basis.<br />
Note 38 continued on the next page >>>
<strong>DFDS</strong> annual report 2009 NOTEs 105<br />
Consolidated<br />
DKK ‘000<br />
SALE OF<br />
SERVICES<br />
PURCHASE OF<br />
SERVICES<br />
SALE OF<br />
ASSETS<br />
PURCHASE<br />
OF ASSETS RECEIVABLES LIABILITIES<br />
2007<br />
J. Lauritzen A/S 671 0 0 0 0 0<br />
Associates 421 11,512 0 0 2 532<br />
2008<br />
Associates 1,756 25,517 0 0 1,096 3,329<br />
2009<br />
Associates 925 7,119 0 0 2,799 4,032<br />
Parent Company<br />
DKK ‘000<br />
SALE OF<br />
SERVICES<br />
PURCHASE OF<br />
SERVICES<br />
SALE OF<br />
ASSETS<br />
PURCHASE<br />
OF ASSETS RECEIVABLES LIABILITIES<br />
2007<br />
J. Lauritzen A/S 671 0 0 0 0 0<br />
Group entities 296,889 968,051 0 0 1,469,145 537,850<br />
2008<br />
Associerede virksomheder 0 0 0 0 1,082 2,161<br />
Group entities 329,261 918,119 0 11,874 1,274,523 849,564<br />
2009<br />
Associerede virksomheder 0 0 0 0 1,140 0<br />
Group entities 288,010 984,971 0 111,673 2,228,299 533,702<br />
Note 39 Impairment tests<br />
Introduction<br />
At the end of each year impairment tests of goodwill and other non-current intangible assets, tangible and financial assets are performed. Impairment tests in between the<br />
annual tests will be performed in case there are indications of impairment.<br />
Definition of cash generating unit (CGU)<br />
The division into cash generating units is based on the <strong>DFDS</strong> organisational structure into business areas, which are the three primary business areas Ro-Ro Shipping,<br />
Container Shipping and Passenger Shipping and the two strategic business areas Terminal Services and Trailer Services. The three business areas Ro-Ro Shipping, Container<br />
Shipping and Trailer Services are all considered to be the lowest cash generating units and are therefore the level at which the impairment tests are performed. Ro-Ro<br />
Shipping acts as a unit, where the individual subsidiaries are supporting companies, and the tonnage is switched between the routes to optimise the tonnage compared to<br />
the Group’s customers. Container Shipping is also organised in a route network, and the strategic management – among other things the utilization of assets – is carried<br />
out across the companies. Trailer Services is strategically operated as one unit and with a common pool of equipment. In the Terminal Services business area, the lowest<br />
level for the cash generating unit is represented by the individual terminal.<br />
The individual route in Passenger Shipping is considered to be the lowest cash generating unit. The future expected net cash flows for the individual route are allocated<br />
to the individual ship. The distribution is based on the ship’s capacity in relation to the route’s capacity as well as the expected sailing list during the ship’s useful life in the<br />
Group. The expected net cash flows for the ship are added to the expected scrap value of the ship at the end of the expected useful life in the Group. The scrap value is<br />
calculated as estimated net sales price or net residual value.<br />
Non-current intangible and tangible assets are according to the above definitions allocated to the lowest level of cash generating units, to which the carrying amount can<br />
be attributed and which can be calculated with reasonable certainty.<br />
Definition of cash flow and calculation of recoverable amount<br />
The basis for calculating future net cash flows per cash generating unit is the budgeted operating profit (EBIT) after adjustment for significant events such as opening/closing/changing<br />
routes, rebuilding of existing ships and new buildings.<br />
The estimated cash flows for the individual cash generating units are based on budget approved by the board of directors for the coming financial year.<br />
The estimated value in use for Passenger Shipping is based on the approved budgets for the coming financial year with addition of an evaluation period of four years as<br />
well as a projection as from year six of the useful life of the ships running the route.<br />
The value in use is calculated as the discounted value of future net cash flows for each cash generating unit. The net realisable value is calculated as the fair value of the<br />
non-current assets less selling costs. The recoverable amount is the highest of the fair value and the net realisable value. If the recoverable amount is lower than the carrying<br />
amount of other non-current intangible and tangible assets the assets are impaired to that lower value.<br />
Note 39 continued on the next page >>>
106 NOTEs<br />
<strong>DFDS</strong> annual report 2009<br />
>>> Note 39 continued<br />
The net realisable value for the Group’s most important assets, ships, is estimated based on the average of various independent broker assessments. The brokers’ assignment<br />
is to assess each ship in a “willing buyer – willing seller” situation. The assessments at 31 December 2009, as the assessments at 31 December 2008, are subject to<br />
higher uncertainty caused by the economical and financial situation for the world economy with few comparable transactions than if they were assessed in a normal and<br />
stable marked. Because the assessments have been obtained from different brokers the Group consider an average of these as the best and most valid estimate for the<br />
net realisable value for the ships. The Group collects independent broker assessments each year for the Group’s ships.<br />
Discount rate<br />
The Group determines a discount rate for each cash generating unit (business area) based on the interest rate (without risk) with addition of a risk premium attached<br />
to the individual business area. The interest rate (without risk) is determined to a 10 year Danish interest rate (without risk) at the end of the year. The risk premium is<br />
calculated as a general risk premium of the share market of 5% multiplied with the non-leveraged beta value for each cash generating unit.<br />
The non-leveraged beta values are calculated by gathering non-leveraged beta values for peer-group companies through the data base of Bloomberg for each business<br />
area. The validity of the non-leveraged beta value for each peer-group company is evaluated, so the beta values with lowest validity are eliminated. In general only very<br />
few peer-group companies exist as the beta values are only calculated for listed companies. As a result of this the non-leveraged beta values for the business areas Ro-Ro<br />
Shipping, Container Shipping, Terminal Services and Trailer Services are calculated together as a median of each peer-group company. In addition the four business areas are<br />
considered to be very comparable and are influenced by the same social conditions. For these four business areas the non-leveraged beta value is thus calculated of 0.87<br />
(2008: 0.86).<br />
For Passenger Shipping the non-leveraged beta value is calculated to 0.67 (2008: 0.61). The beta value is lower than for the other business areas, as the activity in Passenger<br />
Shipping is less sensitive to the general market development than the four other business areas.<br />
Finally the calculated discount rates are evaluated and compared with discount rates determined by a few analysts who follow the share of <strong>DFDS</strong> A/S.<br />
Sensitivity analyses<br />
In connection with the impairment tests sensitivity analyses of the expected earnings are prepared annually testing relevant risk factors and scenarios which the Group can<br />
measure on a reliable basis.<br />
A calculation is also made on each cash generating unit determining the break-even point of the discounting rate, calculating which discount rate that would return a<br />
recoverable amount equal to the carrying amount.<br />
Sensitivity analysis are prepared by changing the estimates within probable outcomes. None of these calculations changes the below stated result of impairment tests carried<br />
out.<br />
Order of impairment<br />
In case an indication of impairment is identified, goodwill will be the first asset in line to be written down followed by the primary non-current intangible and tangible<br />
assets in the individual business areas. The impairments will be based on the book value of the assets unless the write-down results in a value less than the net realisable<br />
value of the asset, the value in use of the asset (if available) or zero.<br />
Calculation for 2009<br />
In general no growth is included in the prognosis period (2008: none, 2007: none). Provided that a growth of 0% upon the budget for 2010 does not result in a value in<br />
use that at least match the book value, the calculations are based on scenarios with positive growth. These growth rates are compared to IMF’s estimate (World Outlook<br />
Economic Database, October 2009) of growth in GDP (gross domestic product) (in real terms) for the countries, in which the cash generating unit is operating.<br />
In the projection after the prognosis period a growth of 0% (2008: 0%, 2007: 0%) is assumed for all routes in Passenger Shipping.<br />
Discount rates (before tax) for each business area are:<br />
2007 2008 2009<br />
Ro-Ro Shipping 8.1 % 7.6 % 8.0 %<br />
Container Shipping 7.9 % 7.6 % 8.0 %<br />
Passenger Shipping 8.9 % 6.4 % 7.0 %<br />
Terminal Services 8.2 % 7.6 % 8.0 %<br />
Trailer Services 8.8 % 7.6 % 8.0 %<br />
For two passenger ships the value in use is less than book value. The net realisable value for each ship – calculated as the average of the four broker assessments – exceed<br />
the book value. In the light of this there is no basis for impairment of any of these two passenger ships.<br />
The net realisable value of the passenger ship Queen of Scandinavia is lower than the book value. Therefore an impairment of DKK 53.0 million is made in 2009.<br />
The net realisable value of the ro-ro ship Tor Anglia, which is classified as an asset held for sale, is lower than the book value. Therefore an impairment of DKK 6.1 million is<br />
made in 2009.<br />
Based on the impairment tests carried out in 2009, no basis has been found for impairment of any of the rest of the areas. In 2008 the value in use of the customer portfolio<br />
in <strong>DFDS</strong> Container Line B.V. was less than the book value for which reason an impairment of DKK 38.0 million was carried out. In addition to this other non-current<br />
tangible assets was impaired for a value of DKK 4.4 million, since the value in use was less than the book value. In 2007 the impairment tests carried out showed no basis<br />
for impairments.<br />
Impairment test of investments in group enterprises and associates (Parent Company)<br />
Impairment tests are made for each investment in group enterprises and associates. Each group enterprise is considered to be the smallest cash generating unit.<br />
The estimated value in use of cash flows is based on management approved budgets for the coming financial year and a projection under the assumption of a growth rate<br />
of 0%. Estimate of future cash flows are adjusted for uncertainties based on historical results and take into account expectations of possible fluctuation of future cash flows.<br />
The Parent Company uses a discounting rate, which is determined for the individual group enterprise and associates according to which business area they belong. See<br />
above table for discount rates in use for 2007, 2008 and 2009.<br />
In 2009 no impairment is made in group enterprises. In 2008 an impairment on the investment in <strong>DFDS</strong> Container Line B.V. of DKK 75.0 million and impairment on one<br />
other group enterprise of DKK 3.7 million was carried out, as the calculated values in use was lower than the book values. In 2007 no impairment was made in group<br />
enterprises.<br />
In 2009 an impairment on the cost price of <strong>DFDS</strong> Container Line B.V, has been partly reversed (DKK 40 million) because the calculated value in use exceeds the book<br />
value. .
<strong>DFDS</strong> annual report 2009 NOTEs 107<br />
Note 40<br />
Critical accounting estimates and judgements<br />
When preparing the annual report for the Group, <strong>DFDS</strong>’ management makes a number of accounting estimates and assessments to recognise and measure the Group’s<br />
and the parent company’s assets, liabilities, income and expenses. The most significant accounting estimates and assessments are mentioned below.<br />
Valuation of non-current intangible assets<br />
Impairment tests of goodwill and other non-current intangible assets, which primary relates to customer portfolios/-relations, are made annually as a minimum. Impairment<br />
tests are based on the expected free cash flow from the cash generating unit in question. For further description of impairment tests of goodwill and other non-current<br />
intangible assets, view Note 39.<br />
Estimated useful life, residual values and impairment tests of ships<br />
Significant accounting estimates regarding ships include, among other things, estimates of useful life (including decomposing), residual value and impairment tests. The useful<br />
life and the residual values of the ships within the Group are estimated annually as a minimum. Furthermore the carrying amounts of the ships are tested for impairment<br />
annually as a minimum. Material changes in estimated useful life as well as residual value and the result of the impairment tests can affect the profit for the year.<br />
Accounting Policies and methods regarding critical estimates regarding estimated useful life, residual values and impairment tests of ships are described in Note 1 and Note 39.<br />
Allowances for doubtful trade receivables<br />
Trade receivables are stated at amortised cost less allowances for potential losses on doubtful trade receivables.<br />
Allowances for doubtful trade receivables are estimated taking the inability of the customers to make required payments into account. If the ability of the costumers<br />
to make required payments were to deteriorate, additional allowances may be required in future periods. Management performs analyses on the basis of customers’<br />
expected ability to pay, historical information on payment patterns and doubtful debts, customer concentrations and customers’ creditworthiness and collateral received<br />
when estimating whether write-downs made are sufficient to cover losses.<br />
It is estimated that the allowances are sufficient for covering losses on doubtful trade receivables.<br />
Pensions and similar liabilities<br />
The Groups defined benefit schemes are estimated based on a number of material actuarial assumptions, including discount rates, expected return on the schemes assets,<br />
expected rates for salary, pension increase and death-rate etc. Even modest changes to the assumptions may significant change the pension liability.<br />
The value of the Groups defined benefit schemes are based on calculations from external actuaries.<br />
Deferred tax assets<br />
Deferred tax assets, including tax deficit carried forward, are recognised to the extent that it is estimated that the tax assets can be realised through future positive<br />
income within the foreseeable future.<br />
Provisions and contingent liabilities<br />
The management assess the provisions and contingent liabilities and the probable outcome of pending and possible lawsuits etc. The outcome is dependent on future<br />
events which of nature are uncertain. By the assessment of the most probable outcome of material lawsuits, taxable conditions etc. the management involves external<br />
legal advisors and outcomes from case law.<br />
Note 41<br />
Events after the balance sheet date<br />
At the extraordinary general meeting held on 11 January 2010 it was adopted to increase <strong>DFDS</strong>’ share capital by a nominal total of DKK 540 million in conjunction with<br />
a cash pre-emptive rights issue and to increase the share capital by at least a nominal DKK 310 million and up to a maximum DKK 530 million by way of a directed rights<br />
isssue to A. P. Moller – Maersk, and without pre-emptive subscription rights for shareholders. Please see Company Announcement No. 1/2010.<br />
On 25 January 2010 CEO Niels Smedegaard received a share option of 10,000 shares and CFO Torben Carlsen a share option of 15,750 shares.<br />
On 8 February 2010 an agreement is entered concerning the charter of the passenger ship QUEEN OF SCANDINAVIA for a three year period from 15 April 2010.<br />
The agreement includes purchase options and all terms of the agreement have been fulfilled. The charter agreement is entered into with Inflot Cruise and Ferry Ltd.<br />
headquartered in St. Petersburg, Russia. QUEEN OF SCANDINAVIA is to be deployed on a new route between St. Petersburg and Helsinki in Finland.<br />
On 12 February 2010 the Supreme Court in Norway made the decision that the charge of tax concerning the transition to the new regulation of tonnage tax in 2007<br />
was against the Norwegian constitution. See Note 26.<br />
Beside the above there have not been any significant events after 31 December 2009.
108 <strong>DFDS</strong> Group entities<br />
<strong>DFDS</strong> annual report 2009<br />
Note 42<br />
<strong>DFDS</strong> Group entities<br />
Company<br />
Ownership<br />
share<br />
2007*<br />
Ownership<br />
share<br />
2008*<br />
Ownership<br />
share<br />
2009* COUNTRY CITY CURRENCY<br />
SHARE<br />
CAPITAL<br />
<strong>DFDS</strong> Tor Line N.V. Belgium Gent EUR 62,000<br />
Halléns N.V. 66.0 80.0 100.0 Belgium Gent EUR 300,000<br />
Aukse Multipurpose Shipping Ltd. 92.6 95.8 96.0 Cyprus Limassol CYP 1,709<br />
Lisco Optima Shipping Ltd. 92.6 95.8 96.0 Cyprus Limassol CYP 1,709<br />
Rasa Multipurpose Shipping Ltd. 92.6 95.8 96.0 Cyprus Limassol CYP 1,709<br />
Tor Botnia Shipping Ltd. 96.0 Cypern Limassol EUR 1,000<br />
Tor Finlandia Shipping Ltd. 96.0 Cypern Limassol EUR 1,000<br />
Lisco Maxima Shipping Ltd. 96.0 Cypern Limassol EUR 1,000<br />
<strong>DFDS</strong> A/S Denmark Copenhagen DKK 800,000,000<br />
<strong>DFDS</strong> Canal Tours A/S Denmark Copenhagen DKK 1,000,000<br />
<strong>DFDS</strong> Stevedoring A/S Denmark Esbjerg DKK 502,000<br />
<strong>DFDS</strong> Seaways Ltd. England Harwich GBP 8,050,000<br />
<strong>DFDS</strong> Tor Line Plc. England Immingham GBP 25,500,000<br />
SpeedCargo Ltd. England Bradford GBP 150,000<br />
Halléns OY 66.0 80.0 100.0 Finland Hamina EUR 59,000<br />
Halléns France SA 66.0 80.0 100.0 France Paris EUR 7,000<br />
<strong>DFDS</strong> Containerline B.V. Holland Rotterdam EUR 18,151<br />
<strong>DFDS</strong> Seaways B.V. Holland IJmuiden EUR 18,000<br />
<strong>DFDS</strong> Tor Line B.V. Holland Rotterdam EUR 23,000<br />
LHT Transport B.V. Holland Rotterdam EUR 21,000<br />
Transport Partners Intermodal Ltd. Ireland Dublin EUR 200<br />
<strong>DFDS</strong> Italia SRL Italy Genova EUR 77,000<br />
<strong>DFDS</strong> Tor Line SIA Latvia Riga LVL 10,000<br />
AB Lisco Baltic Service 92.6 95.8 96.0 Lithuania Klaipeda LTL 332,547,434<br />
Laivyno Technikos Prieziuros Base 92.6 95.8 96.0 Lithuania Klaipeda LTL 3,300,000<br />
UAB Aura Shipping 92.6 95.8 96.0 Lithuania Klaipeda LTL 81,000<br />
UAB Krantas Travel 92.6 95.8 96.0 Lithuania Klaipeda LTL 400,000<br />
UAB LISCO SL 92.6 95.8 96.0 Lithuania Klaipeda LTL 100,000<br />
<strong>DFDS</strong> Lys Line Rederi AS Norway Oslo NOK 24,990,000<br />
<strong>DFDS</strong> Lys-Line AS Norway Lilleaker NOK 1,000,000<br />
<strong>DFDS</strong> Seaways AS Norway Oslo NOK 12,000,000<br />
KST Terminal AS Norway Kristiansand NOK 100,000<br />
Moss Container Terminal AS 50.0 100.0 100.0 Norway Moss NOK 1,000,000<br />
NorthSea Terminal AS 66.0 66.0 66.0 Norway Oslo NOK 1,000,000<br />
OOO <strong>DFDS</strong> LISCO Russia Kaliningrad RUR 10,000<br />
<strong>DFDS</strong> Tor Line AB Sweden Gothenburg SEK 25,000,000<br />
SpeedCargo AB Sweden Gothenburg SEK 1,100,000<br />
<strong>DFDS</strong> (Deutschland) GmbH Germany Hamburg EUR 102,000<br />
<strong>DFDS</strong> Tor Line GmbH Germany Cuxhaven EUR 25,000<br />
Lisco Baltic Service GmbH 92.6 95.8 96.0 Germany Kiel EUR 26,000<br />
SpeedCargo GmbH Germany Hamborg EUR 25,000<br />
24 inactive and holding companies<br />
* Unless otherwise indicated, the companies are 100% owned.
<strong>DFDS</strong> annual report 2009 StatementS 109<br />
Statement by the Executive and Supervisory Boards<br />
The Executive and Supervisory Boards have today discussed and approved the annual report of <strong>DFDS</strong> A/S for the financial year 1 January - 31 December 2009.<br />
The annual report has been prepared in accordance with International Financial Reporting Standards as adopted by the EU and additional Danish disclosure<br />
requirements in the Danish Financial Statements Act.<br />
It is our opinion that the consolidated financial statements and parent company financial statements give a true and fair view of the Group’s and the parent<br />
company’s financial position at 31 December 2009 and of the results of the Group’s and the parent company’s operations and cash flows for the financial year<br />
1 January - 31 December 2009.<br />
Further, in our opinion, the Management’s review gives a fair review of the development in the Group’s and the parent company’s operations and financial<br />
matters, the results of the Group’s and the parent company’s operations and financial position and describes the material risks and uncertainties affecting the<br />
Group and the parent company.<br />
We recommend that the annual report be approved at the annual general meeting.<br />
Copenhagen, den 9 March 2010<br />
Executive BOard<br />
board of directors<br />
Niels Smedegaard<br />
Managing Director<br />
Torben Carlsen<br />
CFO<br />
Bent Østergaard<br />
Chairman<br />
Vagn Sørensen<br />
Deputy Chairman<br />
Claus Arnhild*<br />
Michael Helbo* Jill Lauritzen Melby Anders Moberg Thomas Mørk* Ingar Skaug Lene Skole<br />
* Board member elected by the employees<br />
Independent auditors’ report<br />
To the shareholders of <strong>DFDS</strong> A/S<br />
We have audited the consolidated financial statements and the parent company financial statements of <strong>DFDS</strong> A/S for the financial year 1 January - 31 December<br />
209, pp. 55-108. The consolidated financial statements and the parent company financial statements comprise income statement, statement of comprehensive<br />
income, balance sheet, statement of changes in equity, cash flow statement and notes for the Group as well as for the parent company. The consolidated financial<br />
statements and the parent company financial statements have been prepared in accordance with International Financial Reporting Standards as adopted by the EU<br />
and additional Danish disclosure requirements for listed financial institutions.<br />
In addition to our audit, we have read the Management’s review prepared in accordance with Danish disclosure requirements for listed financial institutions<br />
and issued a statement in this regard.<br />
Management’s responsibility<br />
Management is responsible for the preparation and fair presentation of the consolidated financial statements and parent company financial statements in accordance<br />
with International Financial Reporting Standards as adopted by the EU and additional Danish disclosure requirements for listed financial institutions. This responsibility<br />
includes: designing, implementing and maintaining internal control relevant to the preparation and fair presentation of consolidated financial statements<br />
and parent company financial statements that are free from material misstatement, whether due to fraud or error; selecting and applying appropriate accounting<br />
policies; and making accounting estimates that are reasonable in the circumstances. Further, it is the responsibility of Management to prepare a Management’s<br />
review that gives a fair review in accordance with Danish disclosure requirements for listed financial institutions.<br />
Auditors’ responsibility and basis of opinion<br />
Our responsibility is to express an opinion on the consolidated financial statements and parent company financial statements based on our audit. We conducted<br />
our audit in accordance with Danish Standards on Auditing. Those standards require that we comply with ethical requirements and plan and perform the audit to<br />
obtain reasonable assurance whether the consolidated financial statements and the parent company financial statements are free from material misstatement.<br />
An audit involves performing procedures to obtain audit evidence about the amounts and disclosures in the consolidated financial statements and the parent<br />
company financial statements. The procedures selected depend on the auditors’ judgement, including the assessment of the risks of material misstatement of the<br />
consolidated financial statements and the parent company financial statements, whether due to fraud or error. In making those risk assessments, the auditors<br />
consider internal control relevant to the Company’s preparation and fair presentation of the consolidated financial statements and the parent company financial<br />
statements in order to design audit procedures that are appropriate in the circumstances, but not for the purpose of expressing an opinion on the effectiveness of<br />
the Company’s internal control. An audit also includes evaluating the appropriateness of accounting policies used and the reasonableness of accounting estimates<br />
made by Management, as well as evaluating the overall presentation of the consolidated financial statements and the parent company financial statements.<br />
We believe that the audit evidence we have obtained is sufficient and appropriate to provide a basis for our audit opinion.<br />
Our audit did not result in any qualification.<br />
Opinion<br />
In our opinion, the consolidated financial statements and the parent company financial statements give a true and fair view of the Group’s and the parent<br />
company’s financial position at 31 December 2009 and of the results of the Group’s and the parent company’s operations and cash flows for the financial year<br />
1 January - 31 December 2009 in accordance with International Financial Reporting Standards as adopted by the EU and additional Danish disclosure requirements<br />
for listed financial institutions.<br />
Statement on the Management’s review<br />
Pursuant to the Danish Financial Statements Act, we have read the Management’s review. We have not performed any other procedures in addition to the audit of<br />
the consolidated financial statements and the parent company financial statements. On this basis, it is our opinion that the information given in the Management’s<br />
review is consistent with the consolidated financial statements and the parent company financial statements.<br />
Copenhagen, 9 March 2010<br />
KPMG<br />
Statsautoriseret Revisionspartnerselskab<br />
Kurt Gimsing<br />
State Authorised Public Accountant<br />
Torben Bender<br />
State Authorised Public Accountant
110 FLEET LIST<br />
<strong>DFDS</strong> annual report 2009<br />
FLEET<br />
LIST<br />
Freight ships (ro-ro)<br />
Year built GT Lanemeter<br />
Tor Ficaria 2006/09 37,939 4,650<br />
Tor Freesia 2005/09 37,722 4,650<br />
Tor Begonia 2004/09 37,722 4,650<br />
Tor Primula 2004 32,289 3,831<br />
Tor Petunia 2004 32,289 3,831<br />
Tor Magnolia 2003 32,289 3,831<br />
Tor Selandia 1998 24,196 2,772<br />
Tor Suecia 1999 24,196 2,772<br />
Tor Britannia 2000 24,196 2,772<br />
Tor Futura 1996/00 18,725 2,308<br />
Tor Anglia 1977/89 17,492 2,450<br />
Tor Botnia 2000 11,530 1,891<br />
Tor Finlandia 2000 11,530 1,891<br />
Tor Corona 1 2008 25,609 3,343<br />
Tor Hafnia 1 2008 25,609 3,343<br />
Tor Fionia 1 2009 25,609 3,343<br />
Tor Bellona 1 1980 22,748 2,723<br />
Tor Dania 1 1978/95 21,491 2,562<br />
Tor Belgia 1 1978/94 21,491 2,562<br />
Tor Humbria 1 1978 20,165 2,128<br />
Tor Baltica 1 1977/86 14,374 1,866<br />
Tor Cimbria (Aquae) 1 1986 12,189 2,026<br />
Freight ships (ro-ro) for delivery in 2010<br />
Year built GT Lanemeter<br />
Jinling NB 405 – Tor Jutlandia 1 2010 25,609 3,343<br />
PAssenger & freight ships (RO-pax) 2<br />
Year built GT Lanemeter Passengers<br />
Dana Sirena 2002/03 22,382 2,494 623<br />
Lisco Maxima 2009 25,518 2,623 600<br />
Lisco Optima 1999 25,206 2,300 327<br />
Lisco Gloria 2002 20,140 2,494 302<br />
Lisco Patria 1991 18,332 1,800 204<br />
Kaunas 1989 25,606 1,539 235<br />
Vilnius 1987 22,341 1,539 120<br />
Wawel 1 1980 25,275 2,250 1,000<br />
Envoy 1 1979 18,653 2,261 110<br />
Passenger & FREIGHT ships (Cruise Ferry)<br />
Year built GT Lanemeter Passengers<br />
Pearl of Scandinavia 1989/01/05 40,039 1,000 2,166<br />
Crown of Scandinavia 1994/05 35,498 1,005 2,110<br />
Queen of Scandinavia 1981/00 34,093 1,022 1,756<br />
King of Scandinavia 1987/93/06 31,788 1,460 1,620<br />
Princess of Norway 1986/93/06 31,356 1,460 1,650
<strong>DFDS</strong> annual report 2009 FLEET LIST 111<br />
Sideport-Container ships<br />
Year built GT TEU 3<br />
FLEET DISTRIBUTION<br />
(GROSS TONS)<br />
Lysvik 1998/04 7,409 160<br />
Lysbris 1999/04 7,409 160<br />
Lysblink 2000/03 7,409 160<br />
Lystind 1 1990/00 4,471 56<br />
Tistedal 1 1996 4,464 139<br />
Container ships<br />
Year built GT TEU 3<br />
Dana Hollandia 1 2002 6,370 698<br />
Dana Gothia 1 2003 6,370 698<br />
Petuja 1 1997 6,362 700<br />
Rheintal 1 1996 3,824 390<br />
Vanquish 1 1995 2,997 326<br />
RO-RO SHIPS (54%)<br />
RO-PAX SHIPS (21%)<br />
PASSENGER SHIPS (18%)<br />
SIDEPORT-CONTAINER SHIPS (3%)<br />
CONTAINER SHIPS (3%)<br />
TRAMP SHIPS (1%)<br />
Tramp ships<br />
FLEET DISTRIBUTION, NO. OF SHIPS<br />
(GROSS TONS)<br />
Year built GT TEU 3<br />
Odertal 1 2007 3,183 231<br />
Janet 1 1998 2,748 214<br />
Johanne 1 1998 2,748 214<br />
Komarno 1 1993 2,446 176<br />
Isartal 1 1989 2,369 176<br />
Turist boats<br />
Boat type Year built Passengers<br />
Ole Lukøje Restaurant boat, covered 2000 133<br />
Klods Hans Restaurant boat, covered 1998 133<br />
Store Claus Covered 2008 150<br />
H.C. Andersen Covered 2004 150<br />
Snedronningen Covered 1995 144<br />
Nattergalen Covered 1994 144<br />
Sommerfuglen Open 2005 167<br />
Prinsessen på Ærten Open 2003 167<br />
Tinsoldaten Open 2002 167<br />
Moster Open 2001 167<br />
Svinedrengen Open 1998 167<br />
Fyrtøjet Open 1997 167<br />
Skorstensfejeren Open 1996 167<br />
Hyrdinden Open 1996 167<br />
Den Grimme Ælling Battery powered, open 1992 167<br />
Tommelise Open 1991 167<br />
1) Chartered tonnage (time charter)<br />
2) Ro-pax: Combined ro-ro and passenger ship<br />
3) TEU: 20 foot of equivalent unit<br />
RO-RO SHIPS (49%)<br />
RO-PAX SHIPS (23%)<br />
PASSENGER SHIPS (25%)<br />
SIDEPORT-CONTAINER SHIPS (3%)<br />
OWN TONNAGE, AVERAGE AGE<br />
(YEARS)<br />
25<br />
20<br />
15<br />
10<br />
5<br />
0<br />
RO-RO SHIPS<br />
RO-PAX SHIPS<br />
PASSENGER SHIPS (EX. QOS)
112 Commercial duties<br />
<strong>DFDS</strong> annual report 2009<br />
Commercial duties<br />
Commercial duties of the Board of Directors<br />
and the executive board as of 9 March 2010<br />
board of directors<br />
Director Bent Østergaard / Chairman<br />
Date of birth: 5 October 1944<br />
Joined the board: 1 April 2009<br />
Re-elected: N.a.<br />
Period of office ends: 26 March 2010<br />
Board member: J. Lauritzen A/S (C), Frederikshavn Maritime Erhvervspark<br />
A/S (C), Fonden Kattegat Silo (C), Nanonord A/S (C), Cantion<br />
A/S (C), Kayxo A/S (C), Mama Mia Holding A/S, Royal Arctic Line<br />
A/S, Million Brains A/S, With Fonden, Durisol UK<br />
Other commercial duties: CEO for LF Investment Aps and The<br />
Lauritzen Foundation<br />
Special competencies:<br />
n International management experience<br />
n Experience as board member in international<br />
companies and quoted companies<br />
n Shipping<br />
n Finance<br />
Due to commercial duties related to <strong>DFDS</strong>’ majority shareholder, The<br />
Lauritzen Foundation (Vesterhavet Holding A/S), Bent Østergaard is<br />
not considered independent as per the recommendations on Corporate<br />
Governance.<br />
Director Vagn Sørensen / Vice-chairman<br />
Date of birth: 12 December 1959<br />
Joined the board: 20 April 2006<br />
Re-elected: 2007-2009<br />
Period of office ends: 26 March 2010<br />
Board member: KMD A/S (C), Scandic Hotels AB (C), Select Service<br />
Partner Ltd. (C), TDC A/S (C), ST Global AG (VC), Air Canada Inc.,<br />
Braganza AS, SIMI A/S, Cimber Sterling A/S, FLSmidth & Co. A/S<br />
Special competencies:<br />
n International management experience<br />
n Experience as board member in international<br />
companies and quoted companies<br />
n Airline and service companies<br />
Nautical manager Thomas Mørk / Staff representative<br />
Date of birth: 11 November 1972<br />
Joined the board: 1 May 2006<br />
Re-elected: 2007<br />
Period of office ends: 2011<br />
Captain Claus Arnhild, Staff Representative<br />
Date of birth: 26 October 1949<br />
Joined the board: 14 April 1999<br />
Re-elected: 2007<br />
Period of office ends: 2011<br />
Director Anders Moberg / Board member<br />
Date of birth: 21 March 1950<br />
Joined the board: 11 April 2002<br />
Re-elected: 2003-2009<br />
Period of office ends: 26 March 2010<br />
Board member: Clas Ohlson AB (C), Biva A/S (C), Husqvarna AB,<br />
BYGGmax AB, Ahlstrom Corporation OY, Sofia Bank OYJ, HEMA BV,<br />
ZetaDisplay AB<br />
Special competencies:<br />
n International management experience<br />
n Experience as board member in international<br />
companies and quoted companies<br />
n Retail trade<br />
Team Leader Finance Jill Lauritzen Melby / Board member<br />
Date of birth: 6 December 1958<br />
Joined the board: 18 April 2001<br />
Re-elected: annually 2002-2009<br />
Period of office ends: 26 March 2010<br />
Special competencies:<br />
n Financial control<br />
Due to family relations to <strong>DFDS</strong>’ majority shareholder, The Lauritzen<br />
Foundation (Vesterhavet Holding A/S), Jill Lauritzen Melby is not<br />
considered independent as per the recommendations on Corporate<br />
Governance.<br />
Chief Officer Michael Helbo / Staff Representative<br />
Date of birth: 5 November 1962<br />
Joined the board: 28 March 2007<br />
Period of office ends: 2011<br />
Director Ingar Skaug / Board member<br />
Date of birth: 28 September 1946<br />
Joined the board: 16 April 1998<br />
Re-elected: annually 1999-2009<br />
Period of office ends: 26 March 2010<br />
Board member: Center for Creative Leadership (C), Bery Maritime<br />
AS (C), J. Lauritzen A/S (VC), Miros AS, Berg-Hansen AS, Nortraship,<br />
Gard P. & I. Ltd, Petroleum Geo-Services ASA
<strong>DFDS</strong> annual report 2009 Commercial duties 113<br />
Bent Østergaard<br />
Vagn Sørensen<br />
Thomas Mørk<br />
Claus Arnhild<br />
Anders Moberg<br />
Jill Lauritzen Melby<br />
Michael Helbo<br />
Ingar Skaug<br />
Lene Skole<br />
Niels Smedegaard<br />
Torben Carlsen<br />
Other commercial duties: CEO of Wilh. Wilhelmsen ASA<br />
Special competencies:<br />
n International management experience<br />
n Experience as board member in international<br />
companies and quoted companies<br />
n Shipping and logistics<br />
n Airlines and service companies<br />
Executive Board<br />
Niels Smedegaard / President and CEO<br />
Date of birth: 22 June 1962<br />
Board member: Danish Shipowners’ Association, The Trade Council<br />
of Denmark, Denmark-America Foundation<br />
Group Director Lene Skole / Board member<br />
Date of birth: 28 April 1959<br />
Joined the board: 20 April 2006<br />
Re-elected: 2008-2009<br />
Period of office ends: 26 March 2010<br />
Other commercial duties: CFO of Coloplast A/S<br />
Special competencies:<br />
n International management experience<br />
n Financial control<br />
Torben Carlsen / CFO<br />
Date of birth: 5 March 1965<br />
Board member: Crendo Holding AB (C), SEM Stålindustri A/S (C),<br />
Envikraft A/S, Weiss A/S<br />
The Executive Board are members on the boards of <strong>DFDS</strong> Group<br />
subsidiaries.<br />
(C): Chairman<br />
(VC): Vice-chairman
114 KONCERNLEDELSE<br />
<strong>DFDS</strong> annual report 2009<br />
Executive<br />
Management<br />
Niels Smedegaard (1962)<br />
n President and CEO<br />
n MBA<br />
n Employed by <strong>DFDS</strong> since 2007<br />
Carsten Jensen (1964)<br />
n Executive Vice President, Passenger Shipping<br />
n MBA<br />
n Employed by <strong>DFDS</strong> since 2005<br />
Torben Carlsen (1965)<br />
n CFO<br />
n MBA<br />
n Employed by <strong>DFDS</strong> since 2009<br />
Henrik Holck (1961)<br />
n Executive Vice President, HR<br />
n Msc. Psych<br />
n Employed by <strong>DFDS</strong> since 2007<br />
Peder Gellert Pedersen (1958)<br />
n Executive Vice President, Ro-Ro Shipping and Terminal Services<br />
n Ship broker, HD (O)<br />
n Employed by <strong>DFDS</strong> since 1994<br />
Björn Petrusson (1964)<br />
n Sales director, freight<br />
n Civil Engineer<br />
n Employed by <strong>DFDS</strong> since 2001<br />
Ole Sehested (1949)<br />
n Executive Vice President, Container Shipping and Trailer Services<br />
n HD (A)<br />
n Employed by <strong>DFDS</strong> in 1966-2000 and since 2002<br />
Niels Smedegaard<br />
Torben Carlsen<br />
Peder Gellert Pedersen<br />
Ole Sehested<br />
Carsten Jensen<br />
Henrik Holck<br />
Björn Petrusson
<strong>DFDS</strong> annual report 2009 HEADER 115
116<br />
Corporate Governance<br />
<strong>DFDS</strong> annual report 2009<br />
Corporate<br />
Governance<br />
iN <strong>DFDS</strong><br />
<strong>DFDS</strong>’ corporate governance follows NASDAQ OMX<br />
Copenhagen’s recommendations for good corporate<br />
governance, which became part of the disclosure requirements<br />
for companies quoted on the stock exchange as of<br />
financial year 2006.<br />
A full report on <strong>DFDS</strong>’ corporate governance is available from<br />
www.dfds.com/english/aboutdfds/corporategovernance/2009uk.<br />
The following is an outline of the most important principles relating<br />
to corporate governance in <strong>DFDS</strong>.<br />
I. The role of the shareholders and<br />
interaction with the management<br />
Capital and share structure<br />
<strong>DFDS</strong>’ Articles of Association do not contain any restrictions on<br />
voting rights. Each share has a nominal value of DKK 100 and confers<br />
the right to one vote. The statutes contain no other restrictions on<br />
ownership.<br />
The Board of Directors regularly reassesses the relationship<br />
between the capital structure and the Group’s cost of capital, as well<br />
as the Group’s need for financial freedom of action. Such assessments<br />
are conducted on the basis of financial reports and separately when<br />
major investments are made.<br />
The objective for the capital structure is an equity ratio of around<br />
40 % of total assets.<br />
Any capital increases must be presented and approved by the<br />
Annual General Meeting.<br />
II. The role of stakeholders and their<br />
importance to the Group<br />
The Group’s policy in relation to its stakeholders<br />
Mission statement, objectives and policies, including policies for<br />
relationships to the Group’s stakeholders and the rest of the outside<br />
world, constitute key management tools in <strong>DFDS</strong>. These policies also<br />
cover environmental and social conditions.<br />
The roles and interests of stakeholders<br />
The Board of Directors regularly discusses whether the prescribed<br />
policies correspond to the Group’s relationships with stakeholders<br />
and the outside world. It also regularly discusses whether the Group<br />
needs to revise its concepts, targets and policies due to changes in the<br />
organisation and the outside world.<br />
III. Openness and transparency<br />
Investor relations<br />
<strong>DFDS</strong>’ website (www.dfds.com) contains information about Investor<br />
Relations, including Corporate Governance.<br />
<strong>DFDS</strong> publishes an Investor Relations Manual that summarises all<br />
the guidelines and policies relating to the publication of information<br />
in general, and to NASDAQ OMX Copenhagen and the financial<br />
markets in particular.<br />
<strong>DFDS</strong> hosts quarterly telephone conferences for analysts, investors<br />
and other stakeholders, coinciding with the publication of its quarterly<br />
and annual reports. Presentations from these meetings are made<br />
available on the <strong>DFDS</strong> website immediately after the meeting. In addition,<br />
<strong>DFDS</strong>’ management also regularly attends investor meetings in<br />
Denmark and abroad.<br />
IV. The Board of Directors’s work and<br />
responsibilities<br />
Overall tasks and responsibilities<br />
The standing orders for the <strong>DFDS</strong> Board of Directors stipulate that<br />
the Board of Directors and the Executive Board have joint responsibility<br />
for the management and organisation of the Group.<br />
The day-to-day management of the Group is handled by the Executive<br />
Board in accordance with its standing orders. These describe the<br />
allocation of work and responsibilities between the Board of Directors<br />
and the Executive Board, as well as the standing orders, authorisations<br />
and instructions of each body.<br />
The Board of Directors is responsible for drawing up an annual<br />
strategy plan and budget, as well as monthly and quarterly reports.<br />
The Executive Board is apitemed by the Board of Directors. The<br />
Executive Board may only implement dispositions of an exceptional<br />
nature or of major importance on the basis of special authorisation<br />
granted by the Board of Directors as well as between the Audit<br />
Committee and the Executive Board.<br />
V. The composition of the Board of Directors<br />
Recruitment and election of members of the Board of Directors<br />
The chairmanship initiates the selection and nomination process<br />
for new members of the Board of Directors. When recruiting new<br />
members, special emphasis is placed on, for example, general management<br />
experience from companies quoted on the stock exchange.<br />
In addition, members need insight into and experience of industries<br />
related to <strong>DFDS</strong>’ business areas, which include shipping and logistics<br />
as well as the consumer market. Other significant recruitment criteria<br />
include experience of Group acquisitions, international management<br />
experience, and financial insight into, for example, capital-intensive
<strong>DFDS</strong> annual report 2009 Corporate Governance 117<br />
Group operations. In addition, consideration is taken of the spread of<br />
competencies and the ages of the members.<br />
Information about the individual Board of Directors members’<br />
special competencies is included in the annual report under Commercial<br />
Duties.<br />
The overall profile of the Board of Directors includes significant<br />
international management experience. At the end of 2009, the Board of<br />
Directors included two non-Danish members: one Swede and one Norwegian.<br />
Five out of the six members elected at the general meeting hold<br />
or have held executive posts in leading Danish and overseas companies.<br />
Evaluation of the work of the Board of Directors and Executive Board<br />
The chairmanship instigates an annual evaluation of the work of<br />
the Board of Directors and Executive Board including co-operation<br />
between the Board of Directors and Executive Board. The evaluation is<br />
based on the standing orders of the Board of Directors and the Executive<br />
Board, and compares results achieved with targets and strategies.<br />
The Audit Committee conducts its own evaluation.<br />
The evaluation includes an assessment of the individual members’<br />
work, including whether the individual member has had the opportunity<br />
to spend the necessary time on Board of Directors work.<br />
VI. Remuneration of the Board of Directors<br />
and Executive Board<br />
Remuneration policy<br />
<strong>DFDS</strong>’ remuneration policy is that payments to both management and<br />
staff correspond to work done and results achieved, as well as the<br />
conditions in comparable companies.<br />
Members of the Board of Directors receive a fixed annual fee.<br />
The amount of the fee is approved by the shareholders and disclosed<br />
in the annual report. Members of the Board of Directors receive no<br />
incentive pay. Members of the Audit Committe receive a separate fee<br />
for their work.<br />
The total remuneration paid to members of the Executive Board<br />
consists of a fixed and a variable part. The fixed pay consists of a<br />
net salary, pension contribution and other benefits. The variable pay<br />
consists of a bonus and share option scheme.<br />
The Chairman and Deputy Chairman of the Board perform an<br />
annual review of the remuneration paid to members of the Executive<br />
Board relative to the managements of other Danish companies.<br />
Openness about remuneration<br />
The remuneration for the chairmanship, the vice-chairmanship,<br />
members of the Audit Committee and the members of the Board of<br />
Directors is published in the annual report.<br />
The total remuneration for the Executive Board consist of a fixed<br />
and a variable part, which is disclosed in the annual report. The Board<br />
of Directors considers that at this time information about remuneration<br />
and redundancy schemes to each member of the Executive<br />
Board, as recommended by the rules for corporate governance, are<br />
not significant for the evaluation of the Annual Report. The Board of<br />
Directors is also of the opinion that this is in line with normal practice.<br />
Principles for the establishment of incentive programmes<br />
As an element of the variable pay, members of the Executive Board<br />
may receive an annual bonus, subject to achievement of certain<br />
benchmarks. The bonus proportion varies among the members of the<br />
Executive Board, but is subject to a maximum of around 80 % of the<br />
annual net salary. The bonus benchmarks are related to the Group’s<br />
pre-tax profit, but can also include individual benchmarks.<br />
Another element of the variable pay is made up of options and<br />
is intended to ensure that the Executive Board’s incentive correlates<br />
with creation of shareholder value. The option plan is revolving and<br />
not subject to achievement of defined benchmarks.<br />
Members of the Executive Board are awarded a number of options<br />
each year with a value equal to maximum one year’s net pay.<br />
The value is calculated in accordance with the Black Scholes formula.<br />
Options are awarded with a exercise price which is 5 % higher than<br />
the market price at the award date. No remuneration are paid to<br />
the company for receipt of the options. The options have a term of<br />
five years and are exercisable after three years. For tax purposes,<br />
the terms of the award entail that the gain is taxed as share income<br />
while the costs of the award are not tax-deductible for the Company.<br />
The number of options awarded to each member of the Executive<br />
Board and their value is disclosed in the Annual Report. Options in<br />
the Executive Board share option plan are covered by the Company’s<br />
holding of treasury shares.<br />
VII. Risk management<br />
Identification of risks<br />
The management regularly identifies risks associated with the activities<br />
of <strong>DFDS</strong>. Every effort is made to reduce financial and operational<br />
risks by using hedging instruments and safety policies and routines, as<br />
well as complying with all relevant rules for <strong>DFDS</strong>’ activities. Strategic<br />
and business risks are regularly assessed in association with the annual<br />
strategy work and the regular reporting, and especially in advance of<br />
major investment projects.<br />
VIII. Auditing<br />
Accounting policy and accounting estimates<br />
In conjunction with the presentation of the annual results, the Audit<br />
Committee and the accountant discuss important areas of accounting<br />
practice, including accounting estimates.
118 Definitioner<br />
<strong>DFDS</strong> annual report 2009<br />
Definitions<br />
and Glossary<br />
Definitions<br />
Glossary<br />
OPERATING PROFIT BEFORE<br />
DEPRECIATION (EBITDA)<br />
OPERATING PROFIT (EBIT)<br />
OPERATING PROFIT MARGIN<br />
NET OPERATING PROFIT AFTER<br />
TAXES (NOPAT)<br />
INVESTED CAPITAL<br />
Profit before depreciation and impairment on long-term<br />
tangible assets<br />
Profit after depreciation and impairment on long-term tangible<br />
and intangible assets<br />
Operating profit (EBIT)<br />
Revenue<br />
x 100<br />
Operating profit (EBIT) minus payable tax for the period,<br />
adjusted for the tax effect of net interest costs<br />
Average net current assets (non-interest-bearing current<br />
assets minus non-interest bearing liabilities) plus long-term<br />
intangible and tangible assets minus jubilee and pension<br />
liabilities and other provisions<br />
Non-allocated items: Central costs not allocated to<br />
business areas<br />
Ro-Ro Roll on-roll off: Ship type where cargo is driven<br />
on and off<br />
Lo-lo: Lift on-Lift off: Ship type where cargo is lifted on<br />
and off<br />
Ro-Pax: A combined ro-ro freight and passenger ship<br />
Side-port ships: Ships that can be loaded/unloaded from<br />
the sideport of the ship<br />
RETURN ON INVESTED CAPITAL<br />
(ROIC)<br />
Net operating profit after taxes (NOPAT)<br />
Average invested capital<br />
x 100<br />
Lanemetre: A linear metre in the width of a lane on a<br />
shipdeck<br />
WEIGHTED AVERAGE COST<br />
OF CAPITAL (WACC)<br />
PROFIT FOR ANALYTICAL<br />
PURPOSES<br />
FREE CASH FLOW<br />
Average capital cost for liabilities and equity, weighted<br />
according to the capital structure<br />
Profit for the year excluding regulation of taxes from<br />
previous years and remittance of deferred taxes<br />
Cash flow from operations, net excluding interest costs, net<br />
minus cash flow from investments<br />
Space charter: Contract for the rental of a certain area<br />
of a ship deck<br />
Time charter: Contract for the lease of a ship with<br />
crew for certain period of time<br />
RETURN ON EQUITY P.A.<br />
Profit for analytical purposes<br />
Average equity excluding minority<br />
interests<br />
x 100<br />
Bareboat charter: Contract for the lease of a ship<br />
without crew for certain period of time<br />
EQUITY RATIO<br />
Equity<br />
Total assets<br />
x 100<br />
Short-sea: shipping betweeen destinations in a limited<br />
geographical area, as opposed to deep-sea shipping<br />
between continents<br />
EARNINGS PER SHARE (EPS)<br />
P/E RATIO<br />
Profit for analytical purposes<br />
Weighted average number of shares<br />
Share price at the end of the year<br />
Northern Europe: Scandinavia, the Benelux countries,<br />
Great Britain, Ireland, Germany, Poland, the Baltic<br />
countries, Russia and the other CIS countries<br />
Earnings per share (EPS)<br />
DIVIDEND PER SHARE<br />
Dividend for the year<br />
Number of shares at year-end<br />
DIVIDEND PAYOUT RATIO<br />
Dividend for the year<br />
Profit for analytical purposes<br />
DIVIDEND YIELD<br />
Dividend per share<br />
Share price at the end of the period<br />
BOOK VALUE PER SHARE<br />
MARKET-TO-BOOK VALUE (M/B)<br />
Equity excluding minority interests at the end of the year<br />
Number of shares at the end of the year<br />
Share price at the end of the year<br />
Book value per share at year-end
<strong>DFDS</strong> annual report 2009 HEADER 119<br />
<strong>DFDS</strong>’<br />
history<br />
<strong>DFDS</strong> was founded in 1866, when C. F. Tietgen merged the three<br />
biggest Danish steamship companies of the day, and thus <strong>DFDS</strong><br />
celebrated its 140th anniversary in 2006.<br />
From its inception, <strong>DFDS</strong> was involved in domestic as well as<br />
international trade, transporting both freight and passengers. <strong>DFDS</strong>’<br />
international activities started in the North Sea and the Baltic Sea,<br />
followed later by the Mediterranean. Towards the end of the 19th<br />
century, routes were also established to the USA and South America.<br />
Land-based transport and logistics also became a part of <strong>DFDS</strong>’<br />
business activities as freight transport by land began to grow, and<br />
in the 1960s a door-to-door concept for freight was developed.<br />
A passenger route between New York and Miami, based on a<br />
cruise-ferry concept, was opened in 1982 but did not live up to<br />
expectations and closed in 1983. Subsequently, the <strong>DFDS</strong> Group<br />
was restructured and the activities in the Mediterranean and the<br />
routes to the USA and South America were sold.<br />
Since then, <strong>DFDS</strong>’ geographic focus for shipping has been<br />
Northern Europe.<br />
Land-based haulage and logistics activities were developed on the<br />
basis of organic growth and company acquisitions. By the late 1990s,<br />
<strong>DFDS</strong> Dan Transport had become one of the largest land-based<br />
transport companies in Northern Europe. <strong>DFDS</strong> Dan Transport was<br />
sold in 2000 to concentrate the Group’s resources on shipping, and<br />
a focused new shipping strategy was introduced in January 2001.<br />
<strong>DFDS</strong>’ current route network for freight and passenger shipping has<br />
been developed through organic growth and several acquisitions. The<br />
most important investments have been in the Swedish passenger and<br />
freight shipping company Tor Line in the early 80s, the Norwegian<br />
freight shipping company North Sea Line in the late 90s, the<br />
Lithuanian freight and passenger shipping company LISCO in 2001 and<br />
the Norwegian freight shipping company Lys-Line in 2003. In recent<br />
years, organic growth has been generated by, among other things,<br />
investments in tonnage of which the modernisation of the<br />
ro-ro fleet has been most significant.<br />
At the end of 2009, <strong>DFDS</strong> entered into an agreement to acquire<br />
Norfolkline, making the combined company Northern Europe’s<br />
leading passenger and freight company. <strong>DFDS</strong> is thus on the threshold<br />
of starting a new chapter in the company’s history. Final approval<br />
of the acquisition of Norfolkline from the competition authorities<br />
is expected to be received in Q2 2010.<br />
EDITING <strong>DFDS</strong> A/S<br />
Design KONTRapunkt A/S<br />
Layout & production KP2 a/s<br />
PHoto Søren Nielsen
120 HEADER<br />
<strong>DFDS</strong> annual report 2009<br />
<strong>DFDS</strong> A/S<br />
Sundkrogsgade 11<br />
DK-2100 Copenhagen Ø<br />
Tel. +45 3342 3342<br />
Fax. +45 3342 3311<br />
www.dfds.com<br />
CVR 14 19 47 11<br />
Addresses of <strong>DFDS</strong>’ subsidiaries, locations and<br />
offices are available from <strong>DFDS</strong> websites.<br />
This annual report has been translated into<br />
<strong>English</strong> from the Danish version. In case of<br />
discrepancies, the Danish version shall previal.