English - DFDS
English - DFDS
English - DFDS

You also want an ePaper? Increase the reach of your titles
YUMPU automatically turns print PDFs into web optimized ePapers that Google loves.
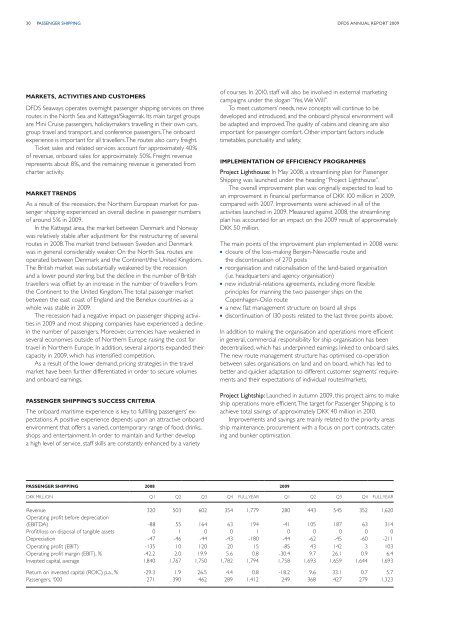
30 passenger shipping<br />
<strong>DFDS</strong> annual report 2009<br />
Markets, activities and customers<br />
<strong>DFDS</strong> Seaways operates overnight passenger shipping services on three<br />
routes in the North Sea and Kattegat/Skagerrak. Its main target groups<br />
are Mini Cruise passengers, holidaymakers travelling in their own cars,<br />
group travel and transport, and conference passengers. The onboard<br />
experience is important for all travellers. The routes also carry freight.<br />
Ticket sales and related services account for approximately 40 %<br />
of revenue, onboard sales for approximately 50 %. Freight revenue<br />
represents about 8 %, and the remaining revenue is generated from<br />
charter activity.<br />
Market trends<br />
As a result of the recession, the Northern European market for passenger<br />
shipping experienced an overall decline in passenger numbers<br />
of around 5 % in 2009.<br />
In the Kattegat area, the market between Denmark and Norway<br />
was relatively stable after adjustment for the restructuring of several<br />
routes in 2008. The market trend between Sweden and Denmark<br />
was in general considerably weaker. On the North Sea, routes are<br />
operated between Denmark and the Continent/the United Kingdom.<br />
The British market was substantially weakened by the recession<br />
and a lower pound sterling, but the decline in the number of British<br />
travellers was offset by an increase in the number of travellers from<br />
the Continent to the United Kingdom. The total passenger market<br />
between the east coast of England and the Benelux countries as a<br />
whole was stable in 2009.<br />
The recession had a negative impact on passenger shipping activities<br />
in 2009 and most shipping companies have experienced a decline<br />
in the number of passengers. Moreover, currencies have weakened in<br />
several economies outside of Northern Europe raising the cost for<br />
travel in Northern Europe. In addition, several airports expanded their<br />
capacity in 2009, which has intensified competition.<br />
As a result of the lower demand, pricing strategies in the travel<br />
market have been further differentiated in order to secure volumes<br />
and onboard earnings.<br />
Passenger Shipping’s success criteria<br />
The onboard maritime experience is key to fulfilling passengers’ expectations.<br />
A positive experience depends upon an attractive onboard<br />
environment that offers a varied, contemporary range of food, drinks,<br />
shops and entertainment. In order to maintain and further develop<br />
a high level of service, staff skills are constantly enhanced by a variety<br />
of courses. In 2010, staff will also be involved in external marketing<br />
campaigns under the slogan “Yes, We Will”.<br />
To meet customers’ needs, new concepts will continue to be<br />
developed and introduced, and the onboard physical environment will<br />
be adapted and improved. The quality of cabins and cleaning are also<br />
important for passenger comfort. Other important factors include<br />
timetables, punctuality and safety.<br />
Implementation of efficiency programmes<br />
Project Lighthouse: In May 2008, a streamlining plan for Passenger<br />
Shipping was launched under the heading “Project Lighthouse”.<br />
The overall improvement plan was originally expected to lead to<br />
an improvement in financial performance of DKK 100 million in 2009,<br />
compared with 2007. Improvements were achieved in all of the<br />
activities launched in 2009. Measured against 2008, the streamlining<br />
plan has accounted for an impact on the 2009 result of approximately<br />
DKK 50 million.<br />
The main points of the improvement plan implemented in 2008 were:<br />
n closure of the loss-making Bergen-Newcastle route and<br />
the discontinuation of 270 posts<br />
n reorganisation and rationalisation of the land-based organisation<br />
(i.e. headquarters and agency organisation)<br />
n new industrial-relations agreements, including more flexible<br />
principles for manning the two passenger ships on the<br />
Copenhagen-Oslo route<br />
n a new, flat management structure on board all ships<br />
n discontinuation of 130 posts related to the last three points above.<br />
In addition to making the organisation and operations more efficient<br />
in general, commercial responsibility for ship organisation has been<br />
decentralised, which has underpinned earnings linked to onboard sales.<br />
The new route management structure has optimised co-operation<br />
between sales organisations on land and on board, which has led to<br />
better and quicker adaptation to different customer segments’ requirements<br />
and their expectations of individual routes/markets.<br />
Project Lightship: Launched in autumn 2009, this project aims to make<br />
ship operations more efficient. The target for Passenger Shipping is to<br />
achieve total savings of approximately DKK 40 million in 2010.<br />
Improvements and savings are mainly related to the priority areas<br />
ship maintenance, procurement with a focus on port contracts, catering<br />
and bunker optimisation.<br />
Passenger Shipping 2008 2009<br />
DKK miLLION Q1 Q2 Q3 Q4 FULL YEAR Q1 Q2 Q3 Q4 FULL YEAR<br />
Revenue 320 503 602 354 1,779 280 443 545 352 1,620<br />
Operating profit before depreciation<br />
(EBITDA) -88 55 164 63 194 -41 105 187 63 314<br />
Profit/loss on disposal of tangible assets 0 1 0 0 1 0 0 0 0 0<br />
Depreciation -47 -46 -44 -43 -180 -44 -62 -45 -60 -211<br />
Operating profit (EBIT) -135 10 120 20 15 -85 43 142 3 103<br />
Operating profit margin (EBIT), % -42.2 2.0 19.9 5.6 0.8 -30.4 9.7 26.1 0.9 6.4<br />
Invested capital, average 1,840 1,767 1,750 1,782 1,794 1,758 1,693 1,659 1,644 1,693<br />
Return on invested capital (ROIC) p.a., % -29.3 1.9 26.5 4.4 0.8 -18.2 9.6 33.1 0.7 5.7<br />
Passengers, '000 271 390 462 289 1,412 249 368 427 279 1,323