English - DFDS
English - DFDS
English - DFDS

You also want an ePaper? Increase the reach of your titles
YUMPU automatically turns print PDFs into web optimized ePapers that Google loves.
6 KEY FIGURES<br />
<strong>DFDS</strong> annual report 2009<br />
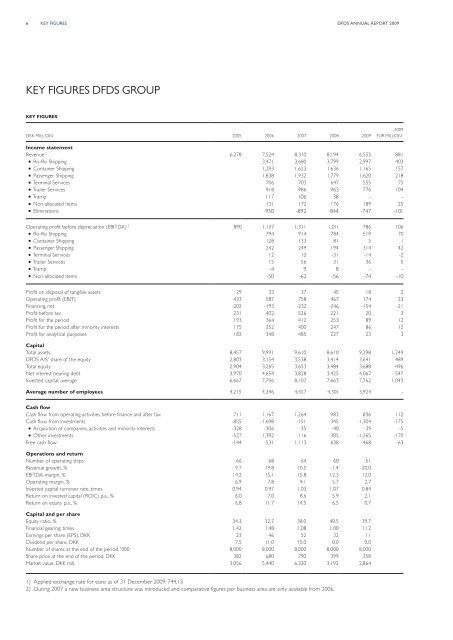
Key Figures <strong>DFDS</strong> Group<br />
Key Figures<br />
DKK millION 2005 2006 2007 2008 2009<br />
2009<br />
EUR miLLION 1<br />
Income statement<br />
Revenue 2 6,278 7,524 8,310 8,194 6,555 881<br />
n Ro-Ro Shipping 3,471 3,680 3,799 2,997 403<br />
n Container Shipping 1,293 1,623 1,636 1,165 157<br />
n Passenger Shipping 1,838 1,932 1,779 1,620 218<br />
n Terminal Services 706 703 647 555 75<br />
n Trailer Services 918 986 963 776 104<br />
n Tramp 117 106 38 - -<br />
n Non-allocated items 131 172 176 189 25<br />
n Eliminations -950 -892 -844 -747 -101<br />
Operating profit before depreciation (EBITDA) 2 890 1,137 1,311 1,011 786 106<br />
n Ro-Ro Shipping 794 914 784 519 70<br />
n Container Shipping 128 133 81 5 1<br />
n Passenger Shipping 242 249 194 314 42<br />
n Terminal Services 12 12 -31 -14 -2<br />
n Trailer Services 15 56 31 36 5<br />
n Tramp -4 9 8 - -<br />
n Non-allocated items -50 -62 -56 -74 -10<br />
Profit on disposal of tangible assets 29 33 37 45 18 2<br />
Operating profit (EBIT) 433 587 758 467 174 23<br />
Financing, net -202 -193 -232 -246 -154 -21<br />
Profit before tax 231 402 526 221 20 3<br />
Profit for the period 193 364 412 253 89 12<br />
Profit for the period after minority interests 175 352 400 247 86 12<br />
Profit for analytical purposes 182 348 485 227 23 3<br />
Capital<br />
Total assets 8,457 9,991 9,610 8,610 9,298 1,249<br />
<strong>DFDS</strong> A/S' share of the equity 2,803 3,154 3,538 3,414 3,641 489<br />
Total equity 2,904 3,265 3,653 3,484 3,688 496<br />
Net interest bearing debt 3,970 4,654 3,828 3,425 4,067 547<br />
Invested capital, average 6,667 7,796 8,107 7,663 7,762 1,043<br />
Average number of employees 4,215 4,346 4,427 4,301 3,924 -<br />
Cash flow<br />
Cash flow from operating activities before finance and after tax 711 1,167 1,264 983 836 112<br />
Cash flow from investments -855 -1,698 -151 -345 -1,304 -175<br />
n Acquisition of companies, activities and minority interests -328 -306 -35 -40 -39 -5<br />
n Other investments -527 -1,392 -116 -305 -1,265 -170<br />
Free cash flow -144 -531 1,113 638 -468 -63<br />
Operations and return<br />
Number of operating ships 66 68 64 60 51<br />
Revenue growth, % 9.7 19.8 10.5 -1.4 -20.0<br />
EBITDA-margin, % 14.2 15.1 15.8 12.3 12.0<br />
Operating margin, % 6.9 7.8 9.1 5.7 2.7<br />
Invested capital turnover rate, times 0.94 0.97 1.03 1.07 0.84<br />
Return on invested capital (ROIC) p.a., % 6.0 7.0 8.6 5.9 2.1<br />
Return on equity p.a., % 6.8 11.7 14.5 6.5 0.7<br />
Capital and per share<br />
Equity ratio, % 34.3 32.7 38.0 40.5 39.7<br />
Financial gearing, times 1.42 1.48 1.08 1.00 1.12<br />
Earnings per share (EPS), DKK 23 46 52 32 11<br />
Dividend per share, DKK 7.5 11.0 15.0 0.0 0.0<br />
Number of shares at the end of the period, '000 8,000 8,000 8,000 8,000 8,000<br />
Share price at the end of the period, DKK 382 680 790 399 358<br />
Market value, DKK mill. 3,056 5,440 6,320 3,192 2,864<br />
1) Applied exchange rate for euro as of 31 December 2009: 744.15<br />
2) During 2007 a new business area structure was introduced and comparative figures per business area are only available from 2006.