English - DFDS
English - DFDS
English - DFDS

You also want an ePaper? Increase the reach of your titles
YUMPU automatically turns print PDFs into web optimized ePapers that Google loves.
<strong>DFDS</strong> annual report 2009 NOTEs 79<br />
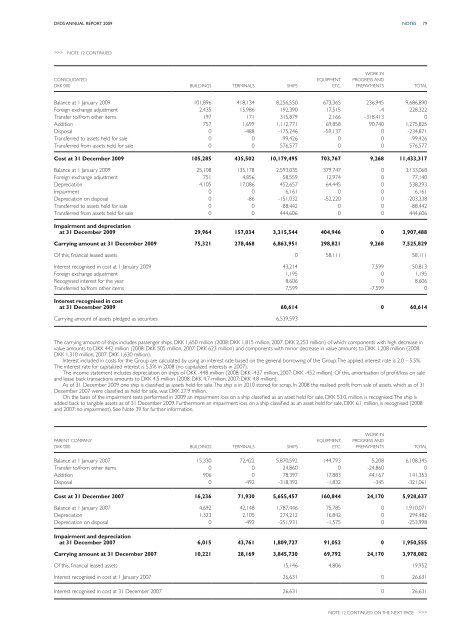
>>> Note 12 continued<br />
Consolidated<br />
DKK ‘000 BUILDINGS TERMINALS SHIPS<br />
EQUIPMENT,<br />
ETC.<br />
WORK IN<br />
PROGRESS AND<br />
PREPAYMENTS<br />
TOTAL<br />
Balance at 1 January 2009 101,896 418,134 8,256,550 673,365 236,945 9,686,890<br />
Foreign exchange adjustment 2,435 15,986 192,390 17,515 -4 228,322<br />
Transfer to/from other items 197 171 315,879 2,166 -318,413 0<br />
Addition 757 1,699 1,112,771 69,858 90,740 1,275,825<br />
Disposal 0 -488 -175,246 -59,137 0 -234,871<br />
Transferred to assets held for sale 0 0 -99,426 0 0 -99,426<br />
Transferred from assets held for sale 0 0 576,577 0 0 576,577<br />
Cost at 31 December 2009 105,285 435,502 10,179,495 703,767 9,268 11,433,317<br />
Balance at 1 January 2009 25,108 135,178 2,593,035 379,747 0 3,133,068<br />
Foreign exchange adjustment 751 4,856 58,559 12,974 0 77,140<br />
Depreciation 4,105 17,086 452,657 64,445 0 538,293<br />
Impairment 0 0 6,161 0 0 6,161<br />
Depreciation on disposal 0 -86 -151,032 -52,220 0 -203,338<br />
Transferred to assets held for sale 0 0 -88,442 0 0 -88,442<br />
Transferred from assets held for sale 0 0 444,606 0 0 444,606<br />
Impairment and depreciation<br />
at 31 December 2009 29,964 157,034 3,315,544 404,946 0 3,907,488<br />
Carrying amount at 31 December 2009 75,321 278,468 6,863,951 298,821 9,268 7,525,829<br />
Of this, financial leased assets 0 58,111 58,111<br />
Interest recognised in cost at 1 January 2009 43,214 7,599 50,813<br />
Foreign exchange adjustment 1,195 0 1,195<br />
Recognised interest for the year 8,606 0 8,606<br />
Transferred to/from other items 7,599 -7,599 0<br />
Interest recognised in cost<br />
at 31 December 2009 60,614 0 60,614<br />
Carrying amount of assets pledged as securities 6,539,593<br />
The carrying amount of ships includes passenger ships, DKK 1,650 million (2008: DKK 1,815 million, 2007: DKK 2,253 million) of which components with high decrease in<br />
value amounts to DKK 442 million (2008: DKK 505 million, 2007: DKK 623 million) and components with minor decrease in value amounts to DKK 1,208 million (2008:<br />
DKK 1,310 million, 2007: DKK 1,630 million).<br />
Interest included in costs for the Group are calculated by using an interest rate based on the general borrowing of the Group. The applied interest rate is 2.0 – 5.5%.<br />
The interest rate for capitalized interest is 5.5% in 2008 (no capitalized interests in 2007).<br />
The income statement includes depreciation on ships of DKK -448 million (2008: DKK -437 million, 2007: DKK -452 million). Of this, amortisation of profit/loss on sale<br />
and lease back transactions amounts to DKK 4.5 million (2008: DKK 4.7 million, 2007: DKK 4.8 million).<br />
As of 31 December 2009 one ship is classified as assets held for sale. The ship is in 2010 stored for scrap. In 2008 the realised profit from sale of assets, which as of 31<br />
December 2007 were classified as held for sale, was DKK 27.9 million.<br />
On the basis of the impairment tests performed in 2009 an impairment loss on a ship classified as an asset held for sale, DKK 53.0, million, is recognised. The ship is<br />
added back to tangible assets as of 31 December 2009. Furthermore an impairment loss on a ship classified as an asset held for sale, DKK 6.1 million, is recognised (2008<br />
and 2007: no impairment). See Note 39 for further information.<br />
Parent Company<br />
DKK ‘000 BUILDINGS TERMINALS SHIPS<br />
EQUIPMENT,<br />
ETC.<br />
WORK IN<br />
PROGRESS AND<br />
PREPAYMENTS<br />
TOTAL<br />
Balance at 1 January 2007 15,330 72,422 5,870,592 144,793 5,208 6,108,345<br />
Transfer to/from other items 0 0 24,860 0 -24,860 0<br />
Addition 906 0 78,397 17,883 44,167 141,353<br />
Disposal 0 -492 -318,392 -1,832 -345 -321,061<br />
Cost at 31 December 2007 16,236 71,930 5,655,457 160,844 24,170 5,928,637<br />
Balance at 1 January 2007 4,692 42,148 1,787,446 75,785 0 1,910,071<br />
Depreciation 1,323 2,105 274,212 16,842 0 294,482<br />
Depreciation on disposal 0 -492 -251,931 -1,575 0 -253,998<br />
Impairment and depreciation<br />
at 31 December 2007 6,015 43,761 1,809,727 91,052 0 1,950,555<br />
Carrying amount at 31 December 2007 10,221 28,169 3,845,730 69,792 24,170 3,978,082<br />
Of this, financial leased assets 15,146 4,806 19,952<br />
Interest recognised in cost at 1 January 2007 26,631 0 26,631<br />
Interest recognised in cost at 31 December 2007 26,631 0 26,631<br />
Note 12 continued on the next page >>>