English - DFDS
English - DFDS
English - DFDS

You also want an ePaper? Increase the reach of your titles
YUMPU automatically turns print PDFs into web optimized ePapers that Google loves.
<strong>DFDS</strong> annual report 2009 NOTEs 71<br />
>>> Note 2 continued<br />
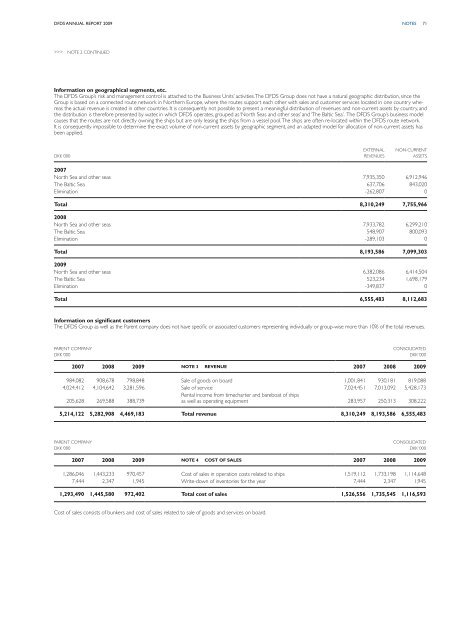
Information on geographical segments, etc.<br />
The <strong>DFDS</strong> Group’s risk and management control is attached to the Business Units’ activities. The <strong>DFDS</strong> Group does not have a natural geographic distribution, since the<br />
Group is based on a connected route network in Northern Europe, where the routes support each other with sales and customer services located in one country whereas<br />
the actual revenue is created in other countries. It is consequently not possible to present a meaningful distribution of revenues and non-current assets by country, and<br />
the distribution is therefore presented by water, in which <strong>DFDS</strong> operates, grouped as ‘North Seas and other seas’ and ‘The Baltic Sea’. The <strong>DFDS</strong> Group’s business model<br />
causes that the routes are not directly owning the ships but are only leasing the ships from a vessel pool. The ships are often re-located within the <strong>DFDS</strong> route network.<br />
It is consequently impossible to determine the exact volume of non-current assets by geographic segment, and an adapted model for allocation of non-current assets has<br />
been applied.<br />
DKK ‘000<br />
EXTERNAL<br />
REVENUES<br />
NON-CURRENT<br />
ASSETS<br />
2007<br />
North Sea and other seas 7,935,350 6,912,946<br />
The Baltic Sea 637,706 843,020<br />
Elimination -262,807 0<br />
Total 8,310,249 7,755,966<br />
2008<br />
North Sea and other seas 7,933,782 6,299,210<br />
The Baltic Sea 548,907 800,093<br />
Elimination -289,103 0<br />
Total 8,193,586 7,099,303<br />
2009<br />
North Sea and other seas 6,382,086 6,414,504<br />
The Baltic Sea 523,234 1,698,179<br />
Elimination -349,837 0<br />
Total 6,555,483 8,112,683<br />
Information on significant customers<br />
The <strong>DFDS</strong> Group as well as the Parent company does not have specific or associated customers representing individually or group-wise more than 10% of the total revenues.<br />
Parent Company<br />
DKK ‘000<br />
Consolidated<br />
DKK ‘000<br />
2007 2008 2009 Note 3 Revenue 2007 2008 2009<br />
984,082 908,678 798,848 Sale of goods on board 1,001,841 930,181 819,088<br />
4,024,412 4,104,642 3,281,596 Sale of service 7,024,451 7,013,092 5,428,173<br />
205,628 269,588 388,739<br />
Rental income from timecharter and bareboat of ships<br />
as well as operating equipment 283,957 250,313 308,222<br />
5,214,122 5,282,908 4,469,183 Total revenue 8,310,249 8,193,586 6,555,483<br />
Parent Company<br />
DKK ‘000<br />
Consolidated<br />
DKK ‘000<br />
2007 2008 2009 Note 4 Cost of sales 2007 2008 2009<br />
1,286,046 1,443,233 970,457 Cost of sales in operation costs related to ships 1,519,112 1,733,198 1,114,648<br />
7,444 2,347 1,945 Write-down of inventories for the year 7,444 2,347 1,945<br />
1,293,490 1,445,580 972,402 Total cost of sales 1,526,556 1,735,545 1,116,593<br />
Cost of sales consists of bunkers and cost of sales related to sale of goods and services on board.