English - DFDS
English - DFDS
English - DFDS

Create successful ePaper yourself
Turn your PDF publications into a flip-book with our unique Google optimized e-Paper software.
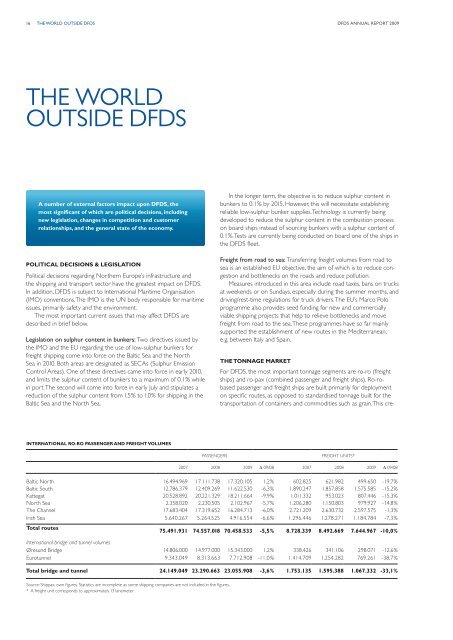
16 The World Outside <strong>DFDS</strong><br />
<strong>DFDS</strong> annual report 2009<br />
The World<br />
Outside <strong>DFDS</strong><br />
A number of external factors impact upon <strong>DFDS</strong>, the<br />
most significant of which are political decisions, including<br />
new legislation, changes in competition and customer<br />
relationships, and the general state of the economy.<br />
Political decisions & legislation<br />
Political decisions regarding Northern Europe’s infrastructure and<br />
the shipping and transport sector have the greatest impact on <strong>DFDS</strong>.<br />
In addition, <strong>DFDS</strong> is subject to International Maritime Organisation<br />
(IMO) conventions. The IMO is the UN body responsible for maritime<br />
issues, primarily safety and the environment.<br />
The most important current issues that may affect <strong>DFDS</strong> are<br />
described in brief below.<br />
Legislation on sulphur content in bunkers: Two directives issued by<br />
the IMO and the EU regarding the use of low-sulphur bunkers for<br />
freight shipping come into force on the Baltic Sea and the North<br />
Sea in 2010. Both areas are designated as SECAs (Sulphur Emission<br />
Control Areas). One of these directives came into force in early 2010,<br />
and limits the sulphur content of bunkers to a maximum of 0.1 % while<br />
in port. The second will come into force in early July and stipulates a<br />
reduction of the sulphur content from 1.5 % to 1.0 % for shipping in the<br />
Baltic Sea and the North Sea.<br />
In the longer term, the objective is to reduce sulphur content in<br />
bunkers to 0.1 % by 2015. However, this will necessitate establishing<br />
reliable low-sulphur bunker supplies. Technology is currently being<br />
developed to reduce the sulphur content in the combustion process<br />
on board ships instead of sourcing bunkers with a sulphur content of<br />
0.1 %. Tests are currently being conducted on board one of the ships in<br />
the <strong>DFDS</strong> fleet.<br />
Freight from road to sea: Transferring freight volumes from road to<br />
sea is an established EU objective, the aim of which is to reduce congestion<br />
and bottlenecks on the roads and reduce pollution.<br />
Measures introduced in this area include road taxes, bans on trucks<br />
at weekends or on Sundays, especially during the summer months, and<br />
driving/rest-time regulations for truck drivers. The EU’s Marco Polo<br />
programme also provides seed funding for new and commercially<br />
viable shipping projects that help to relieve bottlenecks and move<br />
freight from road to the sea. These programmes have so far mainly<br />
supported the establishment of new routes in the Mediterranean,<br />
e.g. between Italy and Spain.<br />
The tonnage market<br />
For <strong>DFDS</strong>, the most important tonnage segments are ro-ro (freight<br />
ships) and ro-pax (combined passenger and freight ships). Ro-robased<br />
passenger and freight ships are built primarily for deployment<br />
on specific routes, as opposed to standardised tonnage built for the<br />
transportation of containers and commodities such as grain. This cre-<br />
International ro-ro passenger and freight volumes<br />
Passengers<br />
FREIGHT UNITS*<br />
2007 2008 2009 ∆ 09/08 2007 2008 2009 ∆ 09/08<br />
Baltic North 16.494.969 17.111.738 17.320.105 1,2 % 602.825 621.982 499.650 -19,7%<br />
Baltic South 12.786.379 12.409.269 11.622.530 -6,3% 1.890.247 1.857.858 1.575.585 -15,2%<br />
Kattegat 20.528.892 20.221.329 18.211.664 -9,9% 1.011.332 953.023 807.446 -15,3%<br />
North Sea 2.358.020 2.230.505 2.102.967 -5,7% 1.206.280 1.150.803 979.927 -14,8%<br />
The Channel 17.683.404 17.319.652 16.284.713 -6,0% 2.721.209 2.630.732 2.597.575 -1,3%<br />
Irish Sea 5.640.267 5.264.525 4.916.554 -6,6% 1.296.446 1.278.271 1.184.784 -7,3%<br />
Total routes<br />
75.491.931 74.557.018 70.458.533 -5,5% 8.728.339 8.492.669 7.644.967 -10,0%<br />
International bridge and tunnel volumes<br />
Øresund Bridge 14.806.000 14.977.000 15.343.000 1,2 % 338.426 341.106 298.071 -12,6%<br />
Eurotunnel 9.343.049 8.313.663 7.712.908 -11,0% 1.414.709 1.254.282 769.261 -38,7%<br />
Total bridge and tunnel 24.149.049 23.290.663 23.055.908 -3,6 % 1.753.135 1.595.388 1.067.332 -33,1 %<br />
Source: Shippax, own figures. Statistics are incomplete as some shipping companies are not included in the figures.<br />
* A freight unit corresponds to approximately 13 lanemeter.