English - DFDS
English - DFDS
English - DFDS

You also want an ePaper? Increase the reach of your titles
YUMPU automatically turns print PDFs into web optimized ePapers that Google loves.
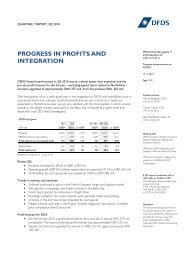
<strong>DFDS</strong> annual report 2009 Financial review 51<br />
<strong>DFDS</strong> Group 2008 2009<br />
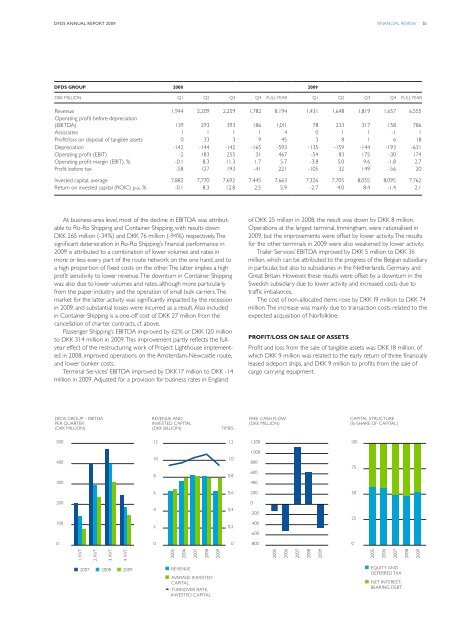
DKK miLLION Q1 Q2 Q3 Q4 Full year Q1 Q2 Q3 Q4 Full year<br />
Revenue 1,944 2,209 2,259 1,782 8,194 1,431 1,648 1,819 1,657 6,555<br />
Operating profit before depreciation<br />
(EBITDA) 139 293 393 186 1,011 78 233 317 158 786<br />
Associates 1 1 1 1 4 0 1 1 -1 1<br />
Profit/loss on disposal of tangible assets 0 33 3 9 45 3 8 1 6 18<br />
Depreciation -142 -144 -142 -165 -593 -135 -159 -144 -193 -631<br />
Operating profit (EBIT) -2 183 255 31 467 -54 83 175 -30 174<br />
Operating profit margin (EBIT), % -0.1 8.3 11.3 1.7 5.7 -3.8 5.0 9.6 -1.8 2.7<br />
Profit before tax -58 127 193 -41 221 -105 32 149 -56 20<br />
Invested capital, average 7,882 7,770 7,692 7,445 7,663 7,326 7,705 8,055 8,095 7,762<br />
Return on invested capital (ROIC) p.a., % -0.1 8.3 12.8 2.5 5.9 -2.7 4.0 8.4 -1.4 2.1<br />
At business-area level, most of the decline in EBITDA was attributable<br />
to Ro-Ro Shipping and Container Shipping, with results down<br />
DKK 265 million (-34 %) and DKK 76 million (-94 %) respectively. The<br />
significant deterioration in Ro-Ro Shipping’s financial performance in<br />
2009 is attributed to a combination of lower volumes and rates in<br />
more or less every part of the route network on the one hand, and to<br />
a high proportion of fixed costs on the other. The latter implies a high<br />
profit sensitivity to lower revenue. The downturn in Container Shipping<br />
was also due to lower volumes and rates, although more particularly<br />
from the paper industry and the operation of small bulk carriers. The<br />
market for the latter activity was significantly impacted by the recession<br />
in 2009, and substantial losses were incurred as a result. Also included<br />
in Container Shipping is a one-off cost of DKK 27 million from the<br />
cancellation of charter contracts, cf. above.<br />
Passenger Shipping’s EBITDA improved by 62 % or DKK 120 million<br />
to DKK 314 million in 2009. This improvement partly reflects the fullyear<br />
effect of the restructuring work of Project Lighthouse implemented<br />
in 2008, improved operations on the Amsterdam-Newcastle route,<br />
and lower bunker costs.<br />
Terminal Services’ EBITDA improved by DKK 17 million to DKK -14<br />
million in 2009. Adjusted for a provision for business rates in England<br />
of DKK 25 million in 2008, the result was down by DKK 8 million.<br />
Operations at the largest terminal, Immingham, were rationalised in<br />
2009, but the improvements were offset by lower activity. The results<br />
for the other terminals in 2009 were also weakened by lower activity.<br />
Trailer Services’ EBITDA improved by DKK 5 million to DKK 36<br />
million, which can be attributed to the progress of the Belgian subsidiary<br />
in particular, but also to subsidiaries in the Netherlands, Germany and<br />
Great Britain. However, these results were offset by a downturn in the<br />
Swedish subsidiary due to lower activity and increased costs due to<br />
traffic imbalances.<br />
The cost of non-allocated items rose by DKK 19 million to DKK 74<br />
million. The increase was mainly due to transaction costs related to the<br />
expected acquisition of Norfolkline.<br />
Profit/loss on sale of assets<br />
Profit and loss from the sale of tangible assets was DKK 18 million, of<br />
which DKK 9 million was related to the early return of three financially<br />
leased sideport ships, and DKK 9 million to profits from the sale of<br />
cargo carrying equipment.<br />
<strong>DFDS</strong> GROUP – EBITDA<br />
PER QUARTER<br />
(DKK MILLION)<br />
REVENUE AND<br />
INVESTED CAPITAL<br />
(DKK BILLION)<br />
TIMES<br />
FREE CASH FLOW<br />
(DKK MILLION)<br />
CAPITAL STRUCTURE<br />
(%-SHARE OF CAPITAL)<br />
500<br />
12<br />
1,2<br />
1.200<br />
100<br />
400<br />
300<br />
10<br />
8<br />
1,0<br />
0,8<br />
1.000<br />
800<br />
600<br />
400<br />
75<br />
6<br />
0,6<br />
200<br />
50<br />
200<br />
100<br />
4<br />
2<br />
0,4<br />
0,2<br />
0<br />
-200<br />
-400<br />
-600<br />
25<br />
0<br />
0<br />
0<br />
-800<br />
0<br />
1. KVT.<br />
2. KVT.<br />
3. KVT.<br />
4. KVT.<br />
2005<br />
2006<br />
2007<br />
2008<br />
2009<br />
2005<br />
2006<br />
2007<br />
2008<br />
2009<br />
2005<br />
2006<br />
2007<br />
2008<br />
2009<br />
2007 2008 2009<br />
REVENUE<br />
AVERAGE INVESTED<br />
CAPITAL<br />
TURNOVER RATE,<br />
INVESTED CAPITAL<br />
EQUITY AND<br />
DEFERRED TAX<br />
NET INTEREST-<br />
BEARING DEBT