English - DFDS
English - DFDS
English - DFDS

You also want an ePaper? Increase the reach of your titles
YUMPU automatically turns print PDFs into web optimized ePapers that Google loves.
70 NOTEs<br />
<strong>DFDS</strong> annual report 2009<br />
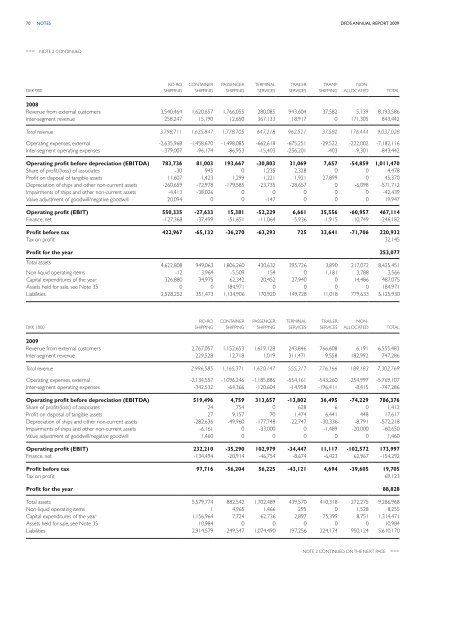
>>> Note 2 continued<br />
DKK ‘000<br />
RO-RO<br />
SHIPPING<br />
CONTAINER<br />
SHIPPING<br />
PASSENGER<br />
SHIPPING<br />
TERMINAL<br />
SERVICES<br />
TRAILER<br />
SERVICES<br />
TRAMP<br />
SHIPPING<br />
Nonallocated<br />
TOTAL<br />
2008<br />
Revenue from external customers 3,540,464 1,620,657 1,766,055 280,085 943,604 37,582 5,139 8,193,586<br />
Inter-segment revenue 258,247 15,190 12,650 367,133 18,917 0 171,305 843,442<br />
Total revenue 3,798,711 1,635,847 1,778,705 647,218 962,521 37,582 176,444 9,037,028<br />
Operating expenses, external -2,635,968 -1,458,670 -1,498,085 -662,618 -675,251 -29,522 -222,002 -7,182,116<br />
Inter-segment operating expenses -379,007 -96,174 -86,953 -15,403 -256,201 -403 -9,301 -843,442<br />
Operating profit before depreciation (EBITDA) 783,736 81,003 193,667 -30,803 31,069 7,657 -54,859 1,011,470<br />
Share of profit/(loss) of associates -30 945 0 1,235 2,328 0 0 4,478<br />
Profit on disposal of tangible assets 11,607 1,423 1,299 1,221 1,921 27,899 0 45,370<br />
Depreciation of ships and other non-current assets -260,659 -72,978 -179,585 -23,735 -28,657 0 -6,098 -571,712<br />
Impairments of ships and other non-current assets -4,413 -38,026 0 0 0 0 0 -42,439<br />
Value adjustment of goodwill/negative goodwill 20,094 0 0 -147 0 0 0 19,947<br />
Operating profit (EBIT) 550,335 -27,633 15,381 -52,229 6,661 35,556 -60,957 467,114<br />
Finance, net -127,368 -37,499 -51,651 -11,064 -5,936 -1,915 -10,749 -246,182<br />
Profit before tax 422,967 -65,132 -36,270 -63,293 725 33,641 -71,706 220,932<br />
Tax on profit 32,145<br />
Profit for the year 253,077<br />
Total assets<br />
4,622,808 949,063 1,806,260 430,632 395,726 3,890 217,072 8,425,451<br />
Non-liquid operating items -12 3,964 -5,509 154 0 1,181 3,788 3,566<br />
Capital expenditures of the year 326,880 34,975 62,342 20,452 27,940 0 14,486 487,075<br />
Assets held for sale, see Note 35 0 0 184,971 0 0 0 0 184,971<br />
Liabilities 2,528,252 351,473 1,134,906 170,920 149,728 11,018 779,633 5,125,930<br />
DKK 1.000<br />
RO-RO<br />
SHIPPING<br />
CONTAINER<br />
SHIPPING<br />
PASSENGER<br />
SHIPPING<br />
TERMINAL<br />
SERVICES<br />
TRAILER<br />
SERVICES<br />
Nonallocated<br />
TOTAL<br />
2009<br />
Revenue from external customers 2,767,057 1,152,653 1,619,128 243,846 766,608 6,191 6,555,483<br />
Inter-segment revenue 229,528 12,718 1,019 311,471 9,558 182,992 747,286<br />
Total revenue 2,996,585 1,165,371 1,620,147 555,317 776,166 189,183 7,302,769<br />
Operating expenses, external -2,134,557 -1,096,246 -1,185,886 -554,161 -543,260 -254,997 -5,769,107<br />
Inter-segment operating expenses -342,532 -64,366 -120,604 -14,958 -196,411 -8,415 -747,286<br />
Operating profit before depreciation (EBITDA) 519,496 4,759 313,657 -13,802 36,495 -74,229 786,376<br />
Share of profit/(loss) of associates 24 754 0 628 6 0 1,412<br />
Profit on disposal of tangible assets 27 9,157 70 1,474 6,441 448 17,617<br />
Depreciation of ships and other non-current assets -282,636 -49,960 -177,748 -22,747 -30,336 -8,791 -572,218<br />
Impairments of ships and other non-current assets -6,161 0 -33,000 0 -1,489 -20,000 -60,650<br />
Value adjustment of goodwill/negative goodwill 1,460 0 0 0 0 0 1,460<br />
Operating profit (EBIT) 232,210 -35,290 102,979 -34,447 11,117 -102,572 173,997<br />
Finance, net -134,494 -20,914 -46,754 -8,674 -6,423 62,967 -154,292<br />
Profit before tax 97,716 -56,204 56,225 -43,121 4,694 -39,605 19,705<br />
Tax on profit 69,123<br />
Profit for the year 88,828<br />
Total assets 5,579,774 882,542 1,702,489 439,570 410,318 272,275 9,286,968<br />
Non-liquid operating items 1 4,965 1,466 295 0 1,528 8,255<br />
Capital expenditures of the year 1,156,964 7,724 62,736 2,897 75,399 8,751 1,314,471<br />
Assets held for sale, see Note 35 10,984 0 0 0 0 0 10,984<br />
Liabilities 2,914,579 249,547 1,074,490 197,256 224,174 950,124 5,610,170<br />
Note 2 continued on the next page >>>