100 NOTEs <strong>DFDS</strong> annual report 2009 >>> Note 28 continued Parent Company EXPECTED FUTURE TRANSACTIONS HEDGE INSTRUMENT TIME TO MATURITY NOTIONAL PRINCIPAL AMOUNT EXPECTED TIMING OF RECYCLING TO PROFIT AND LOSS OF GAINS/LOSSES RECOGNISED IN THE EQUITY 0-1 YEAR 1-3 YEARS 3-5 YEARS MORE THAN 5 YEARS FAIR VALUE 2007 Goods purchased and sold Forward exchange contracts 0-2 years 1,456,509 -12,443 -12,443 Interest Interest swaps 0-10 years 962,000 4,113 6,653 3,508 2,960 17,505 Interest Interest swaps 0-10 years 899,200 -4,985 -9,970 -9,970 -7,968 -32,953 -13,315 -3,317 -6,462 -5,008 -27,891 2008 Goods purchased and sold Forward exchange contracts 0-2 years 247,533 26,093 26,108 Interest Interest swaps 0-7 years 445,000 902 301 1,257 Interest Interest swaps 0-7 years 2,153,668 -12,021 -24,199 -22,222 -6,901 -65,355 Goods purchased Oil contract for forward delivery (tons) 0-6 months 84,000 -35,472 -35,472 -20,498 -23,898 -22,222 -6,901 -73,462 2009 Interest Interest swaps 0-6 years 1,174,963 -16,529 -31,320 -21,672 -915 -74,745 Goods purchased Oil contract for forward delivery (tons) 0-6 months 12,000 10,420 10,420 -6,109 -31,320 -21,672 -915 -64,325 For 2009 DKK -4.3 million (2008 DKK 0.0 million, 2007: DKK 0.2 million) is recognised in the income statement due to inefficiency in hedging of expected future transactions. The fair values have been calculated by discounting the expected future interest payments. The discount rate for each interest payment is estimated on the basis of a swap interest curve, which is calculated based on a wide spread of market interest rates. The fair values have been calculated by discounting the expected future interest payments. The discount rate for each interest payment is estimated basis a swap interest curve, which is calculated based on a wide spread of market interest rates. The fair values on forward contracts are based on interest curve calculations in <strong>DFDS</strong> treasury system. Calculations are based on a spread of market interest rates in the various currencies. Calculation on Oil contracts are based on Morgan Stanley’s quoted forward curve. Operational risks Operational risks arise from the cash flow transactions. The size of the transactions made through the financial year is affected by the change in different market rates such as interest and foreign exchange rates. Currency risks are monitored continuously throughout the year to ensure compliance with the financial risk management policy. Currency cash flow risks Approximately 79% of <strong>DFDS</strong>’ revenues are invoiced in unhedged foreign currencies (2008: 79%, 2007: 76%) with the most substantial net income currencies being SEK and NOK. USD was the most substantial net expense currency. EUR is considered as minor risk bearing due to the currency peg. For other entities than the Parent Company the currencies used are primarily their functional currency. The table below shows the unhedged currency cash flow exposure. Parent Company DKK ‘000 Consolidated DKK ‘000 2007 2008 2009 2007 2008 2009 Profit or loss effect of reasonable possible change against DKK -19.0 -42.4 -21.2 SEK, profit or loss effect, 10% weakening (2008: 10%, 2007: 10%) -18.9 -42.2 -21.2 -5.4 -7.9 -7.7 NOK, profit or loss effect, 10% weakening (2008: 10%, 2007: 10%) -5.4 -7.9 -7.7 -1.5 -36.8 -41.5 USD, profit or loss effect, 10% strengthening (2008: 10%, 2007: 10%) -14.2 -62.8 -48.8 Oil risks The cost of bunkers constitutes a specific and significant operational risk partly due to large fluctuations in oil prices and partly due to the total annual bunker costs of approximately DKK 794 million or 12.1% of the Group’s turnover in 2009 (2008: DKK 1,298 million or 15.8% of the Group’s turnover, 2007: DKK 1,036 million or 12% of the Group’s turnover). In the freight sector, bunker costs are hedged by price-adjustment clauses in freight contracts. In the passenger sector, fluctuations in the cost of bunkers are reflected in the ticket price to the extent possible. In addition, hedging transactions, primarily oil swaps, are to some extent also used to manage risk. The bunker consumption in 2009 was approximately 402,000 tons (2008: 462,000 tons, 2007 477.000 tons). A rise of 10% in the price of bunker compared to the level at year-end 2009 would have meant increased costs for the Group of DKK 14.0 million (2008: DKK 14.3 million, 2007: DKK 21,9 million), and increased cost for the Parent Company of DKK 7.4 million (2008: DKK 6.9 million, 2007: 21,9 milllion).
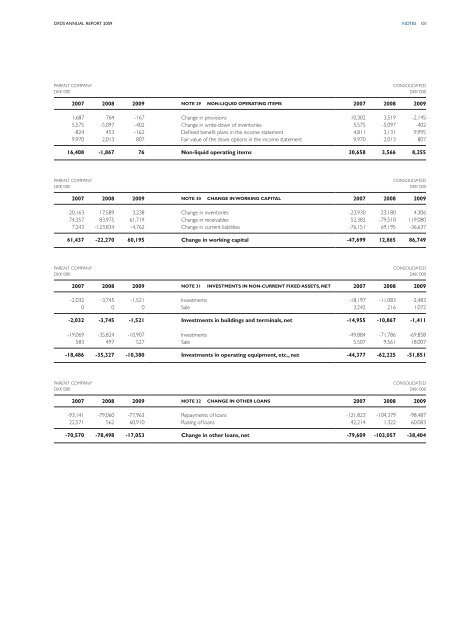
<strong>DFDS</strong> annual report 2009 NOTEs 101 Parent Company DKK ‘000 Consolidated DKK ‘000 2007 2008 2009 Note 29 Non-liquid operating items 2007 2008 2009 1,687 764 -167 Change in provisions 10,302 3,519 -2,145 5,575 -5,097 -402 Change in write-down of inventories 5,575 -5,097 -402 -824 453 -162 Defined benefit plans in the income statement 4,811 3,131 9,995 9,970 2,013 807 Fair value of the share options in the income statement 9,970 2,013 807 16,408 -1,867 76 Non-liquid operating items 30,658 3,566 8,255 Parent Company DKK ‘000 Consolidated DKK ‘000 2007 2008 2009 Note 30 Change in working capital 2007 2008 2009 -20,163 17,589 3,238 Change in inventories -23,930 23,180 4,306 74,357 83,975 61,719 Change in receivables 52,382 -79,510 119,080 7,243 -123,834 -4,762 Change in current liabilities -76,151 69,195 -36,637 61,437 -22,270 60,195 Change in working capital -47,699 12,865 86,749 Parent Company DKK ‘000 Consolidated DKK ‘000 2007 2008 2009 Note 31 Investments in non-current fixed assets, net 2007 2008 2009 -2,032 -3,745 -1,521 Investments -18,197 -11,083 -2,483 0 0 0 Sale 3,242 216 1,072 -2,032 -3,745 -1,521 Investments in buildings and terminals, net -14,955 -10,867 -1,411 -19,069 -35,824 -10,907 Investments -49,884 -71,786 -69,858 583 497 527 Sale 5,507 9,561 18,007 -18,486 -35,327 -10,380 Investments in operating equipment, etc., net -44,377 -62,225 -51,851 Parent Company DKK ‘000 Consolidated DKK ‘000 2007 2008 2009 Note 32 Change in other loans 2007 2008 2009 -93,141 -79,060 -77,963 Repayments of loans -121,823 -104,379 -98,487 22,571 562 60,910 Raising of loans 42,214 1,322 60,083 -70,570 -78,498 -17,053 Change in other loans, net -79,609 -103,057 -38,404