56 financial statement <strong>DFDS</strong> annual report 2009 Income statement Parent Company DKK ‘000 Consolidated DKK ‘000 2007 2008 2009 NOTE Income statement 2007 2008 2009 5,214,122 5,282,908 4,469,183 2,3 Revenue 8,310,249 8,193,586 6,555,483 Costs -2,642,137 -2,755,536 -2,123,027 4 Operating costs -4,435,445 -4,586,284 -3,391,541 -681,161 -801,254 -940,604 Charter hire -593,167 -690,289 -661,514 -674,790 -642,364 -578,254 5 Staff costs -1,529,088 -1,481,393 -1,325,628 -492,496 -473,855 -442,401 6 Other costs of operation, sales and administration -441,273 -424,150 -390,424 -4,490,584 -4,673,009 -4,084,286 Total costs -6,998,973 -7,182,116 -5,769,107 723,538 609,899 384,897 Operating profit before depreciation (EBITDA) 1,311,276 1,011,470 786,376 - - - 14 Share of profit/loss of associates 3,264 4,478 1,412 35,371 497 -14,838 7 Profit on disposal of tangible assets 36,844 45,370 17,617 11,12 Depreciation and impairment -274,212 -271,411 -262,894 Depreciation Ships -451,853 -436,954 -448,131 -42,757 -45,366 -50,979 Depreciation other non-current fixed assets -143,942 -134,758 -124,087 0 -4,413 -59,161 35 Impairment losses for ships and other non-current assets 0 -42,439 -60,650 0 0 0 Value adjustment of goodwill/negative goodwill 1,973 19,947 1,460 -316,969 -321,190 -373,034 Total depreciation and impairment -593,822 -594,204 -631,408 441,940 289,206 -2,975 Operating profit (EBIT) 757,562 467,114 173,997 74,702 88,779 200,099 8 Financial income 26,807 31,437 34,220 -217,544 -387,539 -161,948 8 Financial expenses -258,575 -277,619 -188,512 299,098 -9,554 35,176 Profit before tax 525,794 220,932 19,705 0 -10,481 -2,824 9 Tax on profit -114,097 32,145 69,123 299,098 -20,035 32,352 Profit for the year 411,697 253,077 88,828 Profit for the year is attributed to 299,098 -20,035 32,352 Equity holders of <strong>DFDS</strong> A/S 400,393 246,559 85,728 - - - Minority interest 11,304 6,518 3,100 299,098 -20,035 32,352 411,697 253,077 88,828 10 Earnings per share Basic earnings per share (EPS) of DKK 100 52.39 32.12 11.19 Diluted earnings per share (EPS-D) of DKK 100 52.01 32.08 11.19 Proposed profit appropriation 120,000 0 0 Proposed dividends, DKK 0.00 per share (2008: DKK 0.00 per share, 2007: DKK 15.00 per share) 179,098 -20,035 32,352 Retained earnings 299,098 -20,035 32,352
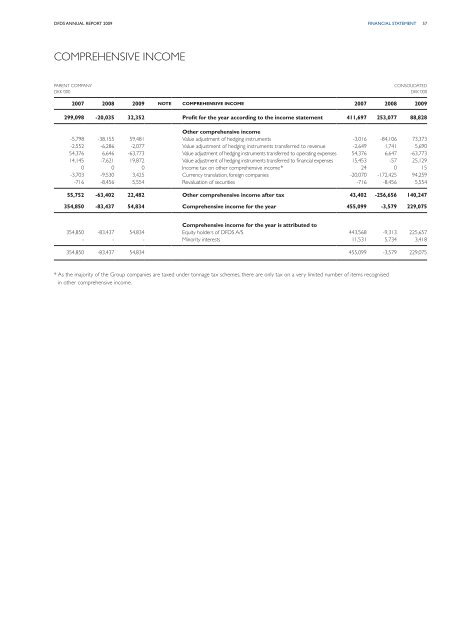
<strong>DFDS</strong> annual report 2009 financial statement 57 Comprehensive income Parent Company DKK ‘000 Consolidated DKK ‘000 2007 2008 2009 NOTE Comprehensive income 2007 2008 2009 299,098 -20,035 32,352 Profit for the year according to the income statement 411,697 253,077 88,828 Other comprehensive income -5,798 -38,155 59,481 Value adjustment of hedging instruments -3,016 -84,106 73,373 -2,552 -6,286 -2,077 Value adjustment of hedging instruments transferred to revenue -2,649 1,741 5,690 54,376 6,646 -63,773 Value adjustment of hedging instruments transferred to operating expenses 54,376 6,647 -63,773 14,145 -7,621 19,872 Value adjustment of hedging instruments transferred to financial expenses 15,453 -57 25,129 0 0 0 Income tax on other comprehensive income * 24 0 15 -3,703 -9,530 3,425 Currency translation, foreign companies -20,070 -172,425 94,259 -716 -8,456 5,554 Revaluation of securities -716 -8,456 5,554 55,752 -63,402 22,482 Other comprehensive income after tax 43,402 -256,656 140,247 354,850 -83,437 54,834 Comprehensive income for the year 455,099 -3,579 229,075 Comprehensive income for the year is attributed to 354,850 -83,437 54,834 Equity holders of <strong>DFDS</strong> A/S 443,568 -9,313 225,657 - - - Minority interests 11,531 5,734 3,418 354,850 -83,437 54,834 455,099 -3,579 229,075 * As the majority of the Group companies are taxed under tonnage tax schemes, there are only tax on a very limited number of items recognised in other comprehensive income.