

CEWG January 09 Full Report - National Institute on Drug Abuse
CEWG January 09 Full Report - National Institute on Drug Abuse
CEWG January 09 Full Report - National Institute on Drug Abuse

Create successful ePaper yourself
Turn your PDF publications into a flip-book with our unique Google optimized e-Paper software.
58.9<br />
17.5<br />
1.8 1.5<br />
EpidEmiologic TrEnds in drug AbusE: HigHligHTs And ExEcuTivE summAry<br />
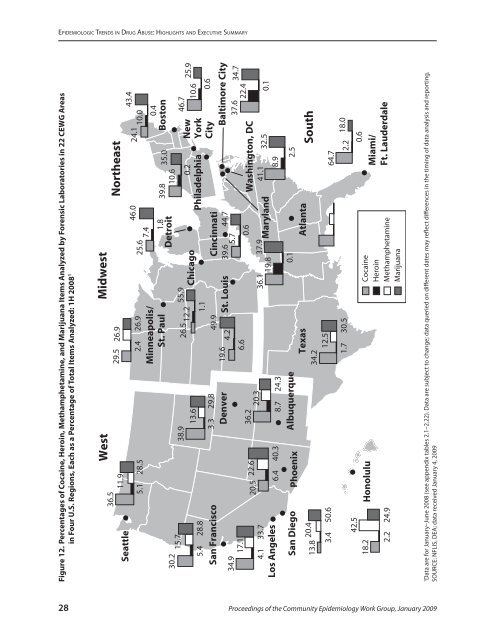
Figure 12. Percentages of Cocaine, Heroin, Methamphetamine, and Marijuana Items Analyzed by Forensic Laboratories in 22 <str<strong>on</strong>g>CEWG</str<strong>on</strong>g> Areas<br />
in Four U.S. Regi<strong>on</strong>s, Each as a Percentage of Total Items Analyzed: 1H 2008 1<br />
Seattle<br />
30.2<br />
34.9<br />
15.7<br />
5.4 28.8<br />
San Francisco<br />
17.1<br />
4.1 33.7<br />
Los Angeles<br />
San Diego<br />
13.8<br />
18.2<br />
20.4<br />
3.4 50.6<br />
42.5<br />
2.2 24.9<br />
36.5<br />
11.9<br />
5.1 28.5<br />
20.5<br />
22.6<br />
6.4<br />
Phoenix<br />
H<strong>on</strong>olulu<br />
West Midwest<br />
40.3<br />
38.9<br />
13.6<br />
3.3 29.8<br />
Denver<br />
36.2<br />
20.3<br />
8.7 24.3<br />
Albuquerque<br />
29.5 26.9<br />
2.4<br />
Minneapolis/<br />
St. Paul<br />
19.6<br />
6.6<br />
Texas<br />
34.2<br />
12.5<br />
26.9<br />
26.5<br />
4.2<br />
49.9<br />
1.7 30.5<br />
12.2<br />
1.1<br />
55.9<br />
St. Louis<br />
Chicago<br />
36.1<br />
19.8<br />
25.6<br />
1.8<br />
Detroit<br />
46.0<br />
Cincinnati<br />
39.6 44.7<br />
5.7<br />
0.6<br />
37.9<br />
Maryland<br />
0.1<br />
7.4<br />
Atlanta<br />
Cocaine<br />
Heroin<br />
Methamphetamine<br />
Marijuana<br />
Northeast<br />
39.8<br />
10.6<br />
35.0<br />
0.2<br />
Philadelphia<br />
24.1<br />
0.4<br />
Bost<strong>on</strong><br />
New<br />
York<br />
City<br />
10.0<br />
Baltimore City<br />
37.6 34.7<br />
22.4<br />
Washingt<strong>on</strong>, DC<br />
41.1<br />
32.5 0.1<br />
8.9<br />
2.5<br />
64.7<br />
2.2<br />
South<br />
0.6<br />
18.0<br />
Miami/<br />
Ft. Lauderdale<br />
43.4<br />
46.7<br />
10.6<br />
0.6<br />
25.9<br />
1 Data are for <str<strong>on</strong>g>January</str<strong>on</strong>g>–June 2008 (see appendix tables 2.1–2.22). Data are subject to change; data queried <strong>on</strong> diff erent dates may reflect diff erences in the timing of data analysis and reporting.<br />
SOURCE: NFLIS, DEA; data received <str<strong>on</strong>g>January</str<strong>on</strong>g> 4, 20<str<strong>on</strong>g>09</str<strong>on</strong>g><br />
28 Proceedings of the Community Epidemiology Work Group, <str<strong>on</strong>g>January</str<strong>on</strong>g> 20<str<strong>on</strong>g>09</str<strong>on</strong>g>


