

CEWG January 09 Full Report - National Institute on Drug Abuse
CEWG January 09 Full Report - National Institute on Drug Abuse
CEWG January 09 Full Report - National Institute on Drug Abuse

You also want an ePaper? Increase the reach of your titles
YUMPU automatically turns print PDFs into web optimized ePapers that Google loves.
Secti<strong>on</strong> IV. Across <str<strong>on</strong>g>CEWG</str<strong>on</strong>g> Areas: Treatment Admissi<strong>on</strong>s, Forensic Laboratory Analysis Data, and Average <strong>Drug</strong> Price and Purity Data<br />
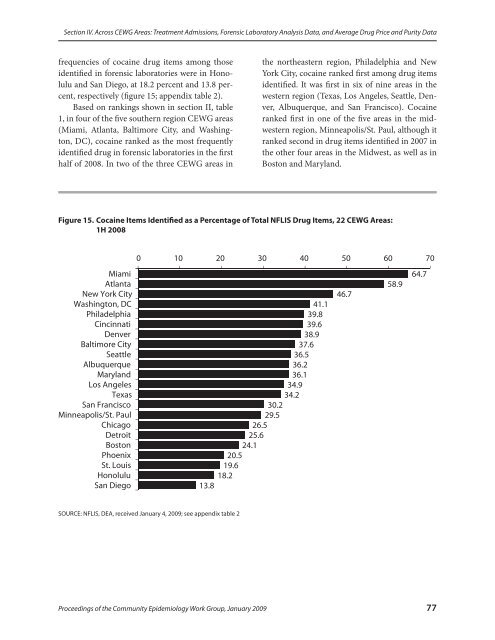
frequencies of cocaine drug items am<strong>on</strong>g those<br />
identified in forensic laboratories were in H<strong>on</strong>olulu<br />
and San Diego, at 18.2 percent and 13.8 percent,<br />
respectively (figure 15; appendix table 2).<br />
Based <strong>on</strong> rankings shown in secti<strong>on</strong> II, table<br />
1, in four of the five southern regi<strong>on</strong> <str<strong>on</strong>g>CEWG</str<strong>on</strong>g> areas<br />
(Miami, Atlanta, Baltimore City, and Washingt<strong>on</strong>,<br />
DC), cocaine ranked as the most frequently<br />
identified drug in forensic laboratories in the first<br />
half of 2008. In two of the three <str<strong>on</strong>g>CEWG</str<strong>on</strong>g> areas in<br />
the northeastern regi<strong>on</strong>, Philadelphia and New<br />
York City, cocaine ranked first am<strong>on</strong>g drug items<br />
identified. It was first in six of nine areas in the<br />
western regi<strong>on</strong> (Texas, Los Angeles, Seattle, Denver,<br />
Albuquerque, and San Francisco). Cocaine<br />
ranked first in <strong>on</strong>e of the five areas in the midwestern<br />
regi<strong>on</strong>, Minneapolis/St. Paul, although it<br />
ranked sec<strong>on</strong>d in drug items identified in 2007 in<br />
the other four areas in the Midwest, as well as in<br />
Bost<strong>on</strong> and Maryland.<br />
Figure 15. Cocaine Items Identified as a Percentage of Total NFLIS <strong>Drug</strong> Items, 22 <str<strong>on</strong>g>CEWG</str<strong>on</strong>g> Areas:<br />
1H 2008<br />
0 10 20 30 40 50 60 70<br />
Miami 64.7<br />
Atlanta 58.9<br />
New York City 46.7<br />
Washingt<strong>on</strong>, DC 41.1<br />
Philadelphia 39.8<br />
Cincinnati 39.6<br />
Denver 38.9<br />
Baltimore City 37.6<br />
Seattle 36.5<br />
Albuquerque 36.2<br />
Maryland 36.1<br />
Los Angeles 34.9<br />
Texas 34.2<br />
San Francisco 30.2<br />
Minneapolis/St. Paul 29.5<br />
Chicago 26.5<br />
Detroit 25.6<br />
Bost<strong>on</strong> 24.1<br />
Phoenix 20.5<br />
St. Louis 19.6<br />
H<strong>on</strong>olulu 18.2<br />
San Diego 13.8<br />
SOURCE: NFLIS, DEA, received <str<strong>on</strong>g>January</str<strong>on</strong>g> 4, 20<str<strong>on</strong>g>09</str<strong>on</strong>g>; see appendix table 2<br />
Proceedings of the Community Epidemiology Work Group, <str<strong>on</strong>g>January</str<strong>on</strong>g> 20<str<strong>on</strong>g>09</str<strong>on</strong>g> 77


