

CEWG January 09 Full Report - National Institute on Drug Abuse
CEWG January 09 Full Report - National Institute on Drug Abuse
CEWG January 09 Full Report - National Institute on Drug Abuse

Create successful ePaper yourself
Turn your PDF publications into a flip-book with our unique Google optimized e-Paper software.
EpidEmiologic TrEnds in drug AbusE: HigHligHTs And ExEcuTivE summAry<br />
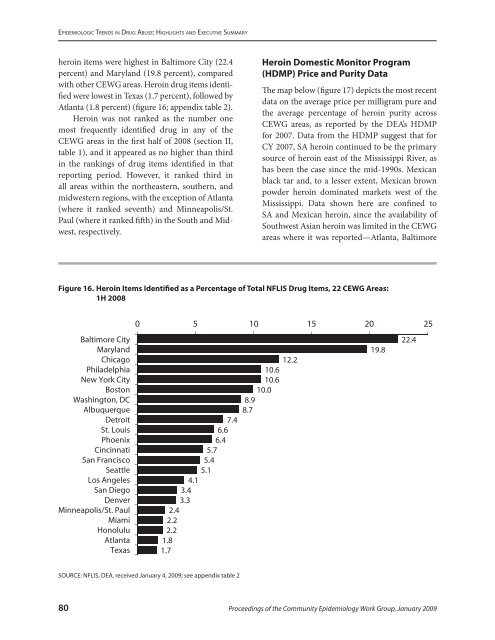
heroin items were highest in Baltimore City (22.4<br />
percent) and Maryland (19.8 percent), compared<br />
with other <str<strong>on</strong>g>CEWG</str<strong>on</strong>g> areas. Heroin drug items identified<br />
were lowest in Texas (1.7 percent), followed by<br />
Atlanta (1.8 percent) (figure 16; appendix table 2).<br />
Heroin was not ranked as the number <strong>on</strong>e<br />
most frequently identified drug in any of the<br />
<str<strong>on</strong>g>CEWG</str<strong>on</strong>g> areas in the first half of 2008 (secti<strong>on</strong> II,<br />
table 1), and it appeared as no higher than third<br />
in the rankings of drug items identified in that<br />
reporting period. However, it ranked third in<br />
all areas within the northeastern, southern, and<br />
midwestern regi<strong>on</strong>s, with the excepti<strong>on</strong> of Atlanta<br />
(where it ranked seventh) and Minneapolis/St.<br />
Paul (where it ranked fifth) in the South and Midwest,<br />
respectively.<br />
Heroin Domestic M<strong>on</strong>itor Program<br />
(HDMP) Price and Purity Data<br />
The map below (figure 17) depicts the most recent<br />
data <strong>on</strong> the average price per milligram pure and<br />
the average percentage of heroin purity across<br />
<str<strong>on</strong>g>CEWG</str<strong>on</strong>g> areas, as reported by the DEA’s HDMP<br />
for 2007. Data from the HDMP suggest that for<br />
CY 2007, SA heroin c<strong>on</strong>tinued to be the primary<br />
source of heroin east of the Mississippi River, as<br />
has been the case since the mid-1990s. Mexican<br />
black tar and, to a lesser extent, Mexican brown<br />
powder heroin dominated markets west of the<br />
Mississippi. Data shown here are c<strong>on</strong>fined to<br />
SA and Mexican heroin, since the availability of<br />
Southwest Asian heroin was limited in the <str<strong>on</strong>g>CEWG</str<strong>on</strong>g><br />
areas where it was reported—Atlanta, Baltimore<br />
Figure 16. Heroin Items Identified as a Percentage of Total NFLIS <strong>Drug</strong> Items, 22 <str<strong>on</strong>g>CEWG</str<strong>on</strong>g> Areas:<br />
1H 2008<br />
Baltimore City<br />
Maryland<br />
Chicago<br />
Philadelphia<br />
New York City<br />
Bost<strong>on</strong><br />
Washingt<strong>on</strong>, DC<br />
Albuquerque<br />
Detroit<br />
St. Louis<br />
Phoenix<br />
Cincinnati<br />
San Francisco<br />
Seattle<br />
Los Angeles<br />
San Diego<br />
Denver<br />
Minneapolis/St. Paul<br />
Miami<br />
H<strong>on</strong>olulu<br />
Atlanta<br />
Texas<br />
0 5 10 15 20 25<br />
7.4<br />
6.6<br />
6.4<br />
5.7<br />
5.4<br />
5.1<br />
4.1<br />
3.4<br />
3.3<br />
2.4<br />
2.2<br />
2.2<br />
1.8<br />
1.7<br />
10.6<br />
10.6<br />
10.0<br />
8.9<br />
8.7<br />
12.2<br />
19.8<br />
22.4<br />
SOURCE: NFLIS, DEA, received <str<strong>on</strong>g>January</str<strong>on</strong>g> 4, 20<str<strong>on</strong>g>09</str<strong>on</strong>g>; see appendix table 2<br />
80<br />
Proceedings of the Community Epidemiology Work Group, <str<strong>on</strong>g>January</str<strong>on</strong>g> 20<str<strong>on</strong>g>09</str<strong>on</strong>g>


