2011 Annual Report - the solid group inc website
2011 Annual Report - the solid group inc website
2011 Annual Report - the solid group inc website

You also want an ePaper? Increase the reach of your titles
YUMPU automatically turns print PDFs into web optimized ePapers that Google loves.
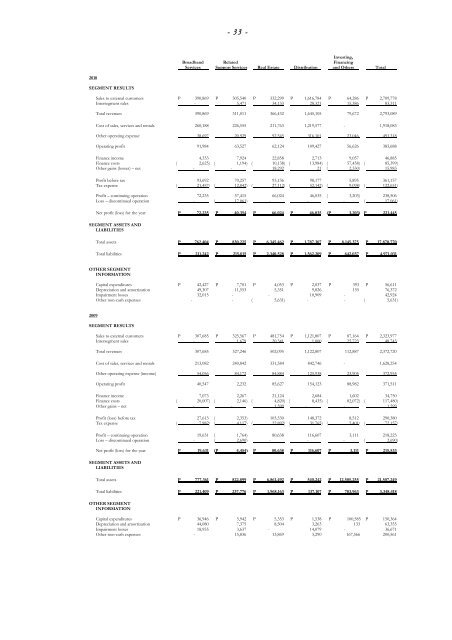
- 33 -<br />
Investing,<br />
Broadband Related Financing<br />
Services Support Services Real Estate Distribution and O<strong>the</strong>rs Total<br />
2010<br />
SEGMENT RESULTS<br />
Sales to external customers P 390,869 P 305,540 P 332,299 P 1,616,784 P 64,286 P 2,709,778<br />
Intersegment sales - 5,471 34,133 28,321 15,386 83,311<br />
Total revenues 390,869 311,011 366,432 1,645,105 79,672 2,793,089<br />
Cost of sales, services and rentals 260,188 226,555 211,763 1,219,577 - 1,918,083<br />
O<strong>the</strong>r operating expense 38,697 20,929 92,545 316,101 23,046 491,318<br />
Operating profit 91,984 63,527 62,124 109,427 56,626 383,688<br />
Finance <strong>inc</strong>ome 4,333 7,924 22,858 2,713 9,057 46,885<br />
Finance costs ( 2,625 ) ( 1,194 ) ( 10,138 ) ( 13,984 ) ( 57,458 ) ( 85,399 )<br />
O<strong>the</strong>r gains (losses) – net - - 18,292 21 ( 2,330 ) 15,983<br />
Profit before tax 93,692 70,257 93,136 98,177 5,895 361,157<br />
Tax expense ( 21,457 ) ( 12,842 ) ( 27,112 ) ( 52,142 ) ( 9,098 ) ( 122,651 )<br />
Profit – continuing operation 72,235 57,415 66,024 46,035 ( 3,203 ) 238,506<br />
Loss – discontinued operation - ( 17,061 ) - - - ( 17,061 )<br />
Net profit (loss) for <strong>the</strong> year P 72,235 P 40,354 P 66,024 P 46,035 ( P 3,203) P 221,445<br />
SEGMENT ASSETS AND<br />
LIABILITIES<br />
Total assets P 762,404 P 830,225 P 6,345,462 P 1,787,307 P 8,145,375 P 17,870,770<br />
Total liabilities P 211,242 P 215,015 P 2,340,528 P 1,562,209 P 642,037 P 4,971,031<br />
OTHER SEGMENT<br />
INFORMATION<br />
Capital expenditures P 42,427 P 7,701 P 4,053 P 2,037 P 393 P 56,611<br />
Depreciation and amortization 49,307 11,553 5,351 9,826 155 76,372<br />
Impairment losses 32,015 - - 10,909 - 42,924<br />
O<strong>the</strong>r non-cash expenses - - ( 5,631 ) - - ( 5,631 )<br />
2009<br />
SEGMENT RESULTS<br />
Sales to external customers P 307,685 P 325,567 P 481,754 P 1,121,807 P 87,164 P 2,323,977<br />
Intersegment sales - 1,679 20,341 1,000 25,723 48,743<br />
Total revenues 307,685 327,246 502,095 1,122,807 112,887 2,372,720<br />
Cost of sales, services and rentals 213,082 240,842 331,584 842,746 - 1,628,254<br />
O<strong>the</strong>r operating expense (<strong>inc</strong>ome) 54,056 84,172 84,884 125,938 23,905 372,955<br />
Operating profit 40,547 2,232 85,627 154,123 88,982 371,511<br />
Finance <strong>inc</strong>ome 7,073 2,267 21,124 2,684 1,602 34,750<br />
Finance costs ( 20,007 ) ( 2,146 ) ( 4,820 ) ( 8,435 ) ( 82,072 ) ( 117,480 )<br />
O<strong>the</strong>r gains – net - - 1,599 - - 1,599<br />
Profit (loss) before tax 27,613 ( 2,353 ) 103,530 148,372 8,512 290,380<br />
Tax expense ( 7,982 ) ( 4,117 ) ( 22,892 ) ( 31,765 ) ( 5,401 ) ( 72,157 )<br />
Profit – continuing operation 19,631 ( 1,764 ) 80,638 116,607 3,111 218,223<br />
Loss – discontinued operation - ( 2,690 ) - - - ( 2,690 )<br />
Net profit (loss) for <strong>the</strong> year P 19,631 ( P 4,454) P 80,638 P 116,607 P 3,111 P 215,533<br />
SEGMENT ASSETS AND<br />
LIABILITIES<br />
Total assets P 777,361 P 822,899 P 6,861,492 P 540,242 P 12,505,255 P 21,507,249<br />
Total liabilities P 221,409 P 237,776 P 1,968,163 P 137,107 P 783,963 P 3,348,418<br />
OTHER SEGMENT<br />
INFORMATION<br />
Capital expenditures P 36,946 P 5,942 P 5,353 P 1,538 P 100,585 P 150,364<br />
Depreciation and amortization 44,080 7,375 8,504 3,263 133 63,355<br />
Impairment losses 18,955 3,637 - 14,079 - 36,671<br />
O<strong>the</strong>r non-cash expenses - 15,836 13,869 3,290 167,566 200,561