2011 Annual Report - the solid group inc website
2011 Annual Report - the solid group inc website
2011 Annual Report - the solid group inc website

Create successful ePaper yourself
Turn your PDF publications into a flip-book with our unique Google optimized e-Paper software.
75<br />
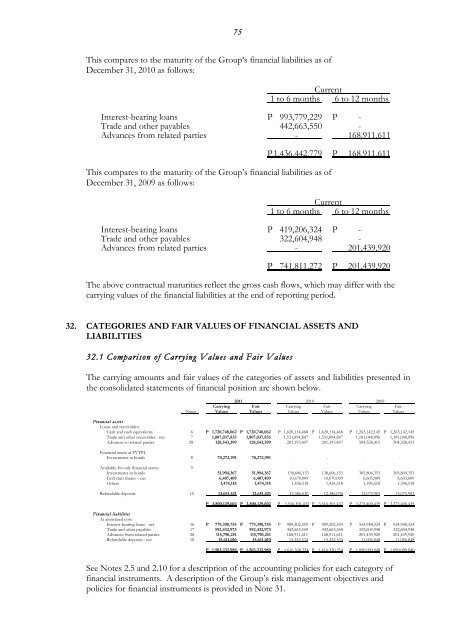
This compares to <strong>the</strong> maturity of <strong>the</strong> Group’s financial liabilities as of<br />
December 31, 2010 as follows:<br />
Current<br />
1 to 6 months 6 to 12 months<br />
Interest-bearing loans P 993,779,229 P -<br />
Trade and o<strong>the</strong>r payables 442,663,550 -<br />
Advances from related parties - 168,911,611<br />
P 1,436,442,779 P 168,911,611<br />
This compares to <strong>the</strong> maturity of <strong>the</strong> Group’s financial liabilities as of<br />
December 31, 2009 as follows:<br />
Current<br />
1 to 6 months 6 to 12 months<br />
Interest-bearing loans P 419,206,324 P -<br />
Trade and o<strong>the</strong>r payables 322,604,948 -<br />
Advances from related parties - 201,439,920<br />
P 741,811,272 P 201,439,920<br />
The above contractual maturities reflect <strong>the</strong> gross cash flows, which may differ with <strong>the</strong><br />
carrying values of <strong>the</strong> financial liabilities at <strong>the</strong> end of reporting period.<br />
32. CATEGORIES AND FAIR VALUES OF FINANCIAL ASSETS AND<br />
LIABILITIES<br />
32.1 Comparison of Carrying Values and Fair Values<br />
The carrying amounts and fair values of <strong>the</strong> categories of assets and liabilities presented in<br />
<strong>the</strong> con<strong>solid</strong>ated statements of financial position are shown below.<br />
<strong>2011</strong> 2010 2009<br />
Carrying Fair Carrying Fair Carrying Fair<br />
Notes Values Values Values Values Values Values<br />
Financial assets<br />
Loans and receivables:<br />
Cash and cash equivalents 6 P 1,720,748,062 P 1,720,748,062 P 1,620,114,468 P 1,620,114,468 P 1,263,142,145 P 1,263,142,145<br />
Trade and o<strong>the</strong>r receivables - net 7 1,807,037,835 1,807,037,835 1,531,894,847 1,531,894,847 1,181,048,096 1,181,048,096<br />
Advances to related parties 28 128,543,399 128,543,399 201,193,407 201,193,407 504,328,415 504,328,415<br />
Financial assets at FVTPL<br />
Investments in bonds 8 70,272,991 70,272,991 - - - -<br />
Available-for-sale financial assets: 9<br />
Investments in bonds 51,994,367 51,994,367 138,606,153 138,606,153 305,804,353 305,804,353<br />
Golf club shares – net 6,407,409 6,407,409 10,670,009 10,670,009 6,605,009 6,605,009<br />
O<strong>the</strong>rs 1,474,118 1,474,118 1,436,518 1,436,518 1,396,518 1,396,518<br />
Refundable deposits 15 13,651,421 13,651,421 12,386,030 12,386,030 13,075,903 13,075,903<br />
P 3,800,129,602 P 3,800,129,602 P 3,516,301,432 P 3,516,301,432 P 3,275,400,439 P 3,275,400,439<br />
Financial liabilities<br />
At amortized cost:<br />
Interest-bearing loans - net 16 P 779,398,755 P 779,398,755 P 989,502,559 P 989,502,559 P 554,948,324 P 554,948,324<br />
Trade and o<strong>the</strong>r payables 17 592,432,973 592,432,973 442,663,550 442,663,550 322,604,948 322,604,948<br />
Advances from related parties 28 115,790,251 115,790,251 168,911,611 168,911,611 201,439,920 201,439,920<br />
Refundable deposits - net 18 15,611,010 15,611,010 15,252,534 15,252,534 11,096,848 11,096,848<br />
P 1,503,232,989 P 1,503,232,989 P 1,616,330,254 P 1,616,330,254 P 1,090,090,040 P 1,090,090,040<br />
See Notes 2.5 and 2.10 for a description of <strong>the</strong> accounting policies for each category of<br />
financial instruments. A description of <strong>the</strong> Group’s risk management objectives and<br />
policies for financial instruments is provided in Note 31.