2011 Annual Report - the solid group inc website
2011 Annual Report - the solid group inc website
2011 Annual Report - the solid group inc website

Create successful ePaper yourself
Turn your PDF publications into a flip-book with our unique Google optimized e-Paper software.
54<br />
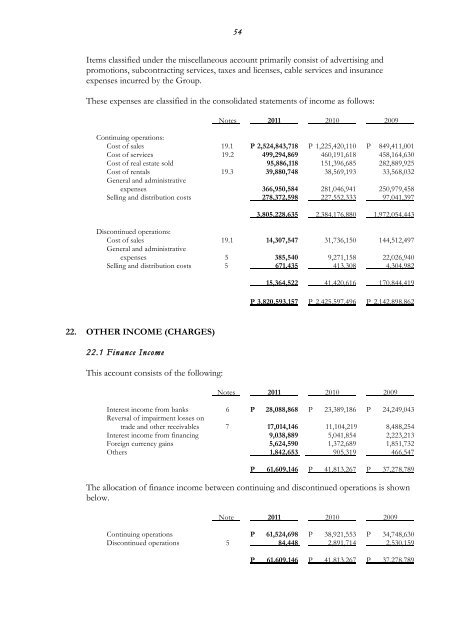
Items classified under <strong>the</strong> miscellaneous account primarily consist of advertising and<br />
promotions, subcontracting services, taxes and licenses, cable services and insurance<br />
expenses <strong>inc</strong>urred by <strong>the</strong> Group.<br />
These expenses are classified in <strong>the</strong> con<strong>solid</strong>ated statements of <strong>inc</strong>ome as follows:<br />
Notes <strong>2011</strong> 2010 2009<br />
Continuing operations:<br />
Cost of sales 19.1 P 2,524,843,718 P 1,225,420,110 P 849,411,001<br />
Cost of services 19.2 499,294,869 460,191,618 458,164,630<br />
Cost of real estate sold 95,886,118 151,396,685 282,889,925<br />
Cost of rentals 19.3 39,880,748 38,569,193 33,568,032<br />
General and administrative<br />
expenses 366,950,584 281,046,941 250,979,458<br />
Selling and distribution costs 278,372,598 227,552,333 97,041,397<br />
3,805,228,635 2,384,176,880 1,972,054,443<br />
Discontinued operations:<br />
Cost of sales 19.1 14,307,547 31,736,150 144,512,497<br />
General and administrative<br />
expenses 5 385,540 9,271,158 22,026,940<br />
Selling and distribution costs 5 671,435 413,308 4,304,982<br />
15,364,522 41,420,616 170,844,419<br />
P 3,820,593,157 P 2,425,597,496 P 2,142,898,862<br />
22. OTHER INCOME (CHARGES)<br />
22.1 Finance Income<br />
This account consists of <strong>the</strong> following:<br />
Notes <strong>2011</strong> 2010 2009<br />
Interest <strong>inc</strong>ome from banks 6 P 28,088,868 P 23,389,186 P 24,249,043<br />
Reversal of impairment losses on<br />
trade and o<strong>the</strong>r receivables 7 17,014,146 11,104,219 8,488,254<br />
Interest <strong>inc</strong>ome from financing 9,038,889 5,041,854 2,223,213<br />
Foreign currency gains 5,624,590 1,372,689 1,851,732<br />
O<strong>the</strong>rs 1,842,653 905,319 466,547<br />
P 61,609,146 P 41,813,267 P 37,278,789<br />
The allocation of finance <strong>inc</strong>ome between continuing and discontinued operations is shown<br />
below.<br />
Note <strong>2011</strong> 2010 2009<br />
Continuing operations P 61,524,698 P 38,921,553 P 34,748,630<br />
Discontinued operations 5 84,448 2,891,714 2,530,159<br />
P 61,609,146 P 41,813,267 P 37,278,789