2011 Annual Report - the solid group inc website
2011 Annual Report - the solid group inc website
2011 Annual Report - the solid group inc website

Create successful ePaper yourself
Turn your PDF publications into a flip-book with our unique Google optimized e-Paper software.
52<br />
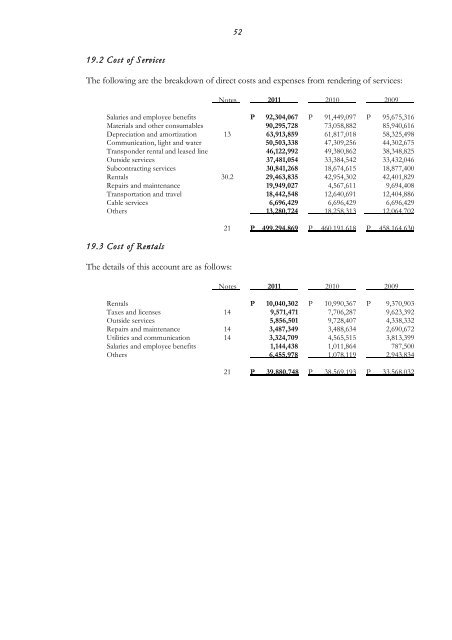
19.2 Cost of Services<br />
The following are <strong>the</strong> breakdown of direct costs and expenses from rendering of services:<br />
Notes <strong>2011</strong> 2010 2009<br />
Salaries and employee benefits P 92,304,067 P 91,449,097 P 95,675,316<br />
Materials and o<strong>the</strong>r consumables 90,295,728 73,058,882 85,940,616<br />
Depreciation and amortization 13 63,913,859 61,817,018 58,325,498<br />
Communication, light and water 50,503,338 47,309,256 44,302,675<br />
Transponder rental and leased line 46,122,992 49,380,862 38,348,825<br />
Outside services 37,481,054 33,384,542 33,432,046<br />
Subcontracting services 30,841,268 18,674,615 18,877,400<br />
Rentals 30.2 29,463,835 42,954,302 42,401,829<br />
Repairs and maintenance 19,949,027 4,567,611 9,694,408<br />
Transportation and travel 18,442,548 12,640,691 12,404,886<br />
Cable services 6,696,429 6,696,429 6,696,429<br />
O<strong>the</strong>rs 13,280,724 18,258,313 12,064,702<br />
19.3 Cost of Rentals<br />
The details of this account are as follows:<br />
21 P 499,294,869 P 460,191,618 P 458,164,630<br />
Notes <strong>2011</strong> 2010 2009<br />
Rentals P 10,040,302 P 10,990,367 P 9,370,903<br />
Taxes and licenses 14 9,571,471 7,706,287 9,623,392<br />
Outside services 5,856,501 9,728,407 4,338,332<br />
Repairs and maintenance 14 3,487,349 3,488,634 2,690,672<br />
Utilities and communication 14 3,324,709 4,565,515 3,813,399<br />
Salaries and employee benefits 1,144,438 1,011,864 787,500<br />
O<strong>the</strong>rs 6,455,978 1,078,119 2,943,834<br />
21 P 39,880,748 P 38,569,193 P 33,568,032