Comparative day/night metatranscriptomic analysis of microbial ...
Comparative day/night metatranscriptomic analysis of microbial ...
Comparative day/night metatranscriptomic analysis of microbial ...

Create successful ePaper yourself
Turn your PDF publications into a flip-book with our unique Google optimized e-Paper software.
1362 R. S. Poretsky et al.<br />
A<br />
16S rRNA<br />
genes<br />
mRNA<br />
B<br />
16S rRNA<br />
genes<br />
mRNA<br />
Och 114 and Silicibacter sp. TM1040 (Table 1 and Fig. 4).<br />
These assignments do not imply that these actual species<br />
were present at the time <strong>of</strong> sample collection, but rather<br />
they represent the best current sequence matches for<br />
some <strong>of</strong> the more abundant environmental transcripts.<br />
Transcriptome coverage<br />
Cyanobacteria<br />
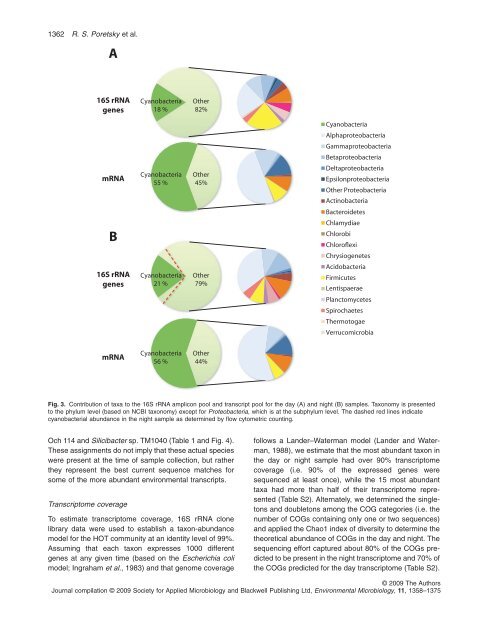
18 %<br />
Cyanobacteria<br />
55 %<br />
Cyanobacteria<br />
21 %<br />
Cyanobacteria<br />
56 %<br />
Other<br />
82%<br />
Other<br />
45%<br />
Other<br />
79%<br />
Other<br />
44%<br />
To estimate transcriptome coverage, 16S rRNA clone<br />
library data were used to establish a taxon-abundance<br />
model for the HOT community at an identity level <strong>of</strong> 99%.<br />
Assuming that each taxon expresses 1000 different<br />
genes at any given time (based on the Escherichia coli<br />
model; Ingraham et al., 1983) and that genome coverage<br />
Cyanobacteria<br />
Alphaproteobacteria<br />
Gammaproteobacteria<br />
Betaproteobacteria<br />
Deltaproteobacteria<br />
Epsilonproteobacteria<br />
Other Proteobacteria<br />
Actinobacteria<br />
Bacteroidetes<br />
Chlamydiae<br />
Chlorobi<br />
Chlor<strong>of</strong>lexi<br />
Chrysiogenetes<br />
Acidobacteria<br />
Firmicutes<br />
Lentispaerae<br />
Planctomycetes<br />
Spirochaetes<br />
Thermotogae<br />
Verrucomicrobia<br />
Fig. 3. Contribution <strong>of</strong> taxa to the 16S rRNA amplicon pool and transcript pool for the <strong>day</strong> (A) and <strong>night</strong> (B) samples. Taxonomy is presented<br />
to the phylum level (based on NCBI taxonomy) except for Proteobacteria, which is at the subphylum level. The dashed red lines indicate<br />
cyanobacterial abundance in the <strong>night</strong> sample as determined by flow cytometric counting.<br />
follows a Lander–Waterman model (Lander and Waterman,<br />
1988), we estimate that the most abundant taxon in<br />
the <strong>day</strong> or <strong>night</strong> sample had over 90% transcriptome<br />
coverage (i.e. 90% <strong>of</strong> the expressed genes were<br />
sequenced at least once), while the 15 most abundant<br />
taxa had more than half <strong>of</strong> their transcriptome represented<br />
(Table S2). Alternately, we determined the singletons<br />
and doubletons among the COG categories (i.e. the<br />
number <strong>of</strong> COGs containing only one or two sequences)<br />
and applied the Chao1 index <strong>of</strong> diversity to determine the<br />
theoretical abundance <strong>of</strong> COGs in the <strong>day</strong> and <strong>night</strong>. The<br />
sequencing effort captured about 80% <strong>of</strong> the COGs predicted<br />
to be present in the <strong>night</strong> transcriptome and 70% <strong>of</strong><br />
the COGs predicted for the <strong>day</strong> transcriptome (Table S2).<br />
© 2009 The Authors<br />
Journal compilation © 2009 Society for Applied Microbiology and Blackwell Publishing Ltd, Environmental Microbiology, 11, 1358–1375