Natomas Levee Improvement Program - SAFCA
Natomas Levee Improvement Program - SAFCA
Natomas Levee Improvement Program - SAFCA

You also want an ePaper? Increase the reach of your titles
YUMPU automatically turns print PDFs into web optimized ePapers that Google loves.
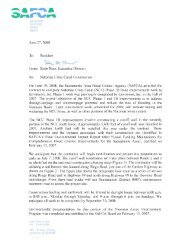
3.6.8 Summary – Reach F<br />
When totaled, the cost estimates for each of the project accounts described above result in the USACE estimate for the NED Plan<br />
being approximately $21 million higher than the <strong>SAFCA</strong> estimate for the 200-year project in Reach F. Most of this difference is<br />
attributable to USACE’s much higher estimate for levee and floodwall construction. Table 6 provides a detailed comparison of the<br />
costs of the <strong>SAFCA</strong> 200-year project and the USACE NED Plan in this reach.<br />
Table 6: Reach F comparison of the <strong>SAFCA</strong> 200-year project and the USACE NED.<br />
200 Year<br />
Reach F<br />
Cost<br />
($)<br />
Cont.<br />
($)<br />
Cont.<br />
(%)<br />
Year<br />
Built<br />
Escalation<br />
Total<br />
($)<br />
Cost<br />
($)<br />
USACE ‐ NED<br />
Fish & Wildlife Facilities $2,039,387 $164,016 $0 $2,203,403 $0 $0<br />
Mitigation Site Development $568,650 $56,865 10% $625,515<br />
Long‐Term Management $399,224 $0 0% $399,224<br />
Land Acquisition $1,071,513 $107,151 10% $1,178,664<br />
<strong>Levee</strong>s & Floodwalls $15,211,225 $4,180,988 $1,921,861 $21,314,073 $35,245,000 $11,261,000 32% $46,506,000<br />
<strong>Levee</strong> <strong>Improvement</strong>s $9,595,325 $2,878,598 30% 2014 $1,236,225 $13,710,148<br />
Borrow Site Development $3,704,000 $1,111,200 30% 2014 $477,209 $5,292,409<br />
Borrow Land/Royalty $1,911,900 $191,190 10% 2014 $208,426 $2,311,516<br />
Internal Drainage Pumping Plants $0 $0 30% $0 $0 $0 25% $0<br />
Subtotal Cons. Costs $17,250,612 $4,345,004 $1,921,861 $23,517,477 $35,245,000 $11,261,000 32% $46,506,000<br />
Lands & Dam., Real Estate $8,709,250 $870,925 10% 2014 $949,441 $10,529,616 $9,220,000 $4,547,000 49% $13,767,000<br />
Lands & Dam., Admn $3,912,305 $391,231 2013 $279,833 $4,583,369 $279,000 $42,000 15% $321,000<br />
Relocations $8,777,500 $2,633,250 $1,130,860 $12,541,610 $9,006,000 $2,939,000 33% $11,945,000<br />
Riego Road Canal $191,000 $57,300 30% 2014 $24,608 $272,908<br />
Utility, Roadway & Bridge Relocations $7,471,700 $2,241,510 30% 2014 $962,625 $10,675,835<br />
Private Irrigation Relocation $1,114,800 $334,440 30% 2014 $143,627 $1,592,867<br />
Planning, Engr., & Design $5,893,770 $1,649,065 2012 $241,371 $7,784,205 $8,050,000 $929,000 12% $8,979,000<br />
Cultural Resources $345,012 $86,900 2012 $13,821 $445,734<br />
Construction Management $3,683,606 $1,030,665 2015 $633,014 $5,347,286 $3,541,000 $1,136,000 32% $4,677,000<br />
Total Reach F $48,572,056 $11,007,039 $5,170,201 $64,749,296 $65,341,000 $20,854,000 32% $86,195,000<br />
Cont.<br />
($)<br />
Cont.<br />
(%)<br />
Total<br />
($)<br />
30