LV power air circuit breakers and switch-disconnectors ... - Piti Group
LV power air circuit breakers and switch-disconnectors ... - Piti Group
LV power air circuit breakers and switch-disconnectors ... - Piti Group

Create successful ePaper yourself
Turn your PDF publications into a flip-book with our unique Google optimized e-Paper software.
Performance <strong>and</strong><br />
functionality<br />
Control units<br />
Micrologic P “<strong>power</strong>”<br />
3850A<br />
N<br />
100<br />
50<br />
0<br />
U 12 =<br />
U 23 =<br />
U 31 =<br />
U 1N =<br />
U 2N =<br />
U 3N =<br />
1 2 3<br />
Default display<br />
Uinst.<br />
F (Hz)<br />
60.0<br />
Trip<br />
history<br />
400V<br />
404V<br />
401V<br />
230V<br />
229V<br />
233V<br />
Display of a voltage<br />
Display of a frequency<br />
Ir<br />
03/08/1999<br />
Isd<br />
27/07/1999<br />
Umax<br />
30/06/1999<br />
Display of a tripping history<br />
I 1 = 4800A<br />
I 2 = 4600A<br />
I 3 = 4000A<br />
I N = 200A<br />
I = 13A<br />
P<br />
Q<br />
S<br />
Pdem<strong>and</strong><br />
Pdem<strong>and</strong>e<br />
PActive P (kW)<br />
2180 kW +2180<br />
Q<br />
Réactive<br />
(kVAR)<br />
Q<br />
- 650 kVAR -650<br />
S (kVA)<br />
Apparente +2280 S<br />
2280 kVA<br />
Trip<br />
03/08/1999<br />
12:02:36<br />
Ir =<br />
I 1 =<br />
I 2 =<br />
I 3 =<br />
Imax<br />
instant.<br />
Reset ( + / - )<br />
Display of a maximum<br />
current<br />
I N =<br />
Pinst.<br />
(kW)<br />
+2180<br />
(kVAR)<br />
-650<br />
(kVA)<br />
+2280<br />
Display of a <strong>power</strong><br />
Display of a dem<strong>and</strong> <strong>power</strong><br />
1000A<br />
1200A<br />
1430A<br />
1060A<br />
53A<br />
Display after tripping<br />
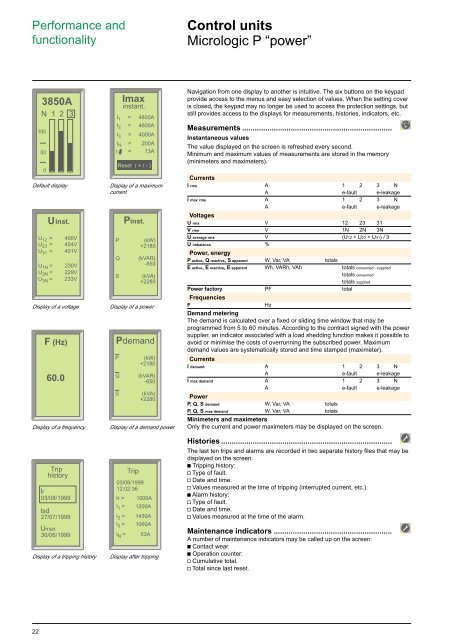
Navigation from one display to another is intuitive. The six buttons on the keypad<br />
provide access to the menus <strong>and</strong> easy selection of values. When the setting cover<br />
is closed, the keypad may no longer be used to access the protection settings, but<br />
still provides access to the displays for measurements, histories, indicators, etc.<br />
Measurements .......................................................................<br />
Instantaneous values<br />
The value displayed on the screen is refreshed every second.<br />
Minimum <strong>and</strong> maximum values of measurements are stored in the memory<br />
(minimeters <strong>and</strong> maximeters).<br />
Currents<br />
I rms A 1 2 3 N<br />
A e-fault e-leakage<br />
I max rms A 1 2 3 N<br />
A e-fault e-leakage<br />
Voltages<br />
U rms V 12 23 31<br />
V rms V 1N 2N 3N<br />
U average rms V (U12 + U23 + U31) / 3<br />
U imbalance %<br />
Power, energy<br />
P active, Q reactive, S apparent W, Var, VA totals<br />
E active, E reactive, E apparent Wh, VARh, VAh totals consumed - supplied<br />
totals consumed<br />
totals supplied<br />
Power factory PF total<br />
Frequencies<br />
F<br />
Hz<br />
Dem<strong>and</strong> metering<br />
The dem<strong>and</strong> is calculated over a fixed or sliding time window that may be<br />
programmed from 5 to 60 minutes. According to the contract signed with the <strong>power</strong><br />
supplier, an indicator associated with a load shedding function makes it possible to<br />
avoid or minimise the costs of overrunning the subscribed <strong>power</strong>. Maximum<br />
dem<strong>and</strong> values are systematically stored <strong>and</strong> time stamped (maximeter).<br />
Currents<br />
I dem<strong>and</strong> A 1 2 3 N<br />
A e-fault e-leakage<br />
I max dem<strong>and</strong> A 1 2 3 N<br />
A e-fault e-leakage<br />
Power<br />
P, Q, S dem<strong>and</strong> W, Var, VA totals<br />
P, Q, S max dem<strong>and</strong> W, Var, VA totals<br />
Minimeters <strong>and</strong> maximeters<br />
Only the current <strong>and</strong> <strong>power</strong> maximeters may be displayed on the screen.<br />
Histories .................................................................................<br />
The last ten trips <strong>and</strong> alarms are recorded in two separate history files that may be<br />
displayed on the screen.<br />
c Tripping history:<br />
v Type of fault.<br />
v Date <strong>and</strong> time.<br />
v Values measured at the time of tripping (interrupted current, etc.).<br />
c Alarm history:<br />
v Type of fault.<br />
v Date <strong>and</strong> time.<br />
v Values measured at the time of the alarm.<br />
Maintenance indicators ........................................................<br />
A number of maintenance indicators may be called up on the screen:<br />
c Contact wear.<br />
c Operation counter:<br />
v Cumulative total.<br />
v Total since last reset.<br />
22