ProPosed FY 2010/11 Work Plan And Budget - City of Miami Beach
ProPosed FY 2010/11 Work Plan And Budget - City of Miami Beach
ProPosed FY 2010/11 Work Plan And Budget - City of Miami Beach

You also want an ePaper? Increase the reach of your titles
YUMPU automatically turns print PDFs into web optimized ePapers that Google loves.
<strong>FY</strong> <strong>2010</strong>/<strong>11</strong> Proposed <strong>Work</strong> <strong>Plan</strong> and <strong>Budget</strong> Message<br />
September 10, <strong>2010</strong><br />
Page 26<br />
Homesteaded Properties<br />
<strong>FY</strong> 2009/10 (as <strong>of</strong><br />
<strong>FY</strong> <strong>2010</strong>/<strong>11</strong> (as <strong>of</strong> January 1 <strong>2010</strong>)<br />
January 1 2009)* with 17% Decline with no change with 2.7% CPI<br />
Median Average Median Average Median Average Median Average<br />
Taxable Value $ 133,<strong>11</strong>0 $ 288,709 $ <strong>11</strong>0,481 $ 239,628 $ 133,<strong>11</strong>0 $ 288,709 $ 136,704 $ 296,504<br />
<strong>City</strong> <strong>of</strong> <strong>Miami</strong> <strong>Beach</strong><br />
Taxes<br />
Operating $ 753 $ 1,633 $ 687 $ 1,489 $ 827 $ 1,794 $ 850 $ 1,843<br />
Voted Debt 34 74 32 69 38 83 39 85<br />
Total <strong>Miami</strong> <strong>Beach</strong> $ 787 $ 1,707 $ 719 $ 1,558 $ 865 $ 1,877 $ 889 $ 1,928<br />
$ Change in Taxes<br />
Operating $ (66) $ (144) $ 74 $ 161 $ 97 $ 210<br />
Voted Debt (2) (5) 4 9 5 <strong>11</strong><br />
Total <strong>Miami</strong> <strong>Beach</strong> $ (68) $ (149) $ 78 $ 170 $ 102 $ 221<br />
* Source: <strong>Miami</strong>-Dade County Property Appraiser File as <strong>of</strong> 2/17/10<br />
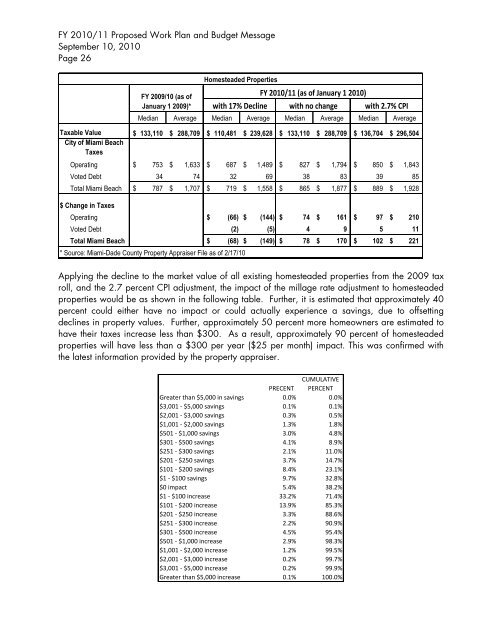
Applying the decline to the market value <strong>of</strong> all existing homesteaded properties from the 2009 tax<br />
roll, and the 2.7 percent CPI adjustment, the impact <strong>of</strong> the millage rate adjustment to homesteaded<br />
properties would be as shown in the following table. Further, it is estimated that approximately 40<br />
percent could either have no impact or could actually experience a savings, due to <strong>of</strong>fsetting<br />
declines in property values. Further, approximately 50 percent more homeowners are estimated to<br />
have their taxes increase less than $300. As a result, approximately 90 percent <strong>of</strong> homesteaded<br />
properties will have less than a $300 per year ($25 per month) impact. This was confirmed with<br />
the latest information provided by the property appraiser.<br />
CUMULATIVE<br />
PRECENT PERCENT<br />
Greater than $5,000 in savings 0.0% 0.0%<br />
$3,001 ‐ $5,000 savings 0.1% 0.1%<br />
$2,001 ‐ $3,000 savings 0.3% 0.5%<br />
$1,001 ‐ $2,000 savings 1.3% 1.8%<br />
$501 ‐ $1,000 savings 3.0% 4.8%<br />
$301 ‐ $500 savings 4.1% 8.9%<br />
$251 ‐ $300 savings 2.1% <strong>11</strong>.0%<br />
$201 ‐ $250 savings 3.7% 14.7%<br />
$101 ‐ $200 savings 8.4% 23.1%<br />
$1 ‐ $100 savings 9.7% 32.8%<br />
$0 impact 5.4% 38.2%<br />
$1 ‐ $100 increase 33.2% 71.4%<br />
$101 ‐ $200 increase 13.9% 85.3%<br />
$201 ‐ $250 increase 3.3% 88.6%<br />
$251 ‐ $300 increase 2.2% 90.9%<br />
$301 ‐ $500 increase 4.5% 95.4%<br />
$501 ‐ $1,000 increase 2.9% 98.3%<br />
$1,001 ‐ $2,000 increase 1.2% 99.5%<br />
$2,001 ‐ $3,000 increase 0.2% 99.7%<br />
$3,001 ‐ $5,000 increase 0.2% 99.9%<br />
Greater than $5,000 increase 0.1% 100.0%