ProPosed FY 2010/11 Work Plan And Budget - City of Miami Beach
ProPosed FY 2010/11 Work Plan And Budget - City of Miami Beach
ProPosed FY 2010/11 Work Plan And Budget - City of Miami Beach

You also want an ePaper? Increase the reach of your titles
YUMPU automatically turns print PDFs into web optimized ePapers that Google loves.
POS. Impacts<br />
PROPOSED <strong>FY</strong> <strong>2010</strong>/<strong>11</strong><br />
3-Year Prior Reductions<br />
% <strong>of</strong><br />
CSL FT PT<br />
Potential<br />
Service<br />
Reductions <strong>Plan</strong> B Total<br />
Addtl.<br />
Efficiency<br />
Reorg. Etc.<br />
CSL <strong>Budget</strong><br />
Positions/% <strong>of</strong> <strong>FY</strong><br />
2009/10 <strong>Budget</strong><br />
$ Impact/% <strong>of</strong> <strong>FY</strong><br />
2009/10 <strong>Budget</strong><br />
<strong>FY</strong> 2009/10 Adopted<br />
<strong>Budget</strong><br />
General Fund $'s FT PT $'s % FT PT %<br />
Transfers<br />
Capital Reserve $ -<br />
$ (2,500,000)<br />
Pay-As-You-Go Capital $ -<br />
$ (7,500,000)<br />
Info & Comm. Tech Fund $ 800,000<br />
$ (600,000)<br />
$ 715,000<br />
0.0%<br />
Capital Investment Upkeep Acct $ 382,000<br />
$ (1,618,000)<br />
$ 200,000<br />
0.0%<br />
Renewal and Replacement Fund $ 2,026,707<br />
$ (1,056,529)<br />
$ 1,777,254<br />
0.0%<br />
Homeowners Dividend $ (4,900,000)<br />
$ - $ -<br />
$ -<br />
Transfer to Risk Fund $ (1,000,000)<br />
$ - $ -<br />
$ -<br />
Transfer to <strong>11</strong>% Reserve $ (3,338,419)<br />
$ - $ -<br />
$ -<br />
Employee Items<br />
Eliminate <strong>FY</strong> 10 Merits and Steps $ (1,395,430)<br />
Implement Class & Comp Study $ (50,000)<br />
Increase pension contribution by 2% $ (2,055,345)<br />
Add Backs for Unnegotiated Items - GF component<br />
<strong>FY</strong> <strong>11</strong> Merits/Steps forCWA, AFSCME $ 369,285<br />
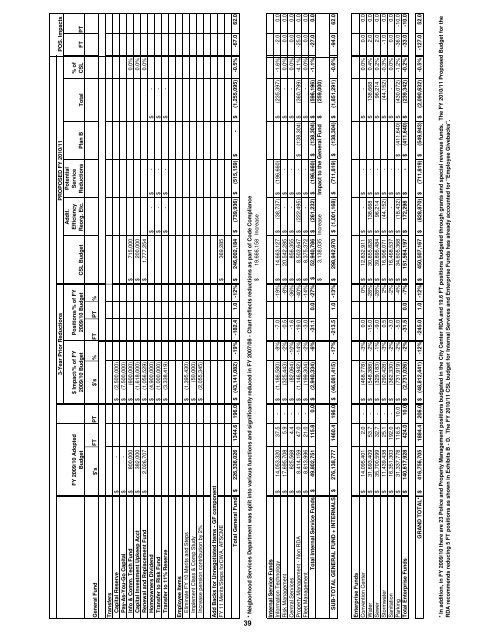
Total General Fund $ 226,336,026 1344.6 196.0 $ (43,141,082) -19% -182.4 1.0 -12% $ 246,002,184 $ (739,936) $ (515,159) $ - $ (1,255,095) -0.5% -67.0 62.0<br />
* Neigborhood Services Department was split into various functions and significantly reduced in <strong>FY</strong> 2007/08 - Chart reflects reductions as part <strong>of</strong> Code Compliance<br />
$ 19,666,158 Increase<br />
39<br />
$ $ (235,397) -1.6% -2.0 0.0<br />
$ (196,660)<br />
$ -2% -0.5 -8% $ 20,542,285 $ -<br />
-<br />
Internal Service Funds<br />
Information Technology $ 14,053,320 37.5 - $ (1,186,580) -8% -7.0 -19% $ 14,663,127 (38,737)<br />
$ $ - 0.0% 0.0 0.0<br />
Risk Management $ 17,695,708 5.9 - (325,443)<br />
Central Services $ 825,568 4.4 - $ (82,064) -10% -1.6 -36% $ 856,355 $ - $ -<br />
$ - 0.0% 0.0 0.0<br />
Property Management - Non RDA $ 8,414,159 47.0 - $ (1,146,942) -14% -19.0 -40% $ 8,503,647 $ (222,495) $ - $ (138,304) $ (360,799) -4.1% -25.0 0.0<br />
Fleet Management $ 8,813,996 21.0 - $ (199,304) -2% -3.0 -14% $ 8,375,372 $ - $ -<br />
$ - 0.0% 0.0 0.0<br />
Total Internal Service Funds $ 49,802,751 <strong>11</strong>5.8 0.0 $ (2,940,334) -6% -31.1 0.0 -27% $ 52,940,786 $ (261,232) $ (196,660) $ (138,304) $ (596,196) -1.1% -27.0 0.0<br />
$ 3,138,035 Increase Impact to the General Fund $ (259,000)<br />
SUB-TOTAL GENERAL FUND + INTERNALS $ 276,138,777 1460.4 196.0 $ (46,081,415) -17% -213.5 1.0 -13% $ 298,942,970 $ (1,001,168) $ (7<strong>11</strong>,819) $ (138,304) $ (1,851,291) -0.6% -94.0 62.0<br />
Enterprise Funds<br />
Convention Center $ 14,095,401 2.0 - $ (468,778) -3% 0.0 0% $ 12,832,9<strong>11</strong> $ - $ -<br />
$ - 0.0% 0.0 0.0<br />
Water $ 31,693,409 53.7 - $ (548,388) -2% -15.0 -28% $ 30,855,826 $ 138,668 $ -<br />
$ 138,668 0.4% 2.0 0.0<br />
Sewer $ 35,700,599 32.7 - $ (329,183) -1% -9.0 -28% $ 39,895,484 $ 96,214 $ -<br />
$ 96,214 0.2% 2.0 0.0<br />
Stormwater $ <strong>11</strong>,439,438 25.1 - $ (290,428) -3% 0.5 2% $ 16,906,071 $ (44,152) $ -<br />
$ (44,152) -0.3% -1.0 0.0<br />
Sanitation $ 16,351,303 192.0 - $ (362,330) -2% -3.0 -2% $ 16,468,537 $ - $ -<br />
$ - 0.0% 0.0 0.0<br />
Parking $ 31,337,778 <strong>11</strong>8.5 10.0 $ (731,919) -2% -5.0 -4% $ 34,605,368 $ (18,432) $ - $ (4<strong>11</strong>,640) $ (430,072) -1.2% -36.0 -10.0<br />
Total Enterprise Funds $ 140,617,928 424.0 10.0 $ (2,731,026) -2% -31.5 0.0 -7% $ 151,564,197 $ 172,298 $ - $ (4<strong>11</strong>,640) $ (239,342) -0.2% -33.0 -10.0<br />
GRAND TOTAL* $ 416,756,705 1884.4 206.0 $ (48,812,441) -12% -245.0 1.0 -12% $ 450,507,167 $ (828,870) $ (7<strong>11</strong>,819) $ (549,943) $ (2,090,632) -0.5% -127.0 52.0<br />
* In addition, in <strong>FY</strong> 2009/10 there are 23 Police and Property Management positions budgeted in the <strong>City</strong> Center RDA and 19.6 FT positions budgeted through grants and special revenue funds. The <strong>FY</strong> <strong>2010</strong>/<strong>11</strong> Proposed <strong>Budget</strong> for the<br />
RDA recommends reducing 5 FT positions as shown in Exhibits B - D. The <strong>FY</strong> <strong>2010</strong>/<strong>11</strong> CSL budget for Internal Services and Enterprise Funds has already accounted for "Employee Givebacks".