AIRS Level 1B Visible/Near-Infrared Channels ATBD - NASA's Earth ...
AIRS Level 1B Visible/Near-Infrared Channels ATBD - NASA's Earth ...
AIRS Level 1B Visible/Near-Infrared Channels ATBD - NASA's Earth ...

Create successful ePaper yourself
Turn your PDF publications into a flip-book with our unique Google optimized e-Paper software.
<strong>AIRS</strong> <strong>Level</strong> 1b <strong>ATBD</strong> Part 2: Vis/<strong>Near</strong> IR <strong>Channels</strong><br />
The spectral response curve of the visible channels is defined by the product of the spectral<br />
response of these elements:<br />
4. The reflectivity of three mirrors (the scan mirror and two fold mirrors).<br />
5. The transmission characteristics of the field imaging lenses.<br />
6. Sharp cut-on and cut-off interference filters (except for the long-wave side of channel 4,<br />
which uses a pass-filter).<br />
7. The spectral response curve of the Silicon detectors.<br />
Measurements have been made of the spectral response of all the above items (Hofstadter<br />
1999a and Fig. 1.1), except the lens transmission coefficients. The lenses are not expected<br />
to have an appreciable spectral effect, however, and can be ignored in this regard. The scan<br />
mirror and the folding mirrors of the optics are Silver coated with a thin layer of SiO x<br />
, using<br />
Denton proprietary process FSS99. This coating should have a minimal (< 2%) polarization<br />
dependence in the 0.4 to 1.0 µm region, which was too small to detect by the test set-up used<br />
during ground characterization of the scan mirror.<br />
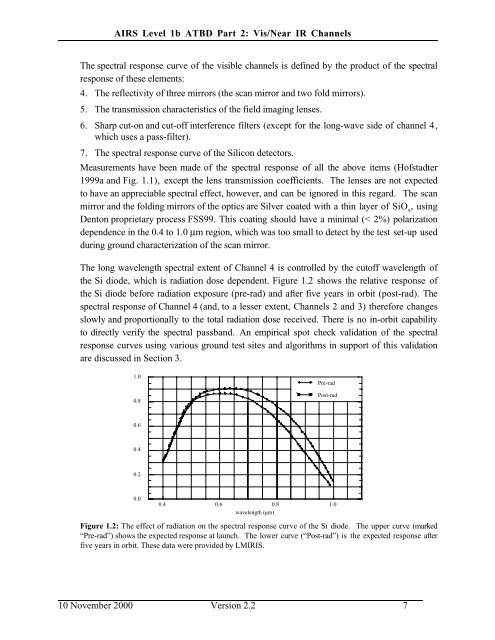
The long wavelength spectral extent of Channel 4 is controlled by the cutoff wavelength of<br />
the Si diode, which is radiation dose dependent. Figure 1.2 shows the relative response of<br />
the Si diode before radiation exposure (pre-rad) and after five years in orbit (post-rad). The<br />
spectral response of Channel 4 (and, to a lesser extent, <strong>Channels</strong> 2 and 3) therefore changes<br />
slowly and proportionally to the total radiation dose received. There is no in-orbit capability<br />
to directly verify the spectral passband. An empirical spot check validation of the spectral<br />
response curves using various ground test sites and algorithms in support of this validation<br />
are discussed in Section 3.<br />
1.0<br />
0.8<br />
Pre-rad<br />
Post-rad<br />
0.6<br />
0.4<br />
0.2<br />
0.0<br />
0.4 0.6 0.8 1.0<br />
wavelength (µm)<br />
Figure 1.2: The effect of radiation on the spectral response curve of the Si diode. The upper curve (marked<br />
“Pre-rad”) shows the expected response at launch. The lower curve (“Post-rad”) is the expected response after<br />
five years in orbit. These data were provided by LMIRIS.<br />
10 November 2000 Version 2.2 7