BMO Financial Group - Outlook 2005(1.1Mb pdf File) - Boardwalk REIT
BMO Financial Group - Outlook 2005(1.1Mb pdf File) - Boardwalk REIT
BMO Financial Group - Outlook 2005(1.1Mb pdf File) - Boardwalk REIT

Create successful ePaper yourself
Turn your PDF publications into a flip-book with our unique Google optimized e-Paper software.
15<br />
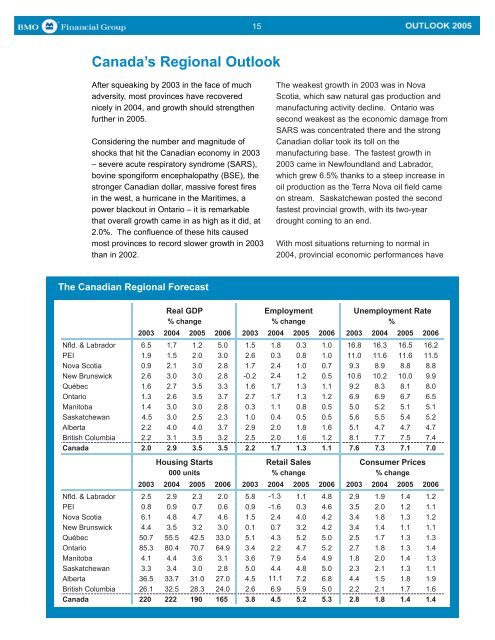
Canada’s Regional <strong>Outlook</strong><br />
After squeaking by 2003 in the face of much<br />
adversity, most provinces have recovered<br />
nicely in 2004, and growth should strengthen<br />
further in <strong>2005</strong>.<br />
Considering the number and magnitude of<br />
shocks that hit the Canadian economy in 2003<br />
– severe acute respiratory syndrome (SARS),<br />
bovine spongiform encephalopathy (BSE), the<br />
stronger Canadian dollar, massive forest fires<br />
in the west, a hurricane in the Maritimes, a<br />
power blackout in Ontario – it is remarkable<br />
that overall growth came in as high as it did, at<br />
2.0%. The confluence of these hits caused<br />
most provinces to record slower growth in 2003<br />
than in 2002.<br />
The weakest growth in 2003 was in Nova<br />
Scotia, which saw natural gas production and<br />
manufacturing activity decline. Ontario was<br />
second weakest as the economic damage from<br />
SARS was concentrated there and the strong<br />
Canadian dollar took its toll on the<br />
manufacturing base. The fastest growth in<br />
2003 came in Newfoundland and Labrador,<br />
which grew 6.5% thanks to a steep increase in<br />
oil production as the Terra Nova oil field came<br />
on stream. Saskatchewan posted the second<br />
fastest provincial growth, with its two-year<br />
drought coming to an end.<br />
With most situations returning to normal in<br />
2004, provincial economic performances have<br />
The Canadian Regional Forecast<br />
Real GDP<br />
Employment<br />
% change % change<br />
2003 2004 <strong>2005</strong> 2006 2003 2004 <strong>2005</strong> 2006 2003 2004 <strong>2005</strong> 2006<br />
Nfld. & Labrador 6.5 1.7 1.2 5.0 1.5 1.8 0.3 1.0 16.8 16.3 16.5 16.2<br />
PEI 1.9 1.5 2.0 3.0 2.6 0.3 0.8 1.0 11.0 11.6 11.6 11.5<br />
Nova Scotia 0.9 2.1 3.0 2.8 1.7 2.4 1.0 0.7 9.3 8.9 8.8 8.8<br />
New Brunswick 2.6 3.0 3.0 2.8 -0.2 2.4 1.2 0.5 10.6 10.2 10.0 9.9<br />
Québec 1.6 2.7 3.5 3.3 1.6 1.7 1.3 1.1 9.2 8.3 8.1 8.0<br />
Ontario 1.3 2.6 3.5 3.7 2.7 1.7 1.3 1.2 6.9 6.9 6.7 6.5<br />
Manitoba 1.4 3.0 3.0 2.8 0.3 1.1 0.8 0.5 5.0 5.2 5.1 5.1<br />
Saskatchewan 4.5 3.0 2.5 2.3 1.0 0.4 0.5 0.5 5.6 5.5 5.4 5.2<br />
Alberta 2.2 4.0 4.0 3.7 2.9 2.0 1.8 1.6 5.1 4.7 4.7 4.7<br />
British Columbia 2.2 3.1 3.5 3.2 2.5 2.0 1.6 1.2 8.1 7.7 7.5 7.4<br />
Canada 2.0 2.9 3.5 3.5 2.2 1.7 1.3 1.1 7.6 7.3 7.1 7.0<br />
Housing Starts<br />
000 units<br />
Retail Sales<br />
% change<br />
Unemployment Rate<br />
%<br />
Consumer Prices<br />
% change<br />
2003 2004 <strong>2005</strong> 2006 2003 2004 <strong>2005</strong> 2006 2003 2004 <strong>2005</strong> 2006<br />
Nfld. & Labrador 2.5 2.9 2.3 2.0 5.8 -1.3 1.1 4.8 2.9 1.9 1.4 1.2<br />
PEI 0.8 0.9 0.7 0.6 0.9 -1.6 0.3 4.6 3.5 2.0 1.2 1.1<br />
Nova Scotia 6.1 4.8 4.7 4.6 1.5 2.4 4.0 4.2 3.4 1.8 1.3 1.2<br />
New Brunswick 4.4 3.5 3.2 3.0 0.1 0.7 3.2 4.2 3.4 1.4 1.1 1.1<br />
Québec 50.7 55.5 42.5 33.0 5.1 4.3 5.2 5.0 2.5 1.7 1.3 1.3<br />
Ontario 85.3 80.4 70.7 64.9 3.4 2.2 4.7 5.2 2.7 1.8 1.3 1.4<br />
Manitoba 4.1 4.4 3.6 3.1 3.6 7.9 5.4 4.9 1.8 2.0 1.4 1.3<br />
Saskatchewan 3.3 3.4 3.0 2.8 5.0 4.4 4.8 5.0 2.3 2.1 1.3 1.1<br />
Alberta 36.5 33.7 31.0 27.0 4.5 11.1 7.2 6.8 4.4 1.5 1.8 1.9<br />
British Columbia 26.1 32.5 28.3 24.0 2.6 6.9 5.9 5.0 2.2 2.1 1.7 1.6<br />
Canada 220 222 190 165 3.8 4.5 5.2 5.3 2.8 1.8 1.4 1.4