BMO Financial Group - Outlook 2005(1.1Mb pdf File) - Boardwalk REIT
BMO Financial Group - Outlook 2005(1.1Mb pdf File) - Boardwalk REIT
BMO Financial Group - Outlook 2005(1.1Mb pdf File) - Boardwalk REIT

You also want an ePaper? Increase the reach of your titles
YUMPU automatically turns print PDFs into web optimized ePapers that Google loves.
3<br />
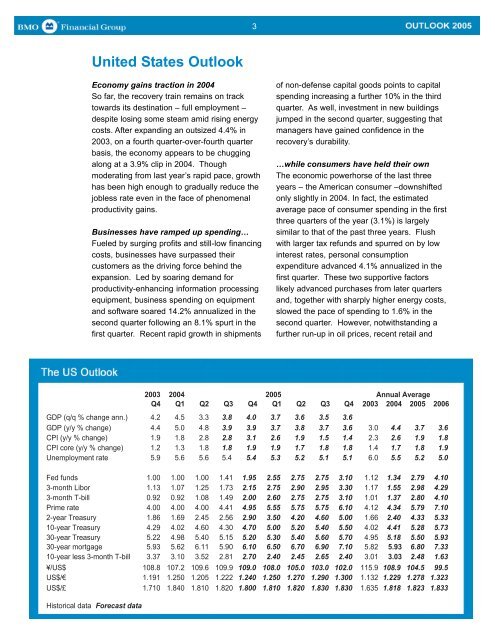
United States <strong>Outlook</strong><br />
Economy gains traction in 2004<br />
So far, the recovery train remains on track<br />
towards its destination – full employment –<br />
despite losing some steam amid rising energy<br />
costs. After expanding an outsized 4.4% in<br />
2003, on a fourth quarter-over-fourth quarter<br />
basis, the economy appears to be chugging<br />
along at a 3.9% clip in 2004. Though<br />
moderating from last year’s rapid pace, growth<br />
has been high enough to gradually reduce the<br />
jobless rate even in the face of phenomenal<br />
productivity gains.<br />
Businesses have ramped up spending…<br />
Fueled by surging profits and still-low financing<br />
costs, businesses have surpassed their<br />
customers as the driving force behind the<br />
expansion. Led by soaring demand for<br />
productivity-enhancing information processing<br />
equipment, business spending on equipment<br />
and software soared 14.2% annualized in the<br />
second quarter following an 8.1% spurt in the<br />
first quarter. Recent rapid growth in shipments<br />
of non-defense capital goods points to capital<br />
spending increasing a further 10% in the third<br />
quarter. As well, investment in new buildings<br />
jumped in the second quarter, suggesting that<br />
managers have gained confidence in the<br />
recovery’s durability.<br />
…while consumers have held their own<br />
The economic powerhorse of the last three<br />
years – the American consumer –downshifted<br />
only slightly in 2004. In fact, the estimated<br />
average pace of consumer spending in the first<br />
three quarters of the year (3.1%) is largely<br />
similar to that of the past three years. Flush<br />
with larger tax refunds and spurred on by low<br />
interest rates, personal consumption<br />
expenditure advanced 4.1% annualized in the<br />
first quarter. These two supportive factors<br />
likely advanced purchases from later quarters<br />
and, together with sharply higher energy costs,<br />
slowed the pace of spending to 1.6% in the<br />
second quarter. However, notwithstanding a<br />
further run-up in oil prices, recent retail and<br />
2003 2004 <strong>2005</strong><br />
Annual Average<br />
Q4 Q1 Q2 Q3 Q4 Q1 Q2 Q3 Q4 2003 2004 <strong>2005</strong> 2006<br />
GDP (q/q % change ann.) 4.2 4.5 3.3 3.8 4.0 3.7 3.6 3.5 3.6<br />
GDP (y/y % change) 4.4 5.0 4.8 3.9 3.9 3.7 3.8 3.7 3.6 3.0 4.4 3.7 3.6<br />
CPI (y/y % change) 1.9 1.8 2.8 2.8 3.1 2.6 1.9 1.5 1.4 2.3 2.6 1.9 1.8<br />
CPI core (y/y % change) 1.2 1.3 1.8 1.8 1.9 1.9 1.7 1.8 1.8 1.4 1.7 1.8 1.9<br />
Unemployment rate 5.9 5.6 5.6 5.4 5.4 5.3 5.2 5.1 5.1 6.0 5.5 5.2 5.0<br />
Fed funds 1.00 1.00 1.00 1.41 1.95 2.55 2.75 2.75 3.10 1.12 1.34 2.79 4.10<br />
3-month Libor 1.13 1.07 1.25 1.73 2.15 2.75 2.90 2.95 3.30 1.17 1.55 2.98 4.29<br />
3-month T-bill 0.92 0.92 1.08 1.49 2.00 2.60 2.75 2.75 3.10 1.01 1.37 2.80 4.10<br />
Prime rate 4.00 4.00 4.00 4.41 4.95 5.55 5.75 5.75 6.10 4.12 4.34 5.79 7.10<br />
2-year Treasury 1.86 1.69 2.45 2.56 2.90 3.50 4.20 4.60 5.00 1.66 2.40 4.33 5.33<br />
10-year Treasury 4.29 4.02 4.60 4.30 4.70 5.00 5.20 5.40 5.50 4.02 4.41 5.28 5.73<br />
30-year Treasury 5.22 4.98 5.40 5.15 5.20 5.30 5.40 5.60 5.70 4.95 5.18 5.50 5.93<br />
30-year mortgage 5.93 5.62 6.11 5.90 6.10 6.50 6.70 6.90 7.10 5.82 5.93 6.80 7.33<br />
10-year less 3-month T-bill 3.37 3.10 3.52 2.81 2.70 2.40 2.45 2.65 2.40 3.01 3.03 2.48 1.63<br />
¥/US$ 108.8 107.2 109.6 109.9 109.0 108.0 105.0 103.0 102.0 115.9 108.9 104.5 99.5<br />
US$/€ 1.191 1.250 1.205 1.222 1.240 1.250 1.270 1.290 1.300 1.132 1.229 1.278 1.323<br />
US$/£ 1.710 1.840 1.810 1.820 1.800 1.810 1.820 1.830 1.830 1.635 1.818 1.823 1.833<br />
Historical data Forecast data