BMO Financial Group - Outlook 2005(1.1Mb pdf File) - Boardwalk REIT
BMO Financial Group - Outlook 2005(1.1Mb pdf File) - Boardwalk REIT
BMO Financial Group - Outlook 2005(1.1Mb pdf File) - Boardwalk REIT

You also want an ePaper? Increase the reach of your titles
YUMPU automatically turns print PDFs into web optimized ePapers that Google loves.
33<br />
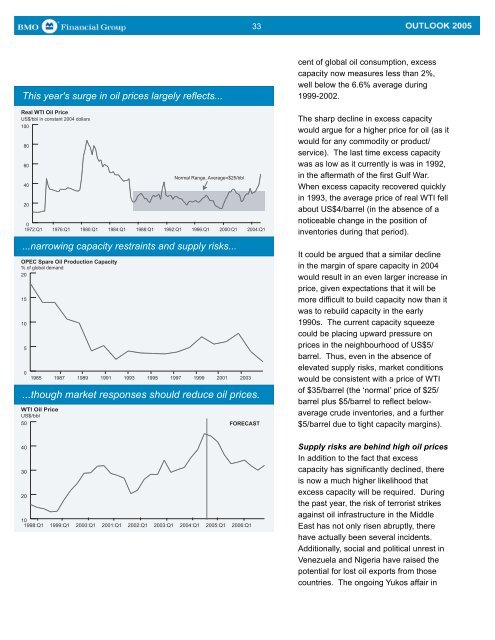
This year's surge in oil prices largely reflects...<br />
Real WTI Oil Price<br />
US$/bbl in constant 2004 dollars<br />
100<br />
80<br />
60<br />
40<br />
20<br />
0<br />
1972:Q1<br />
...narrowing capacity restraints and supply risks...<br />
OPEC Spare Oil Production Capacity<br />
% of global demand<br />
20<br />
15<br />
10<br />
5<br />
0<br />
...though market responses should reduce oil prices.<br />
WTI Oil Price<br />
US$/bbl<br />
50<br />
1985<br />
1976:Q1<br />
1987<br />
1980:Q1<br />
1989<br />
1991<br />
1984:Q1<br />
1993<br />
1988:Q1<br />
1995<br />
1992:Q1<br />
Normal Range, Average=$25/bbl<br />
1997<br />
1996:Q1<br />
1999<br />
2000:Q1<br />
2001<br />
2003<br />
2004:Q1<br />
FORECAST<br />
cent of global oil consumption, excess<br />
capacity now measures less than 2%,<br />
well below the 6.6% average during<br />
1999-2002.<br />
The sharp decline in excess capacity<br />
would argue for a higher price for oil (as it<br />
would for any commodity or product/<br />
service). The last time excess capacity<br />
was as low as it currently is was in 1992,<br />
in the aftermath of the first Gulf War.<br />
When excess capacity recovered quickly<br />
in 1993, the average price of real WTI fell<br />
about US$4/barrel (in the absence of a<br />
noticeable change in the position of<br />
inventories during that period).<br />
It could be argued that a similar decline<br />
in the margin of spare capacity in 2004<br />
would result in an even larger increase in<br />
price, given expectations that it will be<br />
more difficult to build capacity now than it<br />
was to rebuild capacity in the early<br />
1990s. The current capacity squeeze<br />
could be placing upward pressure on<br />
prices in the neighbourhood of US$5/<br />
barrel. Thus, even in the absence of<br />
elevated supply risks, market conditions<br />
would be consistent with a price of WTI<br />
of $35/barrel (the ‘normal’ price of $25/<br />
barrel plus $5/barrel to reflect belowaverage<br />
crude inventories, and a further<br />
$5/barrel due to tight capacity margins).<br />
40<br />
30<br />
20<br />
10<br />
1998:Q1<br />
1999:Q1<br />
2000:Q1<br />
2001:Q1<br />
2002:Q1<br />
2003:Q1<br />
2004:Q1<br />
<strong>2005</strong>:Q1<br />
2006:Q1<br />
Supply risks are behind high oil prices<br />
In addition to the fact that excess<br />
capacity has significantly declined, there<br />
is now a much higher likelihood that<br />
excess capacity will be required. During<br />
the past year, the risk of terrorist strikes<br />
against oil infrastructure in the Middle<br />
East has not only risen abruptly, there<br />
have actually been several incidents.<br />
Additionally, social and political unrest in<br />
Venezuela and Nigeria have raised the<br />
potential for lost oil exports from those<br />
countries. The ongoing Yukos affair in