BMO Financial Group - Outlook 2005(1.1Mb pdf File) - Boardwalk REIT
BMO Financial Group - Outlook 2005(1.1Mb pdf File) - Boardwalk REIT
BMO Financial Group - Outlook 2005(1.1Mb pdf File) - Boardwalk REIT

Create successful ePaper yourself
Turn your PDF publications into a flip-book with our unique Google optimized e-Paper software.
7<br />
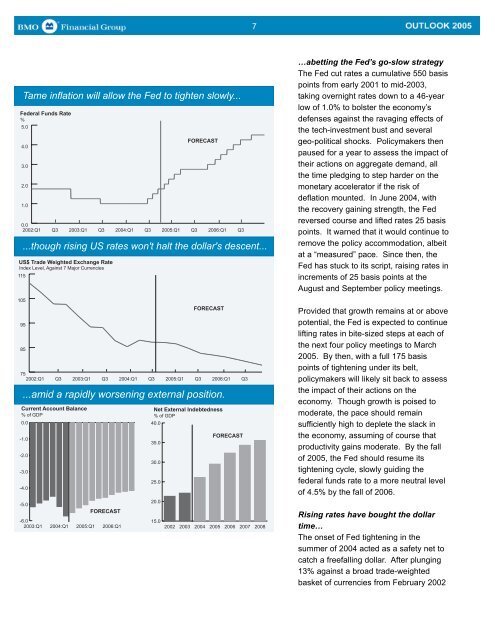
Tame inflation will allow the Fed to tighten slowly...<br />
Federal Funds Rate<br />
%<br />
5.0<br />
4.0<br />
3.0<br />
2.0<br />
1.0<br />
0.0<br />
2002:Q1<br />
...though rising US rates won't halt the dollar's descent...<br />
US$ Trade Weighted Exchange Rate<br />
Index Level, Against 7 Major Currencies<br />
115<br />
Q3<br />
2003:Q1<br />
Q3<br />
2004:Q1<br />
Q3<br />
<strong>2005</strong>:Q1<br />
FORECAST<br />
Q3<br />
2006:Q1<br />
Q3<br />
…abetting the Fed’s go-slow strategy<br />
The Fed cut rates a cumulative 550 basis<br />
points from early 2001 to mid-2003,<br />
taking overnight rates down to a 46-year<br />
low of 1.0% to bolster the economy’s<br />
defenses against the ravaging effects of<br />
the tech-investment bust and several<br />
geo-political shocks. Policymakers then<br />
paused for a year to assess the impact of<br />
their actions on aggregate demand, all<br />
the time pledging to step harder on the<br />
monetary accelerator if the risk of<br />
deflation mounted. In June 2004, with<br />
the recovery gaining strength, the Fed<br />
reversed course and lifted rates 25 basis<br />
points. It warned that it would continue to<br />
remove the policy accommodation, albeit<br />
at a “measured” pace. Since then, the<br />
Fed has stuck to its script, raising rates in<br />
increments of 25 basis points at the<br />
August and September policy meetings.<br />
105<br />
95<br />
85<br />
75<br />
2002:Q1<br />
Q3<br />
2003:Q1<br />
Q3<br />
2004:Q1<br />
<strong>2005</strong>:Q1<br />
2006:Q1<br />
...amid a rapidly worsening external position.<br />
Current Account Balance<br />
% of GDP<br />
0.0<br />
-1.0<br />
-2.0<br />
-3.0<br />
-4.0<br />
-5.0<br />
-6.0<br />
2003:Q1<br />
2004:Q1<br />
<strong>2005</strong>:Q1<br />
FORECAST<br />
2006:Q1<br />
Q3<br />
FORECAST<br />
Q3<br />
Net External Indebtedness<br />
% of GDP<br />
40.0<br />
35.0<br />
30.0<br />
25.0<br />
20.0<br />
15.0<br />
2002<br />
2003<br />
2004<br />
FORECAST<br />
<strong>2005</strong><br />
2006<br />
Q3<br />
2007<br />
2008<br />
Provided that growth remains at or above<br />
potential, the Fed is expected to continue<br />
lifting rates in bite-sized steps at each of<br />
the next four policy meetings to March<br />
<strong>2005</strong>. By then, with a full 175 basis<br />
points of tightening under its belt,<br />
policymakers will likely sit back to assess<br />
the impact of their actions on the<br />
economy. Though growth is poised to<br />
moderate, the pace should remain<br />
sufficiently high to deplete the slack in<br />
the economy, assuming of course that<br />
productivity gains moderate. By the fall<br />
of <strong>2005</strong>, the Fed should resume its<br />
tightening cycle, slowly guiding the<br />
federal funds rate to a more neutral level<br />
of 4.5% by the fall of 2006.<br />
Rising rates have bought the dollar<br />
time…<br />
The onset of Fed tightening in the<br />
summer of 2004 acted as a safety net to<br />
catch a freefalling dollar. After plunging<br />
13% against a broad trade-weighted<br />
basket of currencies from February 2002