Higher Education: Gaps in Access and Persistence Study
Higher Education: Gaps in Access and Persistence Study
Higher Education: Gaps in Access and Persistence Study

You also want an ePaper? Increase the reach of your titles
YUMPU automatically turns print PDFs into web optimized ePapers that Google loves.
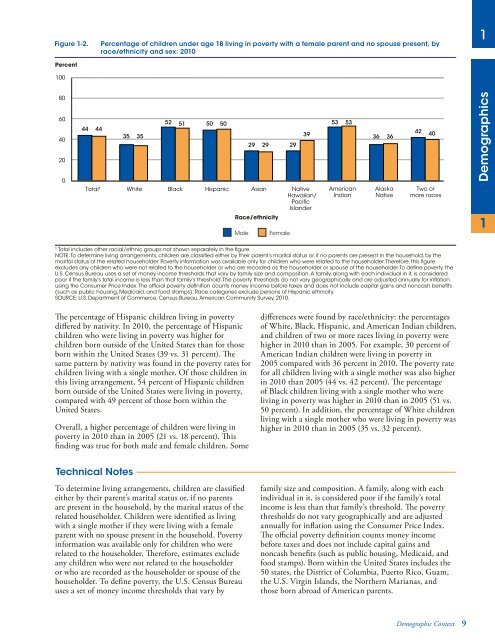
Figure 1-2.<br />
Percent<br />
100<br />
Percentage of children under age 18 liv<strong>in</strong>g <strong>in</strong> poverty with a female parent <strong>and</strong> no spouse present, by<br />
race/ethnicity <strong>and</strong> sex: 2010<br />
1<br />
80<br />
60<br />
40<br />
20<br />
0<br />
44 44<br />
35 35<br />
52 51 50 50<br />
Race/ethnicity<br />
Male<br />
29 29 29<br />
Total¹ White Black Hispanic Asian Native<br />
Hawaiian/<br />
Pacific<br />
Isl<strong>and</strong>er<br />
Female<br />
39<br />
53 53<br />
American<br />
Indian<br />
36 36<br />
Alaska<br />
Native<br />
42<br />
40<br />
Two or<br />
more races<br />
Demographics<br />
1<br />
¹ Total <strong>in</strong>cludes other racial/ethnic groups not shown separately <strong>in</strong> the figure.<br />
NOTE: To determ<strong>in</strong>e liv<strong>in</strong>g arrangements, children are classified either by their parent’s marital status or, if no parents are present <strong>in</strong> the household, by the<br />
marital status of the related householder. Poverty <strong>in</strong>formation was available only for children who were related to the householder. Therefore, this figure<br />
excludes any children who were not related to the householder or who are recorded as the householder or spouse of the householder. To def<strong>in</strong>e poverty, the<br />
U.S. Census Bureau uses a set of money <strong>in</strong>come thresholds that vary by family size <strong>and</strong> composition. A family, along with each <strong>in</strong>dividual <strong>in</strong> it, is considered<br />
poor if the family’s total <strong>in</strong>come is less than that family’s threshold. The poverty thresholds do not vary geographically <strong>and</strong> are adjusted annually for <strong>in</strong>flation<br />
us<strong>in</strong>g the Consumer Price Index. The official poverty def<strong>in</strong>ition counts money <strong>in</strong>come before taxes <strong>and</strong> does not <strong>in</strong>clude capital ga<strong>in</strong>s <strong>and</strong> noncash benefits<br />
(such as public hous<strong>in</strong>g, Medicaid, <strong>and</strong> food stamps). Race categories exclude persons of Hispanic ethnicity.<br />
SOURCE: U.S. Department of Commerce, Census Bureau, American Community Survey, 2010.<br />
The percentage of Hispanic children liv<strong>in</strong>g <strong>in</strong> poverty<br />
differed by nativity. In 2010, the percentage of Hispanic<br />
children who were liv<strong>in</strong>g <strong>in</strong> poverty was higher for<br />
children born outside of the United States than for those<br />
born with<strong>in</strong> the United States (39 vs. 31 percent). The<br />
same pattern by nativity was found <strong>in</strong> the poverty rates for<br />
children liv<strong>in</strong>g with a s<strong>in</strong>gle mother. Of those children <strong>in</strong><br />
this liv<strong>in</strong>g arrangement, 54 percent of Hispanic children<br />
born outside of the United States were liv<strong>in</strong>g <strong>in</strong> poverty,<br />
compared with 49 percent of those born with<strong>in</strong> the<br />
United States.<br />
Overall, a higher percentage of children were liv<strong>in</strong>g <strong>in</strong><br />
poverty <strong>in</strong> 2010 than <strong>in</strong> 2005 (21 vs. 18 percent). This<br />
f<strong>in</strong>d<strong>in</strong>g was true for both male <strong>and</strong> female children. Some<br />
differences were found by race/ethnicity: the percentages<br />
of White, Black, Hispanic, <strong>and</strong> American Indian children,<br />
<strong>and</strong> children of two or more races liv<strong>in</strong>g <strong>in</strong> poverty were<br />
higher <strong>in</strong> 2010 than <strong>in</strong> 2005. For example, 30 percent of<br />
American Indian children were liv<strong>in</strong>g <strong>in</strong> poverty <strong>in</strong><br />
2005 compared with 36 percent <strong>in</strong> 2010. The poverty rate<br />
for all children liv<strong>in</strong>g with a s<strong>in</strong>gle mother was also higher<br />
<strong>in</strong> 2010 than 2005 (44 vs. 42 percent). The percentage<br />
of Black children liv<strong>in</strong>g with a s<strong>in</strong>gle mother who were<br />
liv<strong>in</strong>g <strong>in</strong> poverty was higher <strong>in</strong> 2010 than <strong>in</strong> 2005 (51 vs.<br />
50 percent). In addition, the percentage of White children<br />
liv<strong>in</strong>g with a s<strong>in</strong>gle mother who were liv<strong>in</strong>g <strong>in</strong> poverty was<br />
higher <strong>in</strong> 2010 than <strong>in</strong> 2005 (35 vs. 32 percent).<br />
Technical Notes<br />
To determ<strong>in</strong>e liv<strong>in</strong>g arrangements, children are classified<br />
either by their parent’s marital status or, if no parents<br />
are present <strong>in</strong> the household, by the marital status of the<br />
related householder. Children were identified as liv<strong>in</strong>g<br />
with a s<strong>in</strong>gle mother if they were liv<strong>in</strong>g with a female<br />
parent with no spouse present <strong>in</strong> the household. Poverty<br />
<strong>in</strong>formation was available only for children who were<br />
related to the householder. Therefore, estimates exclude<br />
any children who were not related to the householder<br />
or who are recorded as the householder or spouse of the<br />
householder. To def<strong>in</strong>e poverty, the U.S. Census Bureau<br />
uses a set of money <strong>in</strong>come thresholds that vary by<br />
family size <strong>and</strong> composition. A family, along with each<br />
<strong>in</strong>dividual <strong>in</strong> it, is considered poor if the family’s total<br />
<strong>in</strong>come is less than that family’s threshold. The poverty<br />
thresholds do not vary geographically <strong>and</strong> are adjusted<br />
annually for <strong>in</strong>flation us<strong>in</strong>g the Consumer Price Index.<br />
The official poverty def<strong>in</strong>ition counts money <strong>in</strong>come<br />
before taxes <strong>and</strong> does not <strong>in</strong>clude capital ga<strong>in</strong>s <strong>and</strong><br />
noncash benefits (such as public hous<strong>in</strong>g, Medicaid, <strong>and</strong><br />
food stamps). Born with<strong>in</strong> the United States <strong>in</strong>cludes the<br />
50 states, the District of Columbia, Puerto Rico, Guam,<br />
the U.S. Virg<strong>in</strong> Isl<strong>and</strong>s, the Northern Marianas, <strong>and</strong><br />
those born abroad of American parents.<br />
Demographic Context 9