Higher Education: Gaps in Access and Persistence Study
Higher Education: Gaps in Access and Persistence Study
Higher Education: Gaps in Access and Persistence Study

Create successful ePaper yourself
Turn your PDF publications into a flip-book with our unique Google optimized e-Paper software.
<strong>Higher</strong> <strong>Education</strong>: <strong>Gaps</strong> <strong>in</strong><br />
<strong>Access</strong> <strong>and</strong> <strong>Persistence</strong> <strong>Study</strong><br />
August 2012<br />
NCES 2012-046<br />
U.S. DEPARTMENT OF EDUCATION
<strong>Higher</strong> <strong>Education</strong>: <strong>Gaps</strong> <strong>in</strong><br />
<strong>Access</strong> <strong>and</strong> <strong>Persistence</strong> <strong>Study</strong><br />
Statistical Analysis Report<br />
AUGUST 2012<br />
Terris Ross<br />
Grace Kena<br />
National Center for <strong>Education</strong> Statistics<br />
Amy Rathbun<br />
Angel<strong>in</strong>a KewalRamani<br />
Jijun Zhang<br />
Paul Kristapovich<br />
Eileen Mann<strong>in</strong>g<br />
American Institutes for Research<br />
NCES 2012-046<br />
U.S. DEPARTMENT OF EDUCATION
U.S. Department of <strong>Education</strong><br />
Arne Duncan<br />
Secretary<br />
Institute of <strong>Education</strong> Sciences<br />
John Q. Easton<br />
Director<br />
National Center for <strong>Education</strong> Statistics<br />
Jack Buckley<br />
Commissioner<br />
The National Center for <strong>Education</strong> Statistics (NCES) is the primary federal entity for collect<strong>in</strong>g, analyz<strong>in</strong>g, <strong>and</strong><br />
report<strong>in</strong>g data related to education <strong>in</strong> the United States <strong>and</strong> other nations. It fulfills a congressional m<strong>and</strong>ate to collect,<br />
collate, analyze, <strong>and</strong> report full <strong>and</strong> complete statistics on the condition of education <strong>in</strong> the United States; conduct<br />
<strong>and</strong> publish reports <strong>and</strong> specialized analyses of the mean<strong>in</strong>g <strong>and</strong> significance of such statistics; assist state <strong>and</strong> local<br />
education agencies <strong>in</strong> improv<strong>in</strong>g their statistical systems; <strong>and</strong> review <strong>and</strong> report on education activities <strong>in</strong> foreign<br />
countries.<br />
NCES activities are designed to address high-priority education data needs; provide consistent, reliable, complete,<br />
<strong>and</strong> accurate <strong>in</strong>dicators of education status <strong>and</strong> trends; <strong>and</strong> report timely, useful, <strong>and</strong> high-quality data to the U.S.<br />
Department of <strong>Education</strong>, the Congress, the states, other education policymakers, practitioners, data users, <strong>and</strong> the<br />
general public. Unless specifically noted, all <strong>in</strong>formation conta<strong>in</strong>ed here<strong>in</strong> is <strong>in</strong> the public doma<strong>in</strong>.<br />
We strive to make our products available <strong>in</strong> a variety of formats <strong>and</strong> <strong>in</strong> language that is appropriate to a variety of<br />
audiences. You, as our customer, are the best judge of our success <strong>in</strong> communicat<strong>in</strong>g <strong>in</strong>formation effectively. If you<br />
have any comments or suggestions about this or any other NCES product or report, we would like to hear from you.<br />
Please direct your comments to<br />
August 2012<br />
NCES, IES, U.S. Department of <strong>Education</strong><br />
1990 K Street NW<br />
Wash<strong>in</strong>gton, DC 20006-5651<br />
The NCES Home Page address is http://nces.ed.gov.<br />
The NCES Publications <strong>and</strong> Products address is http://nces.ed.gov/pubsearch.<br />
This report was prepared for the National Center for <strong>Education</strong> Statistics under Contract No. ED-IES-12-000716 with<br />
the American Institutes for Research. Mention of trade names, commercial products, or organizations does not imply<br />
endorsement by the U.S. Government.<br />
Suggested Citation<br />
Ross, T., Kena, G., Rathbun, A., KewalRamani, A., Zhang, J., Kristapovich, P., <strong>and</strong> Mann<strong>in</strong>g, E. (2012). <strong>Higher</strong><br />
<strong>Education</strong>: <strong>Gaps</strong> <strong>in</strong> <strong>Access</strong> <strong>and</strong> <strong>Persistence</strong> <strong>Study</strong> (NCES 2012-046). U.S. Department of <strong>Education</strong>, National Center for<br />
<strong>Education</strong> Statistics. Wash<strong>in</strong>gton, DC: Government Pr<strong>in</strong>t<strong>in</strong>g Office.<br />
Content Contact<br />
Terris Ross<br />
(202) 502-7302<br />
terris.ross@ed.gov
Letter from the<br />
Commissioner of the<br />
National Center for <strong>Education</strong> Statistics<br />
August 2012<br />
Numerous studies have documented persistent gaps between the educational atta<strong>in</strong>ment of White males <strong>and</strong><br />
that of Black, Hispanic, American Indian/Alaska Native, <strong>and</strong> Native Hawaiian/Pacific Isl<strong>and</strong>er males. Further,<br />
there is evidence of grow<strong>in</strong>g gender gaps with<strong>in</strong> these racial/ethnic groups, as females participate <strong>and</strong> persist <strong>in</strong><br />
education at higher rates than their male counterparts. In the <strong>in</strong>terest of formulat<strong>in</strong>g policies to address these<br />
gaps, Congress has directed the U.S. Department of <strong>Education</strong> to produce a report document<strong>in</strong>g the gaps <strong>in</strong><br />
access to <strong>and</strong> completion of higher education by m<strong>in</strong>ority males <strong>and</strong> to outl<strong>in</strong>e specific policies that can help<br />
address these gaps (<strong>Higher</strong> <strong>Education</strong> Opportunity Act, H.R. 4137, 110th Cong. §1109, 2008). With<strong>in</strong> the U.S<br />
Department of <strong>Education</strong>, the National Center for <strong>Education</strong> Statistics (NCES) was given the responsibility<br />
for respond<strong>in</strong>g to the component of the m<strong>and</strong>ate related to produc<strong>in</strong>g a report that documents gaps <strong>in</strong> access to<br />
<strong>and</strong> completion of higher education.<br />
The NCES report <strong>Higher</strong> <strong>Education</strong>: <strong>Gaps</strong> <strong>in</strong> <strong>Access</strong> <strong>and</strong> <strong>Persistence</strong> <strong>Study</strong> presents 46 <strong>in</strong>dicators of important<br />
developments <strong>and</strong> trends <strong>in</strong> the education of males <strong>and</strong> females with<strong>in</strong> <strong>and</strong> across specific racial/ethnic groups.<br />
These <strong>in</strong>dicators focus on student demographics, school characteristics, student behaviors <strong>and</strong> afterschool<br />
activities, academic preparation <strong>and</strong> achievement, students’ college knowledge, postsecondary education, <strong>and</strong><br />
postsecondary outcomes <strong>and</strong> employment. In the chapters that follow, we use the most recent data available to<br />
explore the educational achievements <strong>and</strong> challenges of males <strong>and</strong> females, not<strong>in</strong>g where the groups are similar<br />
<strong>and</strong> where they differ.<br />
The primary focus of the <strong>Higher</strong> <strong>Education</strong>: <strong>Gaps</strong> <strong>in</strong> <strong>Access</strong> <strong>and</strong> <strong>Persistence</strong> <strong>Study</strong> is to exam<strong>in</strong>e differences<br />
between males <strong>and</strong> females overall <strong>and</strong> with<strong>in</strong> racial/ethnic groups. The racial/ethnic groups of <strong>in</strong>terest <strong>in</strong>clude<br />
Blacks, Hispanics, Native Hawaiians/Pacific Isl<strong>and</strong>ers, <strong>and</strong> American Indians/Alaska Natives. The secondary<br />
focus of the report is to exam<strong>in</strong>e overall sex <strong>and</strong> racial/ethnic differences. In addition to the <strong>in</strong>dicators,<br />
this report also <strong>in</strong>cludes descriptive multivariate analyses of variables that may <strong>in</strong>fluence male <strong>and</strong> female<br />
postsecondary attendance <strong>and</strong> atta<strong>in</strong>ment <strong>in</strong> different ways.<br />
Jack Buckley<br />
Commissioner<br />
National Center for <strong>Education</strong> Statistics<br />
Letter from the Commissioner iii
iv <strong>Higher</strong> <strong>Education</strong>: <strong>Gaps</strong> <strong>in</strong> <strong>Access</strong> <strong>and</strong> <strong>Persistence</strong> <strong>Study</strong><br />
This page <strong>in</strong>tentionally left blank.
Executive Summary<br />
Numerous studies, <strong>in</strong>clud<strong>in</strong>g those of the National Center<br />
for <strong>Education</strong> Statistics (NCES), have documented<br />
persistent gaps between the educational atta<strong>in</strong>ment of<br />
White males <strong>and</strong> that of Black, Hispanic, American<br />
Indian/Alaska Native, <strong>and</strong> Native Hawaiian/Pacific<br />
Isl<strong>and</strong>er males. Further, there is evidence of grow<strong>in</strong>g<br />
gaps by sex with<strong>in</strong> these racial/ethnic groups, as females<br />
participate <strong>and</strong> persist <strong>in</strong> education at higher rates than<br />
their male counterparts (Aud, Fox, <strong>and</strong> KewalRamani<br />
2010; Aud et al. 2011). In the <strong>in</strong>terest of formulat<strong>in</strong>g<br />
policies to address these gaps, Congress directed the<br />
U.S. Department of <strong>Education</strong> to produce a report<br />
document<strong>in</strong>g the gaps <strong>in</strong> access to <strong>and</strong> completion of<br />
higher education by m<strong>in</strong>ority males <strong>and</strong> to outl<strong>in</strong>e<br />
specific policies that can help address these gaps (<strong>Higher</strong><br />
<strong>Education</strong> Opportunity Act, H.R. 4137, 110th Cong.<br />
§1109, 2008). NCES was directed to produce the <strong>Higher</strong><br />
<strong>Education</strong>: <strong>Gaps</strong> <strong>in</strong> <strong>Access</strong> <strong>and</strong> <strong>Persistence</strong> <strong>Study</strong>, a statistical<br />
report that documents the scope <strong>and</strong> nature of the gaps by<br />
sex <strong>and</strong> by race/ethnicity.<br />
The primary focus of the <strong>Higher</strong> <strong>Education</strong>: <strong>Gaps</strong><br />
<strong>in</strong> <strong>Access</strong> <strong>and</strong> <strong>Persistence</strong> <strong>Study</strong> is to exam<strong>in</strong>e gaps <strong>in</strong><br />
educational participation <strong>and</strong> atta<strong>in</strong>ment between<br />
male Blacks, Hispanics, Native Hawaiians/Pacific<br />
Isl<strong>and</strong>ers, <strong>and</strong> American Indians/Alaska Natives <strong>and</strong><br />
their female counterparts <strong>and</strong> to exam<strong>in</strong>e gaps between<br />
males <strong>in</strong> these racial/ethnic groups <strong>and</strong> White males.<br />
The secondary focus of the report is to exam<strong>in</strong>e overall<br />
sex <strong>and</strong> racial/ethnic differences. In addition to these<br />
descriptive <strong>in</strong>dicators, this report also <strong>in</strong>cludes descriptive<br />
multivariate analyses of variables that are associated<br />
with male <strong>and</strong> female postsecondary attendance <strong>and</strong><br />
atta<strong>in</strong>ment.<br />
Postsecondary attendance rates are generally lower for<br />
youth from lower socioeconomic backgrounds <strong>and</strong><br />
those from various racial/ethnic groups (e.g., Blacks <strong>and</strong><br />
Hispanics) when compared to Whites <strong>and</strong> Asians (Aud<br />
et al. 2011). In 2010, as <strong>in</strong> every year s<strong>in</strong>ce 1980, a lower<br />
percentage of male than female 18- to 24-year-olds were<br />
enrolled either <strong>in</strong> college or graduate school (39 vs. 47<br />
percent). This pattern was also observed for Whites (43<br />
vs. 51 percent), Blacks (31 vs. 43 percent), Hispanics (26<br />
vs. 36 percent), American Indians (24 vs. 33 percent),<br />
<strong>and</strong> persons of two or more races (40 vs. 49 percent). In<br />
addition to college enrollment differences, there are gaps<br />
<strong>in</strong> postsecondary atta<strong>in</strong>ment for males <strong>and</strong> females. For<br />
<strong>in</strong>stance, among first-time students seek<strong>in</strong>g bachelor’s<br />
degrees who started full time at a 4-year college <strong>in</strong> 2004,<br />
a higher percentage of females than males completed<br />
bachelor’s degrees with<strong>in</strong> 6 years (61 vs. 56 percent)—a<br />
pattern that held across all racial/ethnic groups.<br />
This report will document the scope <strong>and</strong> nature of a<br />
number of differences between sex <strong>and</strong> racial/ethnic<br />
groups <strong>in</strong> education preparation <strong>and</strong> achievement as<br />
well as differences <strong>in</strong> postsecondary access, persistence,<br />
<strong>and</strong> atta<strong>in</strong>ment between males <strong>and</strong> females with<strong>in</strong> <strong>and</strong><br />
across racial/ethnic groups. The report presents <strong>in</strong>dicators<br />
that <strong>in</strong>clude the most recently available, nationally<br />
representative data from NCES, other federal agencies,<br />
<strong>and</strong> selected items from the ACT <strong>and</strong> the College Board.<br />
The report draws on multiple sources that represent<br />
different years <strong>and</strong> different populations.<br />
Demographic Context<br />
Children <strong>in</strong> Poverty <strong>and</strong> Language M<strong>in</strong>orities<br />
In 2010, some 21 percent of children under age 18 were<br />
liv<strong>in</strong>g <strong>in</strong> poverty, <strong>and</strong> the poverty rate for children liv<strong>in</strong>g<br />
with a female parent with no spouse present was<br />
44 percent. The poverty rate for children liv<strong>in</strong>g with<br />
a female parent with no spouse present was higher for<br />
American Indian children (53 percent) than for children<br />
of all other racial/ethnic groups (with the exception of<br />
Black <strong>and</strong> Hispanic children). There were no measurable<br />
differences <strong>in</strong> male versus female poverty rates for children<br />
liv<strong>in</strong>g with a female parent with no spouse present.<br />
Also, <strong>in</strong> 2010, some 11.8 million children ages 5 to<br />
17 (about 22 percent of the school-age population)<br />
spoke a language other than English at home (2.7 million<br />
speak<strong>in</strong>g English with difficulty). The percentage who<br />
spoke a language other than English at home <strong>and</strong> spoke<br />
English with difficulty was higher for Hispanics<br />
(16 percent) <strong>and</strong> Asians (15 percent) than for Alaska<br />
Natives (7 percent), Native Hawaiians/Pacific Isl<strong>and</strong>ers<br />
(5 percent), American Indians (2 percent), children of two<br />
or more races (2 percent), Whites (1 percent), <strong>and</strong> Blacks<br />
(1 percent). No measurable differences were observed<br />
between males <strong>and</strong> females overall. However, higher<br />
percentages of Asian <strong>and</strong> Hispanic males (16 percent each)<br />
spoke a language other than English at home <strong>and</strong> spoke<br />
English with difficulty than females (14 <strong>and</strong> 15 percent,<br />
respectively) <strong>in</strong> their racial/ethnic group. In addition, a<br />
higher percentage of Hispanic school-age children born<br />
outside of the United States spoke a non-English language<br />
at home <strong>and</strong> spoke English with difficulty than did their<br />
counterparts born with<strong>in</strong> the United States (35 vs.<br />
13 percent).<br />
Parents’ <strong>Education</strong>al Atta<strong>in</strong>ment <strong>and</strong><br />
Involvement <strong>in</strong> <strong>Education</strong><br />
In 2010, about 11 percent of children between the ages<br />
of 6 <strong>and</strong> 18 lived <strong>in</strong> a household where neither parent<br />
had earned at least a high school credential (either a<br />
diploma or an equivalency credential such as a General<br />
<strong>Education</strong>al Development [GED] certificate). The<br />
percentage of children with parents who had not earned<br />
a high school credential was 11 percent for both males<br />
<strong>and</strong> females. Also, no measurable differences by sex<br />
with<strong>in</strong> racial/ethnic groups were found at any of the<br />
three levels of educational atta<strong>in</strong>ment exam<strong>in</strong>ed (less<br />
than high school completion, high school completion,<br />
Executive Summary<br />
Executive Summary v
<strong>and</strong> bachelor’s or higher degree completion). However,<br />
differences by race/ethnicity were observed. For example,<br />
the percentages of Asian (59 percent), White (44 percent),<br />
<strong>and</strong> children of two or more races (38 percent) who had<br />
parents with a bachelor’s degree or higher were higher<br />
than the correspond<strong>in</strong>g percentages of Black (20 percent),<br />
Hispanic (16 percent), Native Hawaiian/Pacific Isl<strong>and</strong>er<br />
(18 percent), American Indian (18 percent), <strong>and</strong> Alaska<br />
Native children (16 percent).<br />
In 2007, parents’ participation <strong>in</strong> their children’s<br />
education varied by type of <strong>in</strong>volvement. For example,<br />
among students <strong>in</strong> k<strong>in</strong>dergarten through 12th grade,<br />
about 89 percent had parents who reported attend<strong>in</strong>g<br />
a general school or PTO/PTA meet<strong>in</strong>g, 78 percent had<br />
parents who reported attend<strong>in</strong>g regularly scheduled<br />
parent-teacher conferences, 74 percent had parents who<br />
reported attend<strong>in</strong>g a school or class event, 65 percent had<br />
parents who reported participat<strong>in</strong>g <strong>in</strong> school fundrais<strong>in</strong>g,<br />
<strong>and</strong> 46 percent had parents who reported volunteer<strong>in</strong>g<br />
or serv<strong>in</strong>g on a school committee. A higher percentage<br />
of female than male students had parents who reported<br />
participation <strong>in</strong> such school-related activities as attend<strong>in</strong>g<br />
a school or class event or volunteer<strong>in</strong>g or serv<strong>in</strong>g on<br />
a school committee. However, a higher percentage<br />
of males than females had parents who attended<br />
regularly scheduled parent-teacher conferences. Parental<br />
participation <strong>in</strong> some school-related activities varied by<br />
race/ethnicity. For example, 77 percent of White males<br />
had parents who reported attend<strong>in</strong>g a school or class<br />
event, compared with 62 percent of Black males <strong>and</strong><br />
61 percent of Hispanic males.<br />
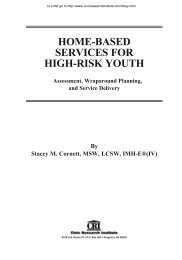
Special Needs Children<br />
In 2009, about 10 percent of 9th-grade students received<br />
special education services. A higher percentage of male<br />
(13 percent) than female (7 percent) students received<br />
special education services. This pattern was also found<br />
for Whites (13 vs. 8 percent), Blacks (16 vs. 7 percent),<br />
Hispanics (12 vs. 6 percent), <strong>and</strong> students of two or<br />
more races (14 vs. 7 percent). Among male students, a<br />
higher percentage of American Indian/Alaska Natives<br />
(27 percent), Whites (13 percent), Blacks (16 percent),<br />
Hispanics (12 percent), <strong>and</strong> males of two or more races<br />
(14 percent) received special education services than Asian<br />
males (2 percent).<br />
Characteristics of Schools<br />
Racial/Ethnic Concentration <strong>and</strong> Poverty <strong>in</strong><br />
Schools<br />
In 2010–11, over 49 million students were enrolled <strong>in</strong><br />
public elementary <strong>and</strong> secondary schools. Enrollment<br />
patterns for males <strong>and</strong> females were similar with<strong>in</strong><br />
racial/ethnic groups. Look<strong>in</strong>g at enrollment patterns by<br />
students’ race/ethnicity, 84 percent of White students<br />
attended a predom<strong>in</strong>antly White school (a school where<br />
at least 50 percent of the students were White), 46 percent<br />
of Black students attended a predom<strong>in</strong>antly Black school,<br />
56 percent of Hispanic students attended a predom<strong>in</strong>antly<br />
Hispanic school, 12 percent of Asians attended a<br />
predom<strong>in</strong>antly Asian school, 13 percent of Pacific Isl<strong>and</strong>er<br />
students attended a predom<strong>in</strong>antly Pacific Isl<strong>and</strong>er<br />
school, <strong>and</strong> 23 percent of American Indian/Alaska Native<br />
students attended a predom<strong>in</strong>antly American Indian/<br />
Figure 1.<br />
Percent<br />
(Figure 5-1) Percentage of students receiv<strong>in</strong>g special education services <strong>in</strong> 9th grade, by race/ethnicity <strong>and</strong><br />
sex: 2009<br />
60<br />
50<br />
40<br />
30<br />
27!<br />
20<br />
10<br />
0<br />
16<br />
19!<br />
13<br />
13<br />
12<br />
7<br />
8<br />
7<br />
6<br />
2!<br />
1!<br />
Total 1 White Black Hispanic Asian American Indian/<br />
Alaska Native<br />
Race/ethnicity<br />
14<br />
7<br />
Two or<br />
more races<br />
Male<br />
Female<br />
! Interpret data with caution. The coefficient of variation (CV) for this estimate is 30 percent or greater.<br />
1<br />
Total <strong>in</strong>cludes other racial/ethnic groups not shown separately <strong>in</strong> the figure.<br />
NOTE: Report<strong>in</strong>g st<strong>and</strong>ards for Native Hawaiians/Pacific Isl<strong>and</strong>ers were not met; therefore, data for this group are not shown <strong>in</strong> the figure. Race categories<br />
exclude persons of Hispanic ethnicity.<br />
SOURCE: U.S. Department of <strong>Education</strong>, National Center for <strong>Education</strong> Statistics, High School Longitud<strong>in</strong>al <strong>Study</strong> of 2009, Base-Year Restricted-Use Data File.<br />
vi <strong>Higher</strong> <strong>Education</strong>: <strong>Gaps</strong> <strong>in</strong> <strong>Access</strong> <strong>and</strong> <strong>Persistence</strong> <strong>Study</strong>
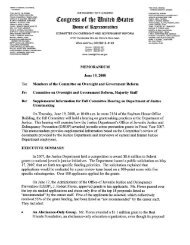
Figure 2.<br />
(Figure 6-2) Percentage of students <strong>in</strong> low- <strong>and</strong> high-poverty public elementary <strong>and</strong> secondary schools, by<br />
race/ethnicity <strong>and</strong> sex: School year 2010–11<br />
Percent<br />
60<br />
50<br />
40<br />
30<br />
20<br />
10<br />
0<br />
24 24<br />
33 33<br />
9 9<br />
Low-poverty schools<br />
13 13<br />
38 39 14 14<br />
Total 1 White Black Hispanic Asian Pacific<br />
Isl<strong>and</strong>er<br />
11 11<br />
American<br />
Indian/<br />
Alaska<br />
Native<br />
25 25<br />
Two or<br />
more<br />
races<br />
2020<br />
6 6<br />
42 41<br />
High-poverty schools<br />
38 38<br />
15 14<br />
19 19<br />
31 31<br />
16<br />
15<br />
Total 1 White Black Hispanic Asian Pacific American Two or<br />
Isl<strong>and</strong>er Indian/<br />
Alaska<br />
Native<br />
more<br />
races<br />
Executive Summary<br />
Race/ethnicity<br />
Male<br />
Female<br />
1<br />
Total <strong>in</strong>cludes other racial/ethnic groups not shown separately <strong>in</strong> the figure.<br />
NOTE: Low-poverty schools are those where 25 percent or fewer students were eligible for free or reduced-price lunch; high-poverty schools are those where<br />
more than 75 percent of students were eligible for free or reduced-price lunch. Race categories exclude persons of Hispanic ethnicity.<br />
SOURCE: U.S. Department of <strong>Education</strong>, National Center for <strong>Education</strong> Statistics, Common Core of Data (CCD), “Public Elementary/Secondary School<br />
Universe Survey,” 2010–11.<br />
Alaska Native school. Other racial/ethnic patterns<br />
<strong>in</strong>clude higher enrollment at high-poverty schools for<br />
Black (41 percent), Hispanic (38 percent), <strong>and</strong> American<br />
Indian/Alaska Native students (31 percent) than for<br />
Pacific Isl<strong>and</strong>er (19 percent), two or more races<br />
(16 percent), Asian (15 percent), <strong>and</strong> White students<br />
(6 percent).<br />
Adequate Yearly Progress <strong>and</strong> Special<br />
Schools<br />
In 2008–09, some 60 percent of public school students<br />
attended a school that met adequate yearly progress<br />
(AYP), an <strong>in</strong>dividual state’s measure toward achiev<strong>in</strong>g<br />
state academic st<strong>and</strong>ards based on criteria conta<strong>in</strong>ed <strong>in</strong><br />
the Elementary <strong>and</strong> Secondary <strong>Education</strong> Act (ESEA)<br />
Reauthorization. No measurable differences <strong>in</strong> school<br />
AYP status were found between males <strong>and</strong> females (overall<br />
or by race/ethnicity). However, racial/ethnic differences<br />
were observed. <strong>Higher</strong> percentages of Black (46 percent),<br />
Hispanic (48 percent), Asian/Pacific Isl<strong>and</strong>er (40 percent),<br />
<strong>and</strong> American Indian/Alaska Native students (40 percent)<br />
than White students (33 percent) attended schools that<br />
did not meet AYP. The percentage of students attend<strong>in</strong>g<br />
schools that did not meet AYP was similar for males<br />
<strong>and</strong> females (both overall <strong>and</strong> with<strong>in</strong> each racial/ethnic<br />
group), although it did vary by race/ethnicity.<br />
In 2010–11, nearly all students (98 percent) <strong>in</strong> public<br />
elementary <strong>and</strong> secondary schools <strong>in</strong> the United States<br />
attended regular public schools, 1 percent attended<br />
alternative schools, 1 <strong>and</strong> less than 1 percent each attended<br />
special education schools <strong>and</strong> vocational education<br />
schools. About 4 percent each of students attended charter<br />
1<br />
An alternative school is a public elementary/secondary school that (1) addresses<br />
needs of students that typically cannot be met <strong>in</strong> a regular school, (2) provides<br />
nontraditional education, (3) serves as an adjunct to a regular school, or (4) falls<br />
outside the categories of regular, special education, or vocational education.<br />
schools <strong>and</strong> magnet schools, most of which were also<br />
classified as regular schools. At alternative schools end<strong>in</strong>g<br />
<strong>in</strong> grade 12, males enrolled at higher rates than females<br />
did both overall <strong>and</strong> with<strong>in</strong> each racial/ethnic group<br />
studied.<br />
High School Guidance Counsel<strong>in</strong>g<br />
In 2009, about 48 percent of 9th-graders had high school<br />
guidance counselors who reported that the counsel<strong>in</strong>g<br />
program’s primary goal was to help students plan <strong>and</strong><br />
prepare for postsecondary education, <strong>and</strong> 35 percent had<br />
counselors who reported that the primary goal was to<br />
help students improve their achievement <strong>in</strong> high school.<br />
No measurable differences were found between male <strong>and</strong><br />
female 9th-graders (overall or with<strong>in</strong> racial/ethnic groups)<br />
for either of the primary counsel<strong>in</strong>g goals. However, a<br />
higher percentage of Asian 9th-graders (60 percent) than<br />
Black (44 percent), Hispanic (41 percent), <strong>and</strong> American<br />
Indian/Alaska Native 9th-graders (29 percent) had<br />
counselors who reported that the primary counsel<strong>in</strong>g<br />
program goal was help<strong>in</strong>g students plan <strong>and</strong> prepare<br />
for postsecondary education. Among male 9th-graders,<br />
higher percentages of Asians (56 percent) <strong>and</strong> Whites<br />
(51 percent) than Hispanics (38 percent) attended schools<br />
<strong>in</strong> which the counsel<strong>in</strong>g program’s primary goal was<br />
postsecondary plann<strong>in</strong>g <strong>and</strong> preparation.<br />
Student Behaviors <strong>and</strong> Afterschool<br />
Activities<br />
Retention, Suspension, <strong>and</strong> Expulsion<br />
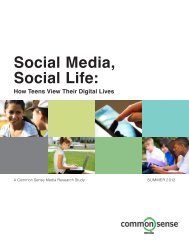
Accord<strong>in</strong>g to parent reports, <strong>in</strong> 2009, some 13 percent<br />
of 9th-grade students had been reta<strong>in</strong>ed <strong>in</strong> any of grades<br />
k<strong>in</strong>dergarten through 9. In 2009, a higher percentage of<br />
males than females had been reta<strong>in</strong>ed <strong>in</strong> any grade. Also,<br />
Executive Summary vii
Figure 3.<br />
(Figure 11-1) Percentage of 9th-grade students who had ever been reta<strong>in</strong>ed <strong>in</strong> any of grades k<strong>in</strong>dergarten<br />
through 9, by race/ethnicity <strong>and</strong> sex: 2009<br />
Percent<br />
60<br />
50<br />
40<br />
30<br />
29<br />
20<br />
10<br />
15<br />
10<br />
11<br />
8<br />
21<br />
20<br />
10<br />
4!<br />
3!<br />
13<br />
9<br />
0<br />
Total 1 White Black Hispanic Asian Two or more races<br />
Race/ethnicity<br />
Male<br />
Female<br />
! Interpret data with caution. The coefficient of variation (CV) is 30 percent or greater.<br />
1<br />
Total <strong>in</strong>cludes other racial/ethnic groups not shown separately <strong>in</strong> the figure.<br />
NOTE: Data are based on parent responses. Report<strong>in</strong>g st<strong>and</strong>ards for Native Hawaiian/Pacific Isl<strong>and</strong>er males <strong>and</strong> females <strong>and</strong> American Indian/Alaska Native<br />
females were not met; therefore, data for Native Hawaiian/Pacific Isl<strong>and</strong>er <strong>and</strong> American Indian/Alaska Native males <strong>and</strong> females are not shown <strong>in</strong> the<br />
figure. Data weighted by W1PARENT. Race categories exclude persons of Hispanic ethnicity.<br />
SOURCE: U.S. Department of <strong>Education</strong>, National Center for <strong>Education</strong> Statistics, High School Longitud<strong>in</strong>al <strong>Study</strong> of 2009, Base-Year Restricted-Use File.<br />
compared with their female peers, higher percentages<br />
of White, Black, <strong>and</strong> Hispanic male students had been<br />
suspended or expelled. For example, there was a difference<br />
of 18 percentage po<strong>in</strong>ts between Black males <strong>and</strong> females<br />
on this percentage (42 vs. 24 percent).<br />
Student Safety at School<br />
In 2009, some 8 percent of students <strong>in</strong> grades 9 through<br />
12 reported that they had been threatened or <strong>in</strong>jured with<br />
a weapon, 11 percent reported that they had engaged<br />
<strong>in</strong> a physical fight, <strong>and</strong> 23 percent reported that drugs<br />
were available to them on school property <strong>in</strong> the past 12<br />
months. Six percent of students reported hav<strong>in</strong>g carried<br />
a weapon to school on one or more of the past 30 days.<br />
Overall, males reported hav<strong>in</strong>g each of these experiences<br />
at higher rates than females did. Among male students,<br />
a lower percentage of Whites were threatened or <strong>in</strong>jured<br />
with a weapon (8 percent) than were Blacks (11 percent),<br />
Hispanics (12 percent), <strong>and</strong> persons of two or more races<br />
(14 percent). No measurable differences <strong>in</strong> the percentages<br />
of students carry<strong>in</strong>g a weapon on school property were<br />
found among males by race/ethnicity: between 6 <strong>and</strong> 8<br />
percent of males reported carry<strong>in</strong>g a weapon on school<br />
property.<br />
Student Use of Alcohol <strong>and</strong> Other Drugs<br />
Concern<strong>in</strong>g alcohol <strong>and</strong> other drugs, 19 percent of<br />
students <strong>in</strong> grades 9 through 12 reported hav<strong>in</strong>g smoked<br />
a cigarette, 42 percent reported hav<strong>in</strong>g drank alcohol, <strong>and</strong><br />
21 percent reported hav<strong>in</strong>g smoked marijuana on one or<br />
more of the past 30 days. Six percent of students reported<br />
hav<strong>in</strong>g ever used coca<strong>in</strong>e, 12 percent reported hav<strong>in</strong>g<br />
ever used <strong>in</strong>halants, <strong>and</strong> 4 percent reported hav<strong>in</strong>g ever<br />
used methamphetam<strong>in</strong>es. Overall, higher percentages of<br />
males than females reported hav<strong>in</strong>g smoked marijuana<br />
<strong>in</strong> the past month, ever used coca<strong>in</strong>e, <strong>and</strong> ever used<br />
methamphetam<strong>in</strong>es <strong>in</strong> 2009. In contrast, a higher<br />
percentage of females than males reported hav<strong>in</strong>g ever<br />
used <strong>in</strong>halants; there were no measurable differences <strong>in</strong><br />
the overall percentage of males <strong>and</strong> females report<strong>in</strong>g the<br />
use of alcohol.<br />
Homework<br />
In 2007, accord<strong>in</strong>g to parent reports, 93 percent of<br />
high school students <strong>in</strong> grades 9 through 12 did some<br />
homework outside of school. In addition, the parents<br />
of 65 percent of high school students checked to ensure<br />
that their homework was completed. The percentage<br />
of high school students whose parents checked for<br />
homework completion was higher for males than for<br />
females (68 vs. 61 percent). Check<strong>in</strong>g for homework<br />
completion was more prevalent among the parents of<br />
Black males (86 percent) than among the parents of<br />
White (61 percent), Hispanic (74 percent), <strong>and</strong> Asian<br />
(58 percent) males <strong>and</strong> the parents of males of two or<br />
more races (66 percent).<br />
Part-Time Employment<br />
In 2010, about 17 percent of high school students ages<br />
16 <strong>and</strong> older were employed. Several differences <strong>in</strong><br />
employment rates were found by race/ethnicity <strong>and</strong> sex.<br />
White students had the highest rate of employment at 22<br />
percent. Among White <strong>and</strong> Black students <strong>and</strong> students<br />
of two or more races, higher percentages of females than<br />
males were employed. The opposite pattern was observed<br />
viii <strong>Higher</strong> <strong>Education</strong>: <strong>Gaps</strong> <strong>in</strong> <strong>Access</strong> <strong>and</strong> <strong>Persistence</strong> <strong>Study</strong>
for Asian students: 10 percent of Asian males worked,<br />
compared with 7 percent of Asian females.<br />
Academic Preparation <strong>and</strong><br />
Achievement<br />
Read<strong>in</strong>g, Mathematics, <strong>and</strong> Science<br />
Achievement<br />
At the 4th- <strong>and</strong> 8th-grade levels <strong>in</strong> 2011, higher<br />
percentages of females than males scored at or above<br />
Proficient on the National Assessment of <strong>Education</strong>al<br />
Progress (NAEP) read<strong>in</strong>g assessment. For example, at the<br />
8th-grade level, 38 percent of females scored at or above<br />
Proficient, compared to 29 percent of males. This pattern<br />
by sex was found for all racial/ethnic groups except for<br />
Native Hawaiians/Pacific Isl<strong>and</strong>ers <strong>in</strong> the 4th grade <strong>and</strong><br />
Native Hawaiians/Pacific Isl<strong>and</strong>ers <strong>and</strong> American Indians/<br />
Alaska Natives <strong>in</strong> the 8th grade. In 2009, the most recent<br />
year for which 12th-grade NAEP data were available, a<br />
higher percentage of 12th-grade females than males scored<br />
at or above Proficient <strong>in</strong> read<strong>in</strong>g (43 vs. 32 percent). This<br />
pattern was also found for White, Black, <strong>and</strong> Hispanic<br />
12th-graders.<br />
In 2011, some 40 percent of 4th-graders <strong>and</strong> 35 percent<br />
of 8th-graders scored at or above the Proficient level on the<br />
NAEP mathematics assessment. In 2009, the most recent<br />
year for which 12th-grade NAEP data were available,<br />
some 26 percent of 12th-graders scored at or above the<br />
Proficient level <strong>in</strong> mathematics. In both the 4th <strong>and</strong> 8th<br />
grades, higher percentages of males than females scored<br />
at or above Proficient on the mathematics portion of<br />
NAEP <strong>in</strong> 2011. For example, at the 4th-grade level, 42<br />
percent of males scored at or above Proficient, compared<br />
to 39 percent of females. This pattern was also found<br />
for White <strong>and</strong> Hispanic students <strong>in</strong> the 4th grade <strong>and</strong><br />
for White students <strong>in</strong> the 8th grade. In contrast, a lower<br />
percentage of 8th-grade Native Hawaiian/Pacific Isl<strong>and</strong>er<br />
males (17 percent) than females (28 percent) scored at or<br />
above Proficient <strong>in</strong> mathematics. Among the rema<strong>in</strong><strong>in</strong>g<br />
racial/ethnic groups, the percentages of males <strong>and</strong> females<br />
scor<strong>in</strong>g at or above Proficient did not measurably differ at<br />
either grade level. Among 12th-graders <strong>in</strong> 2009, higher<br />
percentages of males than females scored at or above<br />
Proficient on the NAEP mathematics assessment. This<br />
pattern was also found for White <strong>and</strong> Hispanic students.<br />
In 2009, at all three grade levels, a higher percentage<br />
of males than females scored at or above Proficient on the<br />
NAEP science assessment. This pattern by sex held among<br />
White students <strong>in</strong> the 4th grade <strong>and</strong> among White,<br />
Hispanic, Asian/Pacific Isl<strong>and</strong>er, <strong>and</strong> American Indian/<br />
Alaska Native students <strong>in</strong> the 8th grade. It also held<br />
among White <strong>and</strong> Hispanic students <strong>in</strong> the 12th grade:<br />
32 percent of White males scored at or above Proficient,<br />
compared with 22 percent of White females; <strong>and</strong><br />
11 percent of Hispanic males scored at or above Proficient,<br />
compared with 6 percent of Hispanic females.<br />
Eighth-Grade Algebra<br />
The Early Childhood Longitud<strong>in</strong>al <strong>Study</strong>, K<strong>in</strong>dergarten<br />
Class of 1998–99 (ECLS-K) assessed students’<br />
mathematics achievement <strong>in</strong> elementary <strong>and</strong> middle<br />
school <strong>and</strong> collected <strong>in</strong>formation from students’<br />
mathematics teachers on their mathematics coursetak<strong>in</strong>g<br />
<strong>in</strong> 8th grade. Of the students who scored <strong>in</strong> the top half<br />
of the ECLS-K 5th-grade mathematics assessment <strong>in</strong> the<br />
spr<strong>in</strong>g of 2004, 58 percent went on to enroll <strong>in</strong> algebra<br />
or a more advanced mathematics course <strong>in</strong> 8th grade <strong>in</strong><br />
the spr<strong>in</strong>g of 2007. A higher percentage of males than<br />
females scored <strong>in</strong> the top half of the ECLS-K 5th-grade<br />
mathematics assessment (54 vs. 46 percent); however, of<br />
students that scored <strong>in</strong> the top half, a lower percentage<br />
of males than females went on to enroll <strong>in</strong> algebra or a<br />
more advanced course <strong>in</strong> 8th grade (51 vs. 66 percent).<br />
Among males who scored <strong>in</strong> the top half of the 5th-grade<br />
assessment, the percentage of Black students enrolled<br />
<strong>in</strong> algebra or an advanced course other than algebra by<br />
8th grade (20 percent) was lower than the percentages of<br />
Asian (92 percent), White (54 percent), <strong>and</strong> Hispanic<br />
(51 percent) students enrolled.<br />
Advanced Placement Exams <strong>and</strong> College<br />
Entrance Exams<br />
In May 2010, about 58 percent of students who took an<br />
Advanced Placement (AP) exam received a score of 3 or<br />
higher <strong>in</strong> at least one subject area. A higher percentage of<br />
males than females received a score of 3 or higher on any<br />
AP exam (61 percent vs. 54 percent). This pattern held<br />
across all racial/ethnic groups. Among males, 69 percent<br />
of Asian/Pacific Isl<strong>and</strong>ers received a score of 3 or higher,<br />
compared with 67 percent of White students, 48 percent<br />
of American Indian/Alaska Native students, 44 percent<br />
of Hispanic students, <strong>and</strong> 29 percent of Black students.<br />
In 2011, some 25 percent of all students who took the<br />
ACT met or exceeded the ACT college read<strong>in</strong>ess score<br />
<strong>in</strong> all four subject areas (English, mathematics, read<strong>in</strong>g,<br />
<strong>and</strong> science). A higher percentage of males than females<br />
(28 vs. 22 percent) achieved all four ACT college<br />
benchmark scores. This pattern held across all racial/<br />
ethnic groups. <strong>Higher</strong> percentages of males than females<br />
achieved the four benchmark scores with<strong>in</strong> the Asian<br />
(44 vs. 37 percent), White (35 vs. 28 percent), Native<br />
Hawaiian/Pacific Isl<strong>and</strong>er (18 vs. 12 percent), Hispanic<br />
(14 vs. 9 percent), American Indian/Alaska Native (14 vs.<br />
10 percent), <strong>and</strong> Black (5 vs. 4 percent) racial/ethnic<br />
groups.<br />
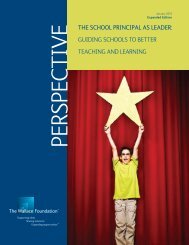
Averaged Freshman Graduation Rates<br />
The averaged freshman graduation rate (AFGR) estimates<br />
the proportion of public high school freshmen who<br />
graduate with a regular diploma 2 4 years after start<strong>in</strong>g<br />
9th grade. The AFGR for the class of 2008–09 was<br />
2<br />
Regular diploma recipients are students who meet or exceed the coursework <strong>and</strong><br />
performance st<strong>and</strong>ards for high school completion established by a state or another<br />
relevant authority. Other high school completers who were awarded alternate<br />
credentials such as a certificate of completion or an equivalency credential are not<br />
<strong>in</strong>cluded <strong>in</strong> the AFGR calculations because they are not considered regular graduates.<br />
Executive Summary<br />
Executive Summary ix
Figure 4.<br />
(Figure 25-1) Averaged freshman graduation rate (AFGR) <strong>in</strong> public schools, by race/ethnicity <strong>and</strong> sex:<br />
2008–09<br />
Percent<br />
100<br />
80<br />
60<br />
72<br />
79 79<br />
84<br />
57<br />
69<br />
60<br />
70<br />
88<br />
93<br />
61<br />
68<br />
40<br />
20<br />
0<br />
Total¹ White Black Hispanic Asian/Pacific<br />
Isl<strong>and</strong>er<br />
Race/ethnicity<br />
American Indian/<br />
Alaska Native 2<br />
Male<br />
Female<br />
1<br />
Total <strong>in</strong>cludes other racial/ethnic groups not shown separately <strong>in</strong> the figure. The United States total <strong>in</strong>cludes all 50 states <strong>and</strong> the District of Columbia.<br />
2<br />
The rate for American Indians/Alaska Natives excludes students served <strong>in</strong> schools operated by the Bureau of Indian <strong>Education</strong>.<br />
NOTE: AFGR is an estimate of the percentage of an enter<strong>in</strong>g freshman class graduat<strong>in</strong>g <strong>in</strong> 4 years. For 2008–09, it equals the total number of diploma<br />
recipients <strong>in</strong> 2008–09 divided by the average membership of the 8th-grade class <strong>in</strong> 2004–05, the 9th-grade class <strong>in</strong> 2005–06, <strong>and</strong> the 10th-grade class <strong>in</strong><br />
2006–07.<br />
SOURCE: U.S. Department of <strong>Education</strong>, National Center for <strong>Education</strong> Statistics, Common Core of Data (CCD), State Dropout <strong>and</strong> Completer Data File:<br />
School year 2007–08, version 1b; School year 2008–09, version 1a State Non-Fiscal Data File: School year 2003–04, version 1b; 2004–05, version 1f; 2005–06<br />
version 1b; 2006–07, version 1c LEA Dropout <strong>and</strong> Completer Data File (Restricted-Use): School year 2008–09, version 1a School File: School year 2003–04,<br />
version 1a; 2004–05, version 1b; 2005–06, version 1a; 2006–07, version 1c; 2008–09, version 1b.<br />
75.5 percent. A lower percentage of males than females<br />
graduated with a regular diploma (71.8 vs. 78.9 percent).<br />
This pattern was also found for Whites (78.9 vs. 84.0<br />
percent), Blacks (57.3 vs. 69.3 percent), Hispanics (60.3<br />
vs. 69.7 percent), Asians/Pacific Isl<strong>and</strong>ers (88.0 vs. 93.1<br />
percent), <strong>and</strong> American Indians/Alaska Natives (60.5 vs.<br />
67.7 percent) <strong>in</strong> the class of 2008–09. The AFGRs for<br />
males were also lower than the AFGRs for females across<br />
all 50 states <strong>and</strong> the District of Columbia.<br />
College Knowledge<br />
Postsecondary Plans <strong>and</strong> Steps Toward<br />
Postsecondary Enrollment<br />
In 2009, 9th-graders were asked to <strong>in</strong>dicate the highest<br />
level of education they expected to achieve. A lower<br />
percentage of males than females (53 vs. 59 percent)<br />
expected to complete a bachelor’s or graduate/professional<br />
degree. This pattern held for White males <strong>and</strong> females<br />
(56 vs. 63 percent) <strong>and</strong> Black males <strong>and</strong> females (54 vs.<br />
61 percent), but no measurable differences by sex were<br />
observed for other racial/ethnic groups. About 60 percent<br />
of Asian males, 59 percent of males of two or more races,<br />
56 percent of White males, <strong>and</strong> 54 percent of Black<br />
males expected to complete at least a bachelor’s degree,<br />
compared with 44 percent of Hispanic males <strong>and</strong><br />
33 percent of American Indian/Alaska Native males.<br />
In 2004, some 57 percent of high school seniors had taken<br />
or planned to take the College Board Prelim<strong>in</strong>ary SAT<br />
(PSAT), <strong>and</strong> 82 percent had taken or planned to take the<br />
SAT or the ACT. Overall, a higher percentage of females<br />
than males had taken or planned to take these tests, a<br />
pattern that held for the White <strong>and</strong> Asian subgroups. No<br />
measurable differences between males <strong>and</strong> females were<br />
found for other racial/ethnic groups.<br />
In 2004, a higher percentage of female than male high<br />
school seniors had postsecondary aspirations (96 vs.<br />
90 percent). This pattern held for White, Black, Hispanic,<br />
<strong>and</strong> American Indian/Alaska Native males <strong>and</strong> females.<br />
Also, a higher percentage of females than males with<br />
postsecondary aspirations applied to at least one<br />
postsecondary <strong>in</strong>stitution while <strong>in</strong> high school (78 vs.<br />
70 percent), a f<strong>in</strong>d<strong>in</strong>g which held for White, Black,<br />
Hispanic, <strong>and</strong> Asian students.<br />
Informational Resources<br />
In 2004, among high school seniors with postsecondary<br />
aspirations, a higher percentage of females than males<br />
went to a high school counselor, teacher, or coach for<br />
<strong>in</strong>formation on college entrance requirements (86 vs.<br />
83 percent). A higher percentage of female than male<br />
college aspirants consulted college websites, publications,<br />
or search guides for <strong>in</strong>formation on college entrance<br />
requirements (80 vs. 68 percent). This pattern held for<br />
Whites (82 vs. 70 percent), Blacks (80 vs. 64 percent),<br />
Hispanics (68 vs. 55 percent), Asians (84 vs. 75 percent),<br />
<strong>and</strong> those of two or more races (85 vs. 70 percent). Also, a<br />
higher percentage of females than males consulted college<br />
representatives for <strong>in</strong>formation about college entrance<br />
x <strong>Higher</strong> <strong>Education</strong>: <strong>Gaps</strong> <strong>in</strong> <strong>Access</strong> <strong>and</strong> <strong>Persistence</strong> <strong>Study</strong>
equirements (62 vs. 55 percent). This pattern was also<br />
found for White <strong>and</strong> Hispanic males <strong>and</strong> females.<br />
Postsecondary School Choice Factors<br />
In 2004, among the 93 percent of high school seniors<br />
with postsecondary aspirations, 67 percent reported that<br />
the availability of courses was very important to them<br />
when select<strong>in</strong>g an educational <strong>in</strong>stitution. Seniors with<br />
postsecondary aspirations also reported the follow<strong>in</strong>g as<br />
very important choice factors: low expenses (36 percent),<br />
the availability of f<strong>in</strong>ancial aid (57 percent), <strong>and</strong> an<br />
<strong>in</strong>stitution’s academic reputation (58 percent). <strong>Higher</strong><br />
percentages of females than males considered all of these<br />
school choice factors to be very important to their school<br />
choice.<br />
However, higher percentages of males than females<br />
reported other postsecondary choice factors as very<br />
important. Among seniors with postsecondary aspirations,<br />
15 percent thought an <strong>in</strong>stitution’s athletic program was<br />
very important, <strong>and</strong> 30 percent thought an <strong>in</strong>stitution’s<br />
social life was very important. <strong>Higher</strong> percentages of<br />
males than females reported athletic programs (19 vs.<br />
11 percent) <strong>and</strong> social life (33 vs. 27 percent) as very<br />
important. A similar pattern was found for Whites,<br />
Blacks, Hispanics, Asians, <strong>and</strong> students of two or more<br />
races for an <strong>in</strong>stitution’s athletic programs <strong>and</strong> for Whites,<br />
Blacks, Hispanics, Asians, <strong>and</strong> American Indians/Alaska<br />
Natives for its social life.<br />
Some 83 percent of students who were high school<br />
seniors <strong>in</strong> 2004 had applied to college by 2006. A lower<br />
percentage of males applied to college than females<br />
(79 vs. 87 percent)—a pattern that held for Whites (81 vs.<br />
88 percent), Blacks (77 vs. 85 percent), <strong>and</strong> Hispanics<br />
(73 vs. 82 percent). No measurable differences between<br />
males <strong>and</strong> females were found for Asians, American<br />
Indians/Alaska Natives, <strong>and</strong> students of two or more<br />
races.<br />
Postsecondary <strong>Education</strong><br />
Enrollment Rates for 18- to 24-Year-Olds<br />
A higher percentage of 18- to 24-year-olds were enrolled<br />
<strong>in</strong> either college or graduate school <strong>in</strong> 2010 than <strong>in</strong><br />
2006 (43 vs. 40 percent), a pattern that held for males<br />
<strong>and</strong> females. In 2010, as <strong>in</strong> every year s<strong>in</strong>ce 1980, a lower<br />
percentage of male than female 18- to 24-year-olds were<br />
enrolled either <strong>in</strong> college or graduate school (39 vs.<br />
47 percent). This pattern was also observed for Whites<br />
(43 vs. 51 percent), Blacks (31 vs. 43 percent), Hispanics<br />
(26 vs. 36 percent), American Indians (24 vs. 33 percent),<br />
<strong>and</strong> persons of two or more races (40 vs. 49 percent).<br />
Entry to Postsecondary <strong>Education</strong><br />
In 2006, about 80 percent of 2004 high school graduates<br />
had ever attended a postsecondary <strong>in</strong>stitution. Among<br />
the graduat<strong>in</strong>g class, 71 percent enrolled immediately<br />
after graduation from high school, <strong>and</strong> 9 percent delayed<br />
enrollment. The percentage of females with immediate<br />
postsecondary enrollment (74 percent) was higher than<br />
that of males (67 percent). This pattern held for White,<br />
Hispanic, <strong>and</strong> Asian students as well. A higher percentage<br />
Executive Summary<br />
Figure 5.<br />
(Figure 31-1) Percentage of 2004 high school seniors who had applied to college by 2006, by race/ethnicity<br />
<strong>and</strong> sex: 2006<br />
Percent<br />
100<br />
80<br />
79<br />
87<br />
81<br />
88<br />
77<br />
85<br />
73<br />
82<br />
89<br />
94<br />
67<br />
84<br />
83<br />
84<br />
60<br />
40<br />
20<br />
0<br />
Total 1 White Black Hispanic Asian American Indian/<br />
Alaska Native<br />
Race/ethnicity<br />
Two or<br />
more races<br />
Male<br />
Female<br />
1<br />
Total <strong>in</strong>cludes other racial/ethnic groups not shown separately <strong>in</strong> the figure.<br />
NOTE: Report<strong>in</strong>g st<strong>and</strong>ards for Native Hawaiians/Pacific Isl<strong>and</strong>ers were not met; therefore, data for this group are not shown <strong>in</strong> the figure. Race categories<br />
exclude persons of Hispanic ethnicity.<br />
SOURCE: U.S. Department of <strong>Education</strong>, National Center for <strong>Education</strong> Statistics, <strong>Education</strong> Longitud<strong>in</strong>al <strong>Study</strong> of 2002 (ELS:2002/2006), “Base-year (2002) to<br />
Second Follow-up (2006).”<br />
Executive Summary xi
of females (83 percent) than males (76 percent) had<br />
attended a postsecondary <strong>in</strong>stitution by 2006, a pattern<br />
that was also observed among White (85 vs. 78 percent,<br />
respectively), Hispanic (76 vs. 68 percent, respectively)<br />
<strong>and</strong> Asian (92 vs. 88 percent, respectively) high school<br />
graduates.<br />
Among 2004 high school graduates, a higher percentage<br />
of females first attended 4-year <strong>in</strong>stitutions than males<br />
(50 percent vs. 46 percent, respectively). This pattern by<br />
sex was also observed among White <strong>and</strong> Asian high school<br />
graduates. No measurable differences by sex were found<br />
among Black, Hispanic, or American Indian/Alaska<br />
Native graduates, nor among high school graduates of two<br />
or more races.<br />
F<strong>in</strong>ancial Aid<br />
In 2007–08, a higher percentage of female than<br />
male undergraduates received f<strong>in</strong>ancial aid (82 vs.<br />
77 percent). The same pattern was also observed for<br />
White, Hispanic, <strong>and</strong> Asian males <strong>and</strong> females. Also,<br />
<strong>in</strong> 2007–08, about 53 percent of full-time, full-year<br />
undergraduates received student loans to pay for their<br />
expenses; among students who received student loans,<br />
the average annual amount of total student loans was<br />
$8,000. A higher percentage of females than males<br />
received student loans (55 vs. 50 percent). The same<br />
pattern was also observed for White <strong>and</strong> Black males<br />
<strong>and</strong> females. However, among students who took out<br />
student loans, the average amount of student loans was<br />
similar for males <strong>and</strong> females overall <strong>and</strong> with<strong>in</strong> each<br />
racial/ethnic group.<br />
Enrollment Intensity<br />
Over the duration of a student’s enrollment, a student<br />
can enroll full time entirely, enroll part time entirely,<br />
or mix full-time <strong>and</strong> part-time enrollment (i.e., change<br />
enrollment status dur<strong>in</strong>g the enrollment duration).<br />
Dur<strong>in</strong>g the 2007–08 academic year, a higher percentage<br />
of males than females enrolled as full-time students<br />
(49 vs. 47 percent), but no measurable differences (overall<br />
or by race/ethnicity) were found between the percentages<br />
of male <strong>and</strong> female undergraduates who enrolled on a<br />
part-time basis. Lower percentages of Black (46 percent),<br />
Hispanic (45 percent), <strong>and</strong> Native Hawaiian/Pacific<br />
Isl<strong>and</strong>er (34 percent) undergraduate males enrolled<br />
as full-time students than Asian (50 percent), White<br />
(51 percent), <strong>and</strong> undergraduate males of two or more<br />
races (53 percent). In addition, the full-time percentage<br />
was higher for Hispanic <strong>and</strong> Black males than for Native<br />
Hawaiian/Pacific Isl<strong>and</strong>er males.<br />
<strong>Persistence</strong> <strong>and</strong> Atta<strong>in</strong>ment<br />
Approximately 49 percent of 2003–04 beg<strong>in</strong>n<strong>in</strong>g<br />
postsecondary students had atta<strong>in</strong>ed some type of<br />
postsecondary degree (i.e., certificate, associate’s degree,<br />
or bachelor’s degree) by June 2009. A lower percentage of<br />
male than female students had atta<strong>in</strong>ed a postsecondary<br />
degree dur<strong>in</strong>g that time (46 vs. 52 percent). Although this<br />
pattern was also observed for White males <strong>and</strong> females<br />
(51 vs. 57 percent) <strong>and</strong> Asian males <strong>and</strong> females (48 vs.<br />
68 percent), no measurable differences by sex were<br />
found for other racial/ethnic groups. Also, among<br />
2003–04 full-time beg<strong>in</strong>n<strong>in</strong>g postsecondary students<br />
who first attended a 4-year <strong>in</strong>stitution, a lower percentage<br />
Figure 6.<br />
(Figure 37-1) Percentage of 2003–04 full-time, beg<strong>in</strong>n<strong>in</strong>g postsecondary students who first attended a 4-year<br />
<strong>in</strong>stitution <strong>and</strong> atta<strong>in</strong>ed a bachelor’s degree by June 2009, by race/ethnicity <strong>and</strong> sex: 2009<br />
Percent<br />
100<br />
84<br />
80<br />
60<br />
64<br />
72<br />
69<br />
77<br />
48<br />
53<br />
46<br />
56<br />
66<br />
63<br />
68<br />
40<br />
20<br />
0<br />
Total 1 White Black Hispanic Asian Two or more races<br />
Race/ethnicity<br />
Male<br />
Female<br />
1<br />
Total <strong>in</strong>cludes other racial/ethnic groups not shown separately <strong>in</strong> the figure.<br />
NOTE: Estimates <strong>in</strong>clude students enrolled <strong>in</strong> Title IV eligible postsecondary <strong>in</strong>stitutions <strong>in</strong> the 50 states, the District of Columbia, <strong>and</strong> Puerto Rico. Report<strong>in</strong>g<br />
st<strong>and</strong>ards for Native Hawaiians/Pacific Isl<strong>and</strong>ers <strong>and</strong> American Indians/Alaska Natives were not met; therefore, data for these groups are not shown <strong>in</strong> the<br />
figure. Race categories exclude persons of Hispanic ethnicity.<br />
SOURCE: U.S. Department of <strong>Education</strong>, National Center for <strong>Education</strong> Statistics, 2003–04 Beg<strong>in</strong>n<strong>in</strong>g Postsecondary Students Longitud<strong>in</strong>al <strong>Study</strong>, Second Followup<br />
(BPS:04/06/09).<br />
xii <strong>Higher</strong> <strong>Education</strong>: <strong>Gaps</strong> <strong>in</strong> <strong>Access</strong> <strong>and</strong> <strong>Persistence</strong> <strong>Study</strong>
of males than females had atta<strong>in</strong>ed a bachelor’s degree<br />
by June 2009 (64 vs. 72 percent). Across racial/ethnic<br />
groups, the percentages of Black (51 percent) <strong>and</strong><br />
Hispanic (52 percent) full-time students at 4-year<br />
<strong>in</strong>stitutions who atta<strong>in</strong>ed bachelor’s degrees were lower<br />
than the percentages of students of two or more races (66<br />
percent), White students (73 percent), <strong>and</strong> Asian students<br />
(76 percent) who atta<strong>in</strong>ed a bachelor’s degree. The same<br />
patterns of atta<strong>in</strong>ment across race/ethnicity were observed<br />
among both males <strong>and</strong> females, with the exception of<br />
students of two or more races.<br />
The percentage of 2003–04 beg<strong>in</strong>n<strong>in</strong>g postsecondary<br />
male students who did not persist <strong>in</strong> their education<br />
(i.e., had no degree <strong>and</strong> were no longer enrolled <strong>in</strong> a<br />
postsecondary <strong>in</strong>stitution by June 2009) was higher than<br />
that of their female peers (37 vs. 35 percent). This pattern<br />
was also observed between White males <strong>and</strong> White<br />
females; however, no measurable difference were observed<br />
between males <strong>and</strong> females of any other racial/ethnic<br />
group.<br />
Reasons for Leav<strong>in</strong>g College Without<br />
Complet<strong>in</strong>g<br />
A higher percentage of male than female students<br />
who began at a postsecondary <strong>in</strong>stitution <strong>in</strong><br />
2003–04 left college by 2004 without complet<strong>in</strong>g a<br />
degree or certificate program (17 vs. 15 percent). The<br />
same pattern was observed between White males <strong>and</strong><br />
females (17 vs. 14 percent); however, no measurable<br />
differences were found between males <strong>and</strong> females<br />
with<strong>in</strong> other racial/ethnic groups. A lower percentage<br />
of White males than Black males left <strong>in</strong> 2004 without<br />
complet<strong>in</strong>g (17 vs. 22 percent); <strong>and</strong> the percentage of<br />
Asian males who left without complet<strong>in</strong>g (9 percent)<br />
was lower than the percentages of White males,<br />
Hispanic males (19 percent), males of two or more<br />
races (20 percent), <strong>and</strong> Black males. Among<br />
2003–04 beg<strong>in</strong>n<strong>in</strong>g postsecondary students who left<br />
<strong>in</strong> 2004 without complet<strong>in</strong>g a degree or certificate<br />
program, 31 percent reported that they left their<br />
<strong>in</strong>stitution due to f<strong>in</strong>ancial reasons, with a higher<br />
percentage of males than females report<strong>in</strong>g f<strong>in</strong>ancial<br />
reasons for leav<strong>in</strong>g (40 vs. 23 percent). The difference<br />
between males <strong>and</strong> females who left due to f<strong>in</strong>ancial<br />
reasons followed a similar pattern for White students,<br />
Hispanic students, <strong>and</strong> students of two or more races.<br />
Remedial Coursework <strong>and</strong> Other Academic<br />
Experiences<br />
In 2007–08, a lower percentage of male than female<br />
first-year undergraduates reported that they had taken a<br />
remedial course <strong>in</strong> college (33 vs. 39 percent). This pattern<br />
was observed for White, Hispanic, <strong>and</strong> American Indian/<br />
Alaska Native males <strong>and</strong> females, as well as males <strong>and</strong><br />
females of two or more races.<br />
Other academic experiences of students dur<strong>in</strong>g their<br />
first 2 or 3 years as undergraduates were also exam<strong>in</strong>ed.<br />
In 2006, higher percentages of males than females had<br />
received a grade of <strong>in</strong>complete (17 vs. 15 percent), had<br />
repeated a course for a higher grade (25 vs. 22 percent),<br />
or had withdrawn after the add/drop deadl<strong>in</strong>e (33 vs.<br />
29 percent). The percentage of males who had changed<br />
their major was not measurably different from the<br />
percentage of females who had done so.<br />
Academic <strong>and</strong> Social Integration<br />
Among 2003–04 beg<strong>in</strong>n<strong>in</strong>g postsecondary students<br />
who had recently graduated from high school, a lower<br />
percentage of male (72 percent) than female (77 percent)<br />
students reported that they sometimes or often met with<br />
an advisor dur<strong>in</strong>g their first year of college. Also, a lower<br />
percentage of male (33 percent) than female students<br />
(37 percent) participated <strong>in</strong> school clubs <strong>in</strong> their first year<br />
of college. For males, lower percentages of Hispanic<br />
(28 percent), Black (29 percent), <strong>and</strong> White students<br />
(34 percent) participated <strong>in</strong> clubs than did Asian students<br />
(43 percent). A higher percentage of male (35 percent)<br />
than female students (23 percent) participated <strong>in</strong> sports<br />
dur<strong>in</strong>g their first year of college. This pattern of sports<br />
<strong>in</strong>volvement by sex was also observed for Whites, Blacks,<br />
Hispanics, Asians, <strong>and</strong> students of two or more races.<br />
Among male students, lower percentages of beg<strong>in</strong>n<strong>in</strong>g<br />
Hispanics (23 percent) <strong>and</strong> Blacks (30 percent) than<br />
beg<strong>in</strong>n<strong>in</strong>g Whites (38 percent) participated <strong>in</strong> sports.<br />
College Student Employment<br />
In 2010, approximately 71 percent of undergraduates ages<br />
16 to 24 were employed. A lower percentage of male than<br />
female undergraduates were employed (70 vs. 73 percent);<br />
however, a higher percentage of males than females<br />
worked 35 or more hours per week (22 vs. 17 percent).<br />
With<strong>in</strong> racial/ethnic groups, the percentage of males who<br />
were employed was lower than that of females for Whites<br />
(76 vs. 79 percent), Blacks (57 vs. 62 percent), <strong>and</strong> Asians<br />
(49 vs. 52 percent). There were no measurable differences<br />
between the employment rates of males <strong>and</strong> females<br />
among Hispanics, Native Hawaiians/Pacific Isl<strong>and</strong>ers,<br />
American Indians, <strong>and</strong> students of two or more races.<br />
White males (76 percent), males of two or more races<br />
(72 percent), American Indian males (65 percent),<br />
Hispanic males (64 percent), Native Hawaiian/Pacific<br />
Isl<strong>and</strong>er males (62 percent), <strong>and</strong> Black males (57 percent)<br />
were employed at higher percentages than were Asian<br />
males (49 percent). In addition, Hispanic males were<br />
employed at a higher percentage than Black males.<br />
Graduation Rates <strong>and</strong> Degrees Conferred<br />
About 58 percent of all first-time students seek<strong>in</strong>g<br />
bachelor’s degrees who started at a 4-year college full time<br />
<strong>in</strong> 2004 completed a bachelor’s degree at that same college<br />
with<strong>in</strong> 6 years. A higher percentage of females than males<br />
completed bachelor’s degrees with<strong>in</strong> 6 years (61 vs. 56<br />
percent). This pattern held across all racial/ethnic groups,<br />
with the greatest difference between Black females <strong>and</strong><br />
males (a 9 percentage po<strong>in</strong>t difference) <strong>and</strong> the smallest<br />
difference between American Indian/Alaska Native<br />
females <strong>and</strong> males (a 3 percentage po<strong>in</strong>t difference).<br />
Executive Summary<br />
Executive Summary xiii
Among males, Asian/Pacific Isl<strong>and</strong>ers had the highest<br />
percentage complet<strong>in</strong>g bachelor’s degrees with<strong>in</strong> 6 years<br />
(66 percent), followed by White (59 percent), Hispanic<br />
(46 percent), American Indian/Alaska Native (37 percent),<br />
<strong>and</strong> Black males (34 percent).<br />
In 2010, postsecondary degree-grant<strong>in</strong>g <strong>in</strong>stitutions<br />
conferred a total of 3.4 million associate’s, bachelor’s,<br />
master’s, <strong>and</strong> doctor’s degrees. Of this total, 25 percent<br />
were associate’s degrees, 49 percent were bachelor’s<br />
degrees, 21 percent were master’s degrees, <strong>and</strong><br />
5 percent were doctor’s degrees. About 25 percent of all<br />
bachelor’s degrees conferred were <strong>in</strong> science, technology,<br />
eng<strong>in</strong>eer<strong>in</strong>g, or mathematics (STEM) fields of study. A<br />
higher percentage of males than females earned bachelor’s<br />
degrees <strong>in</strong> STEM fields (28 vs. 22 percent). This pattern<br />
was observed across all racial/ethnic groups, with the<br />
greatest difference observed between both Hispanic males<br />
<strong>and</strong> females <strong>and</strong> Asian/Pacific Isl<strong>and</strong>er males <strong>and</strong> females<br />
(a 7 percentage po<strong>in</strong>t difference each). The smallest<br />
difference was observed between Black males <strong>and</strong> females<br />
(a 2 percentage po<strong>in</strong>t difference). Among males, White<br />
<strong>and</strong> American Indian/Alaska Native students earned the<br />
same percentage of bachelor’s degrees <strong>in</strong> STEM fields<br />
(27 percent each). A higher percentage of Hispanic than<br />
Black male students earned bachelor’s degrees <strong>in</strong> STEM<br />
fields (24 vs. 22 percent).<br />
Postsecondary Outcomes <strong>and</strong><br />
Employment<br />
<strong>Education</strong>al Atta<strong>in</strong>ment<br />
Among the more than 41 million young adults ages<br />
25 to 34 <strong>in</strong> 2010, a higher percentage of males than<br />
females had not completed high school (15 vs. 11 percent).<br />
This pattern by sex was also observed among White,<br />
Black, <strong>and</strong> Hispanic young adults, <strong>and</strong> among young<br />
adults of two or more races. Also, the percentage of young<br />
adults whose highest level of educational atta<strong>in</strong>ment was<br />
high school completion was higher for males than females<br />
both overall (28 vs. 21 percent) <strong>and</strong> for most racial/<br />
ethnic groups (with the exception of Asians <strong>and</strong> Native<br />
Hawaiians/Pacific Isl<strong>and</strong>ers). In 2010, the percentage<br />
of young adults whose highest level of educational<br />
atta<strong>in</strong>ment was a bachelor’s or higher degree was lower<br />
for males than for females overall (27 vs. 35 percent) as<br />
well as for Whites (33 vs. 42 percent), Blacks (15 vs.<br />
23 percent), Hispanics (11 vs. 16 percent), <strong>and</strong> persons of<br />
two or more races (30 vs. 35 percent).<br />
Labor Force Participation<br />
Among young adults who had not completed high<br />
school, a higher percentage of males than females were<br />
employed (63 vs. 40 percent), a pattern that held for<br />
Whites <strong>and</strong> Hispanics with this level of educational<br />
Figure 7.<br />
(Figure 45-1) Median annual earn<strong>in</strong>gs of full-time, full-year wage <strong>and</strong> salary workers ages 25 to 34, by sex,<br />
race/ethnicity, <strong>and</strong> highest level of educational atta<strong>in</strong>ment: 2010<br />
Earn<strong>in</strong>gs<br />
Male<br />
Female<br />
$80,000<br />
70,000<br />
60,000<br />
50,000<br />
40,000<br />
30,000<br />
20,000<br />
F<br />
F<br />
H<br />
J<br />
F<br />
H<br />
J<br />
F<br />
H<br />
J<br />
F<br />
H<br />
J<br />
F<br />
10,000<br />
0<br />
Total 1 White Black Hispanic Asian Two or<br />
more<br />
races<br />
Total 1 White Black Hispanic Asian Two or<br />
more<br />
races<br />
High school completion<br />
Race/ethnicity<br />
Bachelor’s or higher degree with<br />
bachelor’s degree <strong>in</strong> a non-STEM field<br />
Bachelor’s or higher degree with<br />
bachelor’s degree <strong>in</strong> a STEM field<br />
1<br />
Total <strong>in</strong>cludes other racial/ethnic groups not shown separately <strong>in</strong> the figure.<br />
NOTE: Estimates are for the entire population <strong>in</strong> the <strong>in</strong>dicated age range, <strong>in</strong>clud<strong>in</strong>g persons <strong>in</strong> both households <strong>and</strong> group quarters. A household <strong>in</strong>cludes<br />
all the persons who occupy a hous<strong>in</strong>g unit. A group quarters is a nontypical household-type liv<strong>in</strong>g arrangement where people live or stay <strong>in</strong> a group liv<strong>in</strong>g<br />
arrangement that is owned or managed by an entity or organization provid<strong>in</strong>g hous<strong>in</strong>g <strong>and</strong>/or services for the residents. Group quarters <strong>in</strong>clude such<br />
places as college residence halls, residential treatment centers, skilled nurs<strong>in</strong>g facilities, group homes, military barracks, correctional facilities, <strong>and</strong> workers’<br />
dormitories. Employment status refers to the full calendar week prior to the week when the respondent answered the questions. Full-year worker refers to those<br />
who were employed 50 or more weeks dur<strong>in</strong>g the previous year; full-time worker refers to those who were usually employed 35 or more hours per week. High<br />
school completion <strong>in</strong>cludes a high school diploma or an equivalent credential, <strong>in</strong>clud<strong>in</strong>g a General <strong>Education</strong>al Development (GED) certificate. Detail may<br />
not sum to totals because of round<strong>in</strong>g. Report<strong>in</strong>g st<strong>and</strong>ards for at least some data for Native Hawaiian/Pacific Isl<strong>and</strong>er males <strong>and</strong> females, American Indian<br />
males <strong>and</strong> females, <strong>and</strong> Alaska Native males <strong>and</strong> females were not met; therefore, data for males <strong>and</strong> females <strong>in</strong> these racial groups are not shown <strong>in</strong> the<br />
figure. Race categories exclude persons of Hispanic ethnicity. Science, technology, eng<strong>in</strong>eer<strong>in</strong>g, <strong>and</strong> mathematics (STEM) fields, as def<strong>in</strong>ed here, <strong>in</strong>clude<br />
agriculture <strong>and</strong> natural resources, biology <strong>and</strong> biomedical sciences, computer <strong>and</strong> <strong>in</strong>formation sciences, eng<strong>in</strong>eer<strong>in</strong>g <strong>and</strong> eng<strong>in</strong>eer<strong>in</strong>g technologies, health<br />
professions <strong>and</strong> cl<strong>in</strong>ical sciences, mathematics <strong>and</strong> statistics, <strong>and</strong> physical sciences <strong>and</strong> science technologies.<br />
SOURCE: U.S. Department of Commerce, Census Bureau, American Community Survey (ACS), 2010.<br />
xiv <strong>Higher</strong> <strong>Education</strong>: <strong>Gaps</strong> <strong>in</strong> <strong>Access</strong> <strong>and</strong> <strong>Persistence</strong> <strong>Study</strong>
atta<strong>in</strong>ment. Among males who had not completed high<br />
school, a higher percentage of Hispanics (77 percent) were<br />
employed than White (55 percent) or Black males<br />
(28 percent). Also, a higher percentage of White males<br />
than Black males <strong>in</strong> this group were employed.<br />
Among young adults whose highest level of educational<br />
atta<strong>in</strong>ment was high school completion, 67 percent<br />
were employed <strong>in</strong> 2010 overall, with a higher rate of<br />
employment for males than for females (72 vs.<br />
60 percent). This difference by sex was also observed<br />
among Whites <strong>and</strong> Hispanics. Among males, a lower<br />
percentage of Blacks (52 percent) were employed,<br />
compared to Whites (74 percent), Hispanics (78 percent),<br />
<strong>and</strong> Asians (76 percent).<br />
For young adults whose highest level of atta<strong>in</strong>ment was<br />
at least a bachelor’s degree, 85 percent were employed <strong>in</strong><br />
2010 overall, with a higher employment rate for males<br />
than for females (89 vs. 82 percent). In addition, higher<br />
percentages of White, Hispanic, <strong>and</strong> Asian males than<br />
females with a bachelor’s or higher degree were employed.<br />
Median Earn<strong>in</strong>gs <strong>and</strong> Employment of Young<br />
Adults With STEM Degrees<br />
The 2010 median annual earn<strong>in</strong>gs of young adults ages 25<br />
to 34 who worked full time throughout a full year were<br />
$36,200. Median earn<strong>in</strong>gs for males whose highest level<br />
of educational atta<strong>in</strong>ment was high school completion<br />
exceeded those for females by about $5,100 ($30,200<br />
vs. $25,100). Median earn<strong>in</strong>gs were also higher for male<br />
than female high school completers among Whites,<br />
Blacks, Hispanics, Asians, <strong>and</strong> Native Hawaiians/Pacific<br />
Isl<strong>and</strong>ers. Median annual earn<strong>in</strong>gs for young adults with<br />
a bachelor’s or higher degree were $50,300 <strong>in</strong> 2010, <strong>and</strong><br />
male earn<strong>in</strong>gs for this group exceeded female earn<strong>in</strong>gs<br />
by about $9,100 ($54,400 vs. $45,300); this difference by<br />
sex was also observed among Whites, Blacks, Hispanics,<br />
Asians, <strong>and</strong> young adults of two or more races.<br />
Median earn<strong>in</strong>gs for young adults with a bachelor’s or<br />
higher degree <strong>in</strong> a STEM field (STEM graduates) were<br />
$58,200, about $7,900 higher than the overall average<br />
for young adults with a bachelor’s or higher degree <strong>in</strong> any<br />
field. Male earn<strong>in</strong>gs for STEM graduates exceeded those<br />
for females by about $8,200 ($60,400 vs. $52,200). This<br />
pattern by sex also held for Whites, Blacks, Hispanics,<br />
Asians, <strong>and</strong> young adults of two or more races. Among<br />
males, STEM earn<strong>in</strong>gs for Asians ($69,900) were higher<br />
than earn<strong>in</strong>gs for White males ($60,400), males of two<br />
or more races ($60,400), Hispanic males ($53,300), Black<br />
males ($51,800), <strong>and</strong> American Indian males ($43,800).<br />
Multivariate Analyses<br />
Immediate Postsecondary Enrollment<br />
After controll<strong>in</strong>g for race/ethnicity, socioeconomic status,<br />
<strong>and</strong> other background variables, among sophomores <strong>in</strong><br />
2002 who graduated from high school by August 2004<br />
(referred to as “on-time” high school graduates), females<br />
were more likely than males to immediately enroll <strong>in</strong><br />
postsecondary education. This pattern held for White<br />
<strong>and</strong> Hispanic on-time graduates but not for Blacks. In<br />
contrast, for Black females who graduated on-time from<br />
high school <strong>in</strong> August 2004, there was no measurable<br />
difference from their male counterparts <strong>in</strong> the likelihood<br />
of enroll<strong>in</strong>g <strong>in</strong> their first postsecondary <strong>in</strong>stitution by<br />
December 2004.<br />
Immediate enrollees had higher levels of socioeconomic<br />
status compared with students with no immediate<br />
postsecondary enrollment, a higher mean 9th-grade<br />
grade po<strong>in</strong>t average (GPA), <strong>and</strong> a higher mean 10th-grade<br />
mathematics achievement test score. In addition, higher<br />
percentages of immediate enrollees (than those who did<br />
not immediately enroll <strong>in</strong> postsecondary education)<br />
were from two-parent/guardian households, participated<br />
<strong>in</strong> sports, participated <strong>in</strong> two or more extracurricular<br />
activities, <strong>and</strong> often discussed coursework with their<br />
parents. Lower percentages of immediate enrollees (than<br />
those who did not immediately enroll <strong>in</strong> postsecondary<br />
education) were ever reta<strong>in</strong>ed <strong>in</strong> 10th grade or earlier,<br />
were absent from school seven or more times <strong>in</strong> the first<br />
semester, had cut or skipped classes seven or more times,<br />
were employed <strong>and</strong> work<strong>in</strong>g more than 30 hours a week,<br />
or had at least one close friend who dropped out of school.<br />
These overall f<strong>in</strong>d<strong>in</strong>gs varied by race/ethnicity <strong>and</strong> sex.<br />
Results <strong>in</strong>dicate that the odds of a male immediately<br />
enroll<strong>in</strong>g <strong>in</strong> postsecondary education were 35 percent<br />
lower than the odds for a female, after account<strong>in</strong>g for<br />
other student, family, <strong>and</strong> high school characteristics<br />
that were <strong>in</strong>cluded as <strong>in</strong>dependent variables <strong>in</strong> the model.<br />
In terms of race/ethnicity, the odds of an Asian student<br />
immediately enroll<strong>in</strong>g <strong>in</strong> postsecondary education after<br />
high school were 2.57 times the odds for a White student.<br />
While the unadjusted bivariate results <strong>in</strong>dicated that lower<br />
percentages of Black than White high school graduates<br />
immediately enrolled <strong>in</strong> postsecondary education,<br />
the logistic models <strong>in</strong>dicate that Black students had<br />
50 percent higher odds than White students of<br />
immediately enroll<strong>in</strong>g <strong>in</strong> postsecondary education, after<br />
account<strong>in</strong>g for other student, family, <strong>and</strong> school factors.<br />
Degree Atta<strong>in</strong>ment<br />
Among beg<strong>in</strong>n<strong>in</strong>g postsecondary students who<br />
were recent high school graduates <strong>in</strong> 2004, after<br />
controll<strong>in</strong>g for race/ethnicity, socioeconomic status,<br />
<strong>and</strong> other background variables, females were more<br />
likely than males to have completed an associate’s or<br />
bachelor’s degree program by 2009. This pattern was<br />
also observed for Whites <strong>and</strong> Blacks. However, for<br />
beg<strong>in</strong>n<strong>in</strong>g postsecondary Hispanic students who were<br />
recent high school graduates, there was no measurable<br />
difference between males <strong>and</strong> females <strong>in</strong> the likelihood of<br />
complet<strong>in</strong>g an associate’s or bachelor’s degree program by<br />
2009.<br />
<strong>Higher</strong> percentages of students who had atta<strong>in</strong>ed an<br />
associate’s or bachelor’s degree by 2009 than those<br />
Executive Summary<br />
Executive Summary xv
who had not atta<strong>in</strong>ed a degree had a parent who held<br />
a bachelor’s degree or higher, were from the highest<br />
<strong>in</strong>come quartile, had taken precalculus/calculus <strong>in</strong> high<br />
school, had earned college-level credits <strong>in</strong> high school,<br />
had taken the SAT or ACT college entrance exams, first<br />
attended a private nonprofit postsecondary <strong>in</strong>stitution,<br />
first attended a 4-year postsecondary <strong>in</strong>stitution, declared<br />
a major dur<strong>in</strong>g their first year of enrollment, sometimes<br />
or often met with a college advisor <strong>in</strong> 2004, sometimes<br />
or often participated <strong>in</strong> school clubs <strong>in</strong> 2004, sometimes<br />
or often participated <strong>in</strong> school sports <strong>in</strong> 2004, <strong>and</strong> were<br />
always enrolled full time through 2009. In addition,<br />
lower percentages of students who atta<strong>in</strong>ed an associate’s<br />
or bachelor’s degree by 2009 (compared to those with no<br />
degree atta<strong>in</strong>ment) took any remedial classes <strong>in</strong> 2004,<br />
worked more than 20 hours a week (<strong>in</strong>clud<strong>in</strong>g workstudy),<br />
experienced two or more stopout periods through<br />
2009, <strong>and</strong> transferred between <strong>in</strong>stitutions two or more<br />
times through 2009.<br />
These overall f<strong>in</strong>d<strong>in</strong>gs varied by race/ethnicity <strong>and</strong> sex.<br />
Results <strong>in</strong>dicate that the odds of atta<strong>in</strong><strong>in</strong>g either an<br />
associate’s or bachelor’s degree by 2009 for males were<br />
32 percent lower than the odds of degree atta<strong>in</strong>ment for<br />
females, after account<strong>in</strong>g for other student, family, high<br />
school, <strong>and</strong> postsecondary <strong>in</strong>stitutional characteristics<br />
that were <strong>in</strong>cluded as <strong>in</strong>dependent variables <strong>in</strong> the model.<br />
Compared with White students, Black students had<br />
43 percent lower odds <strong>and</strong> Hispanic students had<br />
25 percent lower odds of atta<strong>in</strong><strong>in</strong>g an associate’s or<br />
bachelor’s degree, after account<strong>in</strong>g for other factors.<br />
xvi <strong>Higher</strong> <strong>Education</strong>: <strong>Gaps</strong> <strong>in</strong> <strong>Access</strong> <strong>and</strong> <strong>Persistence</strong> <strong>Study</strong>
Contents<br />
Page<br />
Letter from the Commissioner of the National Center for <strong>Education</strong> Statistics.............................................................iii<br />
Executive Summary.......................................................................................................................................................v<br />
List of Figures.............................................................................................................................................................. xx<br />
List of Tables.............................................................................................................................................................. xxv<br />
Introduction...................................................................................................................................................................1<br />
Chapter 1—Demographic Context............................................................................................ 6<br />
1. Children Liv<strong>in</strong>g <strong>in</strong> Poverty.....................................................................................................................................8<br />
2. Parents’ <strong>Education</strong>al Atta<strong>in</strong>ment..........................................................................................................................12<br />
3. Parent Involvement <strong>in</strong> <strong>Education</strong>.......................................................................................................................... 16<br />
4. Language M<strong>in</strong>ority School-Age Children.............................................................................................................20<br />
5. Special Needs.......................................................................................................................................................24<br />
Chapter 2—Characteristics of Schools................................................................................... 28<br />
6. Segregation <strong>and</strong> Poverty <strong>in</strong> Schools.......................................................................................................................30<br />
7. Adequate Yearly Progress......................................................................................................................................36<br />
8. Types of Public Schools........................................................................................................................................38<br />
9. Advanced Coursework Offer<strong>in</strong>gs..........................................................................................................................44<br />
Contents<br />
10. High School Guidance Counsel<strong>in</strong>g......................................................................................................................50<br />
Chapter 3—Student Behaviors <strong>and</strong> Afterschool Activities..................................................... 54<br />
11. Retention, Suspension, <strong>and</strong> Expulsion..................................................................................................................56<br />
12. Safety at School....................................................................................................................................................62<br />
13. Alcohol <strong>and</strong> Other Drug Use................................................................................................................................66<br />
14. Homework...........................................................................................................................................................70<br />
15. Part-Time Work.................................................................................................................................................... 74<br />
16. School-Sponsored <strong>and</strong> Non-School-Sponsored Activities......................................................................................78<br />
Chapter 4—Academic Preparation <strong>and</strong> Achievement.......................................................... 82<br />
17. Read<strong>in</strong>g Achievement...........................................................................................................................................84<br />
18. Mathematics Achievement....................................................................................................................................90<br />
19. Science Achievement............................................................................................................................................96<br />
20. Eighth-Grade Algebra.........................................................................................................................................100<br />
21. N<strong>in</strong>th-Grade Mathematics..................................................................................................................................104<br />
Contents<br />
xvii
22. Mathematics <strong>and</strong> Science Coursetak<strong>in</strong>g <strong>in</strong> High School.....................................................................................108<br />
23. Advanced Placement Exams............................................................................................................................... 114<br />
24. College Entrance Exams..................................................................................................................................... 118<br />
25. Graduation Rates................................................................................................................................................124<br />
26. Status Dropout Rates..........................................................................................................................................128<br />
Chapter 5—College Knowledge............................................................................................ 132<br />
27. Postsecondary Plans............................................................................................................................................134<br />
28. Steps Toward Postsecondary Enrollment............................................................................................................ 140<br />
29. Informational Resources..................................................................................................................................... 146<br />
30. Postsecondary School Choice Factors................................................................................................................. 150<br />
31. F<strong>in</strong>ancial Aid Considerations.............................................................................................................................. 154<br />
32. Participation <strong>in</strong> College Preparatory <strong>and</strong> Awareness Programs............................................................................ 158<br />
Chapter 6—Postsecondary <strong>Education</strong>.................................................................................. 160<br />
33. Enrollment Rates for 18- to 24-Year-Olds........................................................................................................... 162<br />
34. Entry Into Postsecondary <strong>Education</strong>................................................................................................................... 170<br />
35. Price of Attendance <strong>and</strong> F<strong>in</strong>ancial Aid................................................................................................................ 176<br />
36. Enrollment Intensity........................................................................................................................................... 180<br />
37. <strong>Persistence</strong> <strong>and</strong> Atta<strong>in</strong>ment................................................................................................................................. 184<br />
38. Reasons for Leav<strong>in</strong>g............................................................................................................................................ 188<br />
39. Remedial Coursework <strong>and</strong> Other Academic Experiences.................................................................................... 192<br />
40. Academic <strong>and</strong> Social Integration........................................................................................................................ 196<br />
41. College Student Employment.............................................................................................................................202<br />
42. Graduation Rates <strong>and</strong> Degrees Conferred...........................................................................................................206<br />
Chapter 7—Postsecondary Outcomes <strong>and</strong> Employment..................................................... 212<br />
43. <strong>Education</strong>al Atta<strong>in</strong>ment..................................................................................................................................... 214<br />
44. Labor Force Participation................................................................................................................................... 218<br />
45. Median Annual Earn<strong>in</strong>gs...................................................................................................................................226<br />
46. Employment of Young Adults With STEM Degrees...........................................................................................232<br />
Chapter 8—Multivariate Analyses of Immediate Postsecondary Enrollment <strong>and</strong><br />
Degree Atta<strong>in</strong>ment................................................................................................................. 248<br />
xviii <strong>Higher</strong> <strong>Education</strong>: <strong>Gaps</strong> <strong>in</strong> <strong>Access</strong> <strong>and</strong> <strong>Persistence</strong> <strong>Study</strong>
References.............................................................................................................................. 272<br />
Appendix A: Technical Appendix—Logistic Regression Analysis <strong>and</strong><br />
Imputation Procedures........................................................................................................... 278<br />
Appendix B: Guide to Sources............................................................................................... 288<br />
Contents<br />
Contents<br />
xix
List of Figures<br />
Figure<br />
Executive Summary<br />
1. (5-1) Percentage of students receiv<strong>in</strong>g special education services <strong>in</strong> 9th grade, by race/ethnicity<br />
<strong>and</strong> sex: 2009...................................................................................................................................................vi<br />
2. (6-2) Percentage of students <strong>in</strong> low- <strong>and</strong> high-poverty public elementary <strong>and</strong> secondary schools,<br />
by race/ethnicity <strong>and</strong> sex: School year 2010–11...............................................................................................vii<br />
3. (11-1) Percentage of 9th-grade students who had ever been reta<strong>in</strong>ed <strong>in</strong> any of grades k<strong>in</strong>dergarten<br />
through 9, by race/ethnicity <strong>and</strong> sex: 2009 ...................................................................................................viii<br />
4. (25-1) Averaged freshman graduation rate (AFGR) <strong>in</strong> public schools, by race/ethnicity <strong>and</strong><br />
sex: 2008–09....................................................................................................................................................x<br />
5. (31-1) Percentage of 2004 high school seniors who had applied to college by 2006, by race/ethnicity<br />
<strong>and</strong> sex: 2006..................................................................................................................................................xi<br />
6. (37-1) Percentage of 2003–04 full-time, beg<strong>in</strong>n<strong>in</strong>g postsecondary students who first attended a 4-year<br />
<strong>in</strong>stitution <strong>and</strong> atta<strong>in</strong>ed a bachelor’s degree by June 2009, by race/ethnicity <strong>and</strong> sex: 2009.............................xii<br />
7. (45-1) Median annual earn<strong>in</strong>gs of full-time, full-year wage <strong>and</strong> salary workers ages 25 to 34, by sex,<br />
race/ethnicity, <strong>and</strong> highest level of educational atta<strong>in</strong>ment: 2010................................................................... xiv<br />
Page<br />
Introduction<br />
A. Percentage of students scor<strong>in</strong>g at or above the Proficient level on the grade 8 National Assessment<br />
of <strong>Education</strong>al Progress (NAEP) read<strong>in</strong>g <strong>and</strong> mathematics assessments, by different categorizations of<br />
race/ethnicity: 2011..........................................................................................................................................3<br />
Chapter 1—Demographic Context<br />
1-1. Percentage of children under age 18 liv<strong>in</strong>g <strong>in</strong> poverty, by race/ethnicity <strong>and</strong> sex: 2010......................................8<br />
1-2. Percentage of children under age 18 liv<strong>in</strong>g <strong>in</strong> poverty with a female parent <strong>and</strong> no spouse present,<br />
by race/ethnicity <strong>and</strong> sex: 2010.........................................................................................................................9<br />
2-1. Percentage of children ages 6–18 whose parents’ highest level of educational atta<strong>in</strong>ment was less than<br />
high school completion, by child’s race/ethnicity <strong>and</strong> sex: 2010......................................................................12<br />
2-2. Percentage of children ages 6–18 whose parents’ highest level of educational atta<strong>in</strong>ment was a bachelor’s<br />
degree or higher, by child’s race/ethnicity <strong>and</strong> sex: 2010.................................................................................13<br />
3-1. Percentage of students <strong>in</strong> grades K through 12 whose parents reported attend<strong>in</strong>g a regularly scheduled<br />
parent-teacher conference, attend<strong>in</strong>g a school or class event, <strong>and</strong> volunteer<strong>in</strong>g or serv<strong>in</strong>g on a school<br />
committee, by race/ethnicity <strong>and</strong> sex: 2007....................................................................................................16<br />
4-1. Percentage of children ages 5–17 who spoke a language other than English at home <strong>and</strong> who spoke<br />
English with difficulty, by race/ethnicity <strong>and</strong> sex: 2010...................................................................................21<br />
5-1. Percentage of students receiv<strong>in</strong>g special education services <strong>in</strong> 9th grade, by race/ethnicity <strong>and</strong> sex: 2009.......24<br />
5-2. Percentage of children ages 12–17 ever hav<strong>in</strong>g been diagnosed with a learn<strong>in</strong>g disability, by<br />
race/ethnicity <strong>and</strong> sex: 2008...........................................................................................................................25<br />
xx <strong>Higher</strong> <strong>Education</strong>: <strong>Gaps</strong> <strong>in</strong> <strong>Access</strong> <strong>and</strong> <strong>Persistence</strong> <strong>Study</strong>
Figure<br />
Chapter 2—Characteristics of Schools<br />
6-1. Percentage of White, Black, Hispanic, Asian, Pacific Isl<strong>and</strong>er, <strong>and</strong> American Indian/Alaska Native<br />
students <strong>in</strong> public elementary <strong>and</strong> secondary schools that enroll 50 percent or more students of their<br />
respective racial or ethnic group, by sex: School year 2010–11........................................................................30<br />
6-2. Percentage of students <strong>in</strong> low- <strong>and</strong> high-poverty public elementary <strong>and</strong> secondary schools, by<br />
race/ethnicity <strong>and</strong> sex: School year 2010–11...................................................................................................31<br />
7-1. Percentage of students attend<strong>in</strong>g public elementary <strong>and</strong> secondary schools, by status of adequate yearly<br />
progress (AYP), race/ethnicity, <strong>and</strong> sex: School year 2008–09........................................................................36<br />
8-1. Percentage of students <strong>in</strong> public alternative elementary <strong>and</strong> secondary schools end<strong>in</strong>g <strong>in</strong> grade 12,<br />
by race/ethnicity <strong>and</strong> sex: School year 2010–11...............................................................................................38<br />
8-2. Percentage of students <strong>in</strong> public charter <strong>and</strong> magnet elementary <strong>and</strong> secondary schools end<strong>in</strong>g <strong>in</strong> grade<br />
12, by race/ethnicity <strong>and</strong> sex: School year 2010–11.........................................................................................39<br />
9-1. Percentage distribution of high school graduates, by number of advanced placement (AP) or <strong>in</strong>ternational<br />
baccalaureate (IB) courses offered <strong>in</strong> school, race/ethnicity, <strong>and</strong> sex: 2009......................................................44<br />
9-2. Percentage of high school graduates <strong>in</strong> schools that offered two or more advanced placement (AP) or<br />
<strong>in</strong>ternational baccalaureate (IB) courses <strong>in</strong> mathematics, by race/ethnicity <strong>and</strong> sex: 2009...............................46<br />
9-3. Percentage of high school graduates <strong>in</strong> schools that offered two or more advanced placement (AP) or<br />
<strong>in</strong>ternational baccalaureate (IB) courses <strong>in</strong> science, by race/ethnicity <strong>and</strong> sex: 2009........................................46<br />
Page<br />
10-1. Percentage of 9th-graders whose school counselors reported that the primary goal of the school<br />
counsel<strong>in</strong>g program was help<strong>in</strong>g students plan <strong>and</strong> prepare for postsecondary education, by race/ethnicity<br />
<strong>and</strong> sex: 2009..................................................................................................................................................51<br />
10-2. Percentage of 9th-graders whose school counselors reported that the primary goal of the school counsel<strong>in</strong>g<br />
program was help<strong>in</strong>g students improve their achievement <strong>in</strong> high school, by race/ethnicity <strong>and</strong> sex: 2009......51<br />
Contents<br />
Chapter 3—Student Behaviors <strong>and</strong> Afterschool Activities<br />
11-1. Percentage of 9th-grade students who had ever been reta<strong>in</strong>ed <strong>in</strong> any of grades k<strong>in</strong>dergarten through 9,<br />
by race/ethnicity <strong>and</strong> sex: 2009 ......................................................................................................................56<br />
11-2. Percentage of 9th-grade students who had ever been suspended or expelled, by race/ethnicity<br />
<strong>and</strong> sex: 2009 .................................................................................................................................................57<br />
12-1. Percentage of students <strong>in</strong> grades 9 through 12 who reported that they were threatened or <strong>in</strong>jured<br />
with a weapon on school property dur<strong>in</strong>g the past 12 months, by race/ethnicity <strong>and</strong> sex: 2009......................62<br />
12-2. Percentage of students <strong>in</strong> grades 9 through 12 who reported that drugs were made available to them<br />
on school property dur<strong>in</strong>g the past 12 months, by race/ethnicity <strong>and</strong> sex: 2009..............................................63<br />
13-1. Percentage of students <strong>in</strong> grades 9 through 12 who reported use of alcohol on one or more of the past<br />
30 days, by race/ethnicity <strong>and</strong> sex: 2009.........................................................................................................66<br />
13-2. Percentage of students <strong>in</strong> grades 9 through 12 who reported use of marijuana on one or more of the<br />
past 30 days, by race/ethnicity <strong>and</strong> sex: 2009..................................................................................................67<br />
14-1. Average hours per week spent on homework for high school students (grades 9 through 12) who did<br />
homework outside of school, by race/ethnicity <strong>and</strong> sex: 2007..........................................................................70<br />
14-2. Among high school students (grades 9 through 12) who did homework outside of school, percentage<br />
whose parents checked that homework was completed, by race/ethnicity <strong>and</strong> sex: 2007.................................71<br />
List of Figures<br />
xxi
Figure<br />
Page<br />
15-1. Percentage of employed high school students ages 16 <strong>and</strong> older, by race/ethnicity <strong>and</strong> sex: 2010.....................74<br />
15-2. Percentage of employed high school students ages 16 <strong>and</strong> older who worked more than 20 hours<br />
per week, by race/ethnicity <strong>and</strong> sex: 2010........................................................................................................75<br />
16-1. Percentage of 9th-grade students participat<strong>in</strong>g <strong>in</strong> at least one math- or science-related school-sponsored<br />
activity, by race/ethnicity <strong>and</strong> sex: 2009 ........................................................................................................78<br />
16-2. Percentage of 9th-grade students participat<strong>in</strong>g <strong>in</strong> at least one non-school-sponsored activity, by<br />
race/ethnicity <strong>and</strong> sex: 2009...........................................................................................................................79<br />
Chapter 4—Academic Preparation <strong>and</strong> Achievement<br />
17-1. Percentage of students scor<strong>in</strong>g at or above the Proficient level of the National Assessment of <strong>Education</strong>al<br />
Progress (NAEP) read<strong>in</strong>g assessments, by grade, race/ethnicity, <strong>and</strong> sex: 2011................................................84<br />
18-1. Percentage of students scor<strong>in</strong>g at or above the Proficient level of the National Assessment of <strong>Education</strong>al<br />
Progress (NAEP) mathematics assessments, by grade, race/ethnicity, <strong>and</strong> sex: 2011........................................90<br />
19-1. Percentage of students scor<strong>in</strong>g at or above the Proficient level of the National Assessment of<br />
<strong>Education</strong>al Progress (NAEP) science assessment, by grade, race/ethnicity, <strong>and</strong> sex: 2009..............................97<br />
20-1. Percentage of spr<strong>in</strong>g 2000 first-graders who scored <strong>in</strong> the top half of the fifth-grade mathematics<br />
assessment, by race/ethnicity <strong>and</strong> sex: Spr<strong>in</strong>g 2004.......................................................................................100<br />
20-2. Percentage of spr<strong>in</strong>g 2000 first-graders who scored <strong>in</strong> the top half of the fifth-grade mathematics<br />
assessment <strong>and</strong> went on to enroll <strong>in</strong> algebra or an advanced course other than algebra <strong>in</strong> the eighth grade,<br />
by race/ethnicity <strong>and</strong> sex: Spr<strong>in</strong>g 2007.......................................................................................................... 101<br />
21-1. Among 9th-grade students who reported they were currently enrolled <strong>in</strong> a mathematics course,<br />
percentage enrolled <strong>in</strong> algebra I, by race/ethnicity <strong>and</strong> sex: 2009..................................................................104<br />
21-2. Among 9th-grade students who reported they were currently enrolled <strong>in</strong> a mathematics course,<br />
percentage enrolled <strong>in</strong> geometry, by race/ethnicity <strong>and</strong> sex: 2009.................................................................105<br />
22-1. Percentage of high school graduates who completed precalculus <strong>and</strong> biology, chemistry, <strong>and</strong> physics<br />
<strong>in</strong> high school, by race/ethnicity <strong>and</strong> sex: 2009.............................................................................................108<br />
22-2. Percentage of high school graduates who completed precalculus <strong>and</strong> biology, chemistry, <strong>and</strong> physics<br />
<strong>in</strong> high school, by sex: 2000, 2005, <strong>and</strong> 2009...............................................................................................109<br />
23-1. Percentage of test-tak<strong>in</strong>g students receiv<strong>in</strong>g a score of 3 or higher on any Advanced Placement (AP)<br />
exams, by race/ethnicity <strong>and</strong> sex: May 2010.................................................................................................. 114<br />
24-1. Percentage of ACT test-tak<strong>in</strong>g population meet<strong>in</strong>g all four college read<strong>in</strong>ess benchmark scores, by<br />
race/ethnicity <strong>and</strong> sex: 2011.......................................................................................................................... 118<br />
24-2. Average SAT scores for the 12th-grade SAT test-tak<strong>in</strong>g population, by subject, race/ethnicity,<br />
<strong>and</strong> sex: 2011................................................................................................................................................ 119<br />
25-1. Averaged freshman graduation rate (AFGR) <strong>in</strong> public schools, by race/ethnicity <strong>and</strong> sex: 2008–09..............125<br />
26-1. Status dropout rates of 16- through 24-year-olds <strong>in</strong> the civilian, non<strong>in</strong>stitutionalized population,<br />
by race/ethnicity <strong>and</strong> sex: October Supplement, 2010...................................................................................128<br />
Chapter 5—College Knowledge<br />
27-1. Percentage of 9th-graders expect<strong>in</strong>g to complete a bachelor’s or graduate/professional degree,<br />
by race/ethnicity <strong>and</strong> sex: 2009.....................................................................................................................134<br />
xxii <strong>Higher</strong> <strong>Education</strong>: <strong>Gaps</strong> <strong>in</strong> <strong>Access</strong> <strong>and</strong> <strong>Persistence</strong> <strong>Study</strong>
Figure<br />
Page<br />
27-2. Percentage of 9th-graders plann<strong>in</strong>g to enroll <strong>in</strong> a license/certificate, associate’s, or bachelor’s program<br />
dur<strong>in</strong>g their first year after high school, by race/ethnicity <strong>and</strong> sex: 2009.......................................................135<br />
28-1. Percentage of high school seniors who took or planned to take college entrance exam<strong>in</strong>ations,<br />
by race/ethnicity <strong>and</strong> sex: 2004.....................................................................................................................140<br />
28-2. Among high school seniors who took or planned to take the SAT or the ACT, the percentage<br />
who studied or planned to study from SAT/ACT preparation books, by race/ethnicity <strong>and</strong> sex: 2004.......... 141<br />
28-3. Among high school seniors who planned to cont<strong>in</strong>ue their education after high school, percentage<br />
who applied to at least one <strong>and</strong> to five or more postsecondary <strong>in</strong>stitutions while <strong>in</strong> high school, by<br />
race/ethnicity <strong>and</strong> sex: 2004.........................................................................................................................142<br />
29-1. Among high school seniors who planned to cont<strong>in</strong>ue their education after high school, percentage<br />
who used <strong>in</strong>formational resources on college entrance requirements, by selected types of <strong>in</strong>formational<br />
resources, race/ethnicity, <strong>and</strong> sex: 2004........................................................................................................146<br />
30-1. Percentage of high school seniors with postsecondary aspirations who reported low postsecondary<br />
school expenses <strong>and</strong> the availability of f<strong>in</strong>ancial aid as very important to their decisions, by race/<br />
ethnicity <strong>and</strong> sex: 2004................................................................................................................................. 150<br />
30-2. Percentage of high school seniors with postsecondary aspirations who reported postsecondary<br />
<strong>in</strong>stitution’s athletic program <strong>and</strong> active social life as very important, by race/ethnicity <strong>and</strong> sex: 2004.......... 151<br />
31-1. Percentage of 2004 high school seniors who had applied to college by 2006, by race/ethnicity<br />
<strong>and</strong> sex: 2006............................................................................................................................................... 154<br />
31-2. Among 2004 high school seniors who had applied to college by 2006, percentage who applied for<br />
f<strong>in</strong>ancial aid, by race/ethnicity <strong>and</strong> sex: 2006................................................................................................ 155<br />
32-1. Among high school seniors with postsecondary aspirations, the percentage who reported participat<strong>in</strong>g<br />
<strong>in</strong> college preparatory <strong>and</strong> awareness programs, by race/ethnicity <strong>and</strong> sex: 2004........................................... 158<br />
Chapter 6—Postsecondary <strong>Education</strong><br />
33-1. Percentage distribution of 18- to 24-year-olds <strong>in</strong> the household <strong>and</strong> group quarters population, by<br />
race/ethnicity, sex, <strong>and</strong> school enrollment status: 2010..................................................................................163<br />
Contents<br />
33-2. Percentage of 18- to 24-year-olds <strong>in</strong> the household <strong>and</strong> group quarters population enrolled <strong>in</strong> college<br />
or graduate school, by race/ethnicity <strong>and</strong> sex: 2010 ......................................................................................164<br />
34-1. Percentage of 2004 high school graduates who immediately enrolled <strong>in</strong> first postsecondary <strong>in</strong>stitution,<br />
by race/ethnicity <strong>and</strong> sex: 2006..................................................................................................................... 170<br />
34-2. Percentage of 2004 high school graduates who first attended a 4-year postsecondary <strong>in</strong>stitution,<br />
by race/ethnicity <strong>and</strong> sex: 2006..................................................................................................................... 171<br />
34-3. Percentage of 2004 high school graduates who first attended a moderately or highly selective<br />
postsecondary <strong>in</strong>stitution, by race/ethnicity <strong>and</strong> sex: 2006 .......................................................................... 171<br />
35-1. Average annual total price of attendance for undergraduates who attended full time, full year at one<br />
<strong>in</strong>stitution, by race/ethnicity <strong>and</strong> sex: Academic year 2007–08..................................................................... 176<br />
35-2. Percentage of undergraduates attend<strong>in</strong>g full time, full year at one <strong>in</strong>stitution who received f<strong>in</strong>ancial aid,<br />
by race/ethnicity <strong>and</strong> sex: Academic year 2007–08 ......................................................................................177<br />
36-1. Percentage of undergraduate students who always attended their undergraduate <strong>in</strong>stitutions full time,<br />
by race/ethnicity <strong>and</strong> sex: Academic year 2007–08 ......................................................................................180<br />
List of Figures<br />
xxiii
Figure<br />
Page<br />
36-2. Percentage of undergraduate students who always attended their undergraduate <strong>in</strong>stitutions part time,<br />
by race/ethnicity <strong>and</strong> sex: Academic year 2007–08....................................................................................... 181<br />
37-1. Percentage of 2003–04 full-time, beg<strong>in</strong>n<strong>in</strong>g postsecondary students who first attended a 4-year<br />
<strong>in</strong>stitution <strong>and</strong> atta<strong>in</strong>ed a bachelor’s degree by June 2009, by race/ethnicity <strong>and</strong> sex: 2009...........................184<br />
38-1. Percentage of 2003–04 beg<strong>in</strong>n<strong>in</strong>g postsecondary students who left school by 2004 without complet<strong>in</strong>g<br />
a program, by race/ethnicity <strong>and</strong> sex: 2004...................................................................................................188<br />
38-2. Percentage of 2003–04 beg<strong>in</strong>n<strong>in</strong>g postsecondary students who left school by 2004 without complet<strong>in</strong>g<br />
a program <strong>and</strong> reported f<strong>in</strong>ancial reasons for leav<strong>in</strong>g, by race/ethnicity <strong>and</strong> sex: 2004..................................189<br />
39-1. Percentage of first-year undergraduates who reported ever tak<strong>in</strong>g a remedial course, by race/ethnicity<br />
<strong>and</strong> sex: Academic year 2007–08..................................................................................................................192<br />
39-2. Percentage of 2003–04 beg<strong>in</strong>n<strong>in</strong>g postsecondary undergraduates who reported ever receiv<strong>in</strong>g an<br />
<strong>in</strong>complete <strong>and</strong> ever withdraw<strong>in</strong>g after the add/drop deadl<strong>in</strong>e, by race/ethnicity <strong>and</strong> sex: 2006.................... 193<br />
40-1. Percentage of recent high school graduates attend<strong>in</strong>g 2- or 4-year postsecondary <strong>in</strong>stitutions who<br />
reported meet<strong>in</strong>g with an advisor sometimes or often dur<strong>in</strong>g their first year, by race/ethnicity <strong>and</strong><br />
sex: 2003–04................................................................................................................................................196<br />
40-2. Percentage of recent high school graduates attend<strong>in</strong>g 2- or 4-year postsecondary <strong>in</strong>stitutions who<br />
reported participation <strong>in</strong> school clubs sometimes or often dur<strong>in</strong>g their first year, by race/ethnicity<br />
<strong>and</strong> sex: 2003–04.........................................................................................................................................197<br />
40-3. Percentage of recent high school graduates attend<strong>in</strong>g 2- or 4-year postsecondary <strong>in</strong>stitutions who<br />
reported participation <strong>in</strong> school sports sometimes or often dur<strong>in</strong>g their first year, by race/ethnicity<br />
<strong>and</strong> sex: 2003–04.........................................................................................................................................197<br />
41-1. Percentage of 16- to 24-year-old undergraduate college students who were employed, by race/ethnicity<br />
<strong>and</strong> sex: 2010................................................................................................................................................202<br />
42-1. Percentage of first-time postsecondary students who started as full-time degree-seek<strong>in</strong>g students at a<br />
4-year <strong>in</strong>stitution <strong>and</strong> graduated with a bachelor’s degree with<strong>in</strong> 6 years, by race/ethnicity <strong>and</strong> sex:<br />
Cohort entry year 2004................................................................................................................................206<br />
42-2. Percentage of degrees conferred by degree-grant<strong>in</strong>g <strong>in</strong>stitutions <strong>in</strong> science, technology, eng<strong>in</strong>eer<strong>in</strong>g,<br />
<strong>and</strong> mathematics (STEM) fields, by degree level, race/ethnicity, <strong>and</strong> sex: Academic year 2009–10...............207<br />
Chapter 7—Postsecondary Outcomes <strong>and</strong> Employment<br />
43-1. Percentage of young adults ages 25 to 34 whose highest level of educational atta<strong>in</strong>ment was high school<br />
completion, by race/ethnicity <strong>and</strong> sex: 2010.................................................................................................. 214<br />
43-2. Percentage of young adults ages 25 to 34 whose highest level of educational atta<strong>in</strong>ment was a bachelor’s<br />
or higher degree, by race/ethnicity <strong>and</strong> sex: 2010.......................................................................................... 215<br />
44-1. Employment of young adults ages 25 to 34 whose highest level of educational atta<strong>in</strong>ment was high<br />
school completion, by race/ethnicity <strong>and</strong> sex: 2010....................................................................................... 218<br />
44-2. Employment of young adults ages 25 to 34 whose highest level of educational atta<strong>in</strong>ment was a<br />
bachelor’s or higher degree, by race/ethnicity <strong>and</strong> sex: 2010.......................................................................... 219<br />
45-1. Median annual earn<strong>in</strong>gs of full-time, full-year wage <strong>and</strong> salary workers ages 25 to 34, by sex,<br />
race/ethnicity, <strong>and</strong> highest level of educational atta<strong>in</strong>ment: 2010..................................................................226<br />
46-1. Percentage of young adults ages 25 to 34 with a bachelor’s or higher degree who have a bachelor’s<br />
degree <strong>in</strong> a science, technology, eng<strong>in</strong>eer<strong>in</strong>g, or mathematics (STEM) field, are <strong>in</strong> the labor force,<br />
<strong>and</strong> are employed, by occupation type, race/ethnicity, <strong>and</strong> sex: 2010............................................................234<br />
xxiv <strong>Higher</strong> <strong>Education</strong>: <strong>Gaps</strong> <strong>in</strong> <strong>Access</strong> <strong>and</strong> <strong>Persistence</strong> <strong>Study</strong>
List of Tables<br />
Table<br />
Chapter 1—Demographic Context<br />
1-1. Percentage of children under age 18 liv<strong>in</strong>g <strong>in</strong> poverty, by liv<strong>in</strong>g arrangements, sex, race/ethnicity, <strong>and</strong><br />
nativity: 2005 <strong>and</strong> 2010..................................................................................................................................10<br />
2-1. Percentage distribution of children ages 6–18, by parents’ highest level of educational atta<strong>in</strong>ment <strong>and</strong><br />
child’s sex <strong>and</strong> race/ethnicity: 2010.................................................................................................................14<br />
3-1. Percentage of students <strong>in</strong> grades K through 12 whose parents reported participation <strong>in</strong> school-related<br />
activities, by sex <strong>and</strong> race/ethnicity: 2007.......................................................................................................18<br />
4-1. Number <strong>and</strong> percentage of children ages 5–17 who spoke a language other than English at home <strong>and</strong><br />
who spoke English with difficulty, by sex, race/ethnicity, <strong>and</strong> nativity: 2010...................................................22<br />
5-1. Percentage of students receiv<strong>in</strong>g special education services <strong>in</strong> 9th grade, by race/ethnicity <strong>and</strong> sex: 2009.......26<br />
5-2. Percentage of children ages 12–17 ever hav<strong>in</strong>g been diagnosed with a learn<strong>in</strong>g disability, by sex <strong>and</strong><br />
race/ethnicity: Selected years, 1999—2008.....................................................................................................27<br />
Page<br />
Chapter 2—Characteristics of Schools<br />
6-1. Percentage of public elementary <strong>and</strong> secondary school students enrolled <strong>in</strong> schools with 50 percent<br />
or more enrollment of specific racial/ethnic groups, by sex <strong>and</strong> race/ethnicity: 2010–11.................................32<br />
6-2. Number <strong>and</strong> percentage of public elementary <strong>and</strong> secondary school students <strong>and</strong> percentage distribution<br />
of students eligible for free or reduced-price lunch, by sex <strong>and</strong> race/ethnicity: School year 2010–11................34<br />
7-1. Number <strong>and</strong> percentage of students attend<strong>in</strong>g public elementary <strong>and</strong> secondary schools, by status of<br />
adequate yearly progress (AYP), sex, <strong>and</strong> race/ethnicity: School year 2008–09...............................................37<br />
8-1. Number <strong>and</strong> percentage distribution of students <strong>in</strong> public elementary <strong>and</strong> secondary schools, by school<br />
type, race/ethnicity, <strong>and</strong> sex: School year 2010–11..........................................................................................40<br />
Contents<br />
8-2. Number <strong>and</strong> percentage distribution of students <strong>in</strong> public elementary <strong>and</strong> secondary schools end<strong>in</strong>g<br />
<strong>in</strong> grade 12, by school type, race/ethnicity, <strong>and</strong> sex: School year 2010–11.......................................................42<br />
9-1. Percentage of high school graduates <strong>in</strong> schools offer<strong>in</strong>g advanced placement (AP) <strong>and</strong> <strong>in</strong>ternational<br />
baccalaureate (IB) courses, by subject, sex, <strong>and</strong> race/ethnicity: 2009...............................................................47<br />
9-2. Percentage distribution of high school graduates, by type <strong>and</strong> number of advanced placement (AP) or<br />
<strong>in</strong>ternational baccalaureate (IB) courses offered <strong>in</strong> school, average number of courses offered, sex, <strong>and</strong><br />
race/ethnicity: 2009........................................................................................................................................48<br />
10-1. Percentage of 9th-graders whose school counselors reported selected factors as the primary goal of the<br />
school counsel<strong>in</strong>g program, by sex <strong>and</strong> race/ethnicity: 2009...........................................................................52<br />
Chapter 3—Student Behaviors <strong>and</strong> Afterschool Activities<br />
11-1. Percentage of 9th-grade students who had ever been reta<strong>in</strong>ed <strong>in</strong> a grade, by grade level, sex, <strong>and</strong><br />
race/ethnicity: 2009........................................................................................................................................58<br />
11-2. Percentage of 9th-grade students who had ever experienced various discipl<strong>in</strong>e or attendance issues,<br />
by sex <strong>and</strong> race/ethnicity: 2009.......................................................................................................................60<br />
12-1. Percentage of students <strong>in</strong> grades 9 through 12 who reported that they were threatened or <strong>in</strong>jured with<br />
a weapon on school property, carried a weapon on school property, engaged <strong>in</strong> a physical fight on<br />
school property, or reported that drugs were made available to them on school property, by sex <strong>and</strong><br />
race/ethnicity: 2009........................................................................................................................................64<br />
List of Tables<br />
xxv
Table<br />
13-1. Percentage of students <strong>in</strong> grades 9 through 12 who reported use of alcohol <strong>and</strong> other drugs, by type<br />
of drug, sex, <strong>and</strong> race/ethnicity: 2009.............................................................................................................68<br />
14-1. Percentage of high school students (grades 9 through 12) who did homework outside of school, average<br />
hours per week spent on homework, frequency of do<strong>in</strong>g homework, <strong>and</strong> percentage of students whose<br />
parents checked that homework was done, by sex <strong>and</strong> race/ethnicity: 2007....................................................72<br />
15-1. Percentage of high school students ages 16 <strong>and</strong> older who were employed <strong>and</strong> the percentage distribution<br />
of hours worked per week, by sex <strong>and</strong> race/ethnicity: 2010.............................................................................76<br />
16-1. Percentage of 9th-grade students participat<strong>in</strong>g <strong>in</strong> math- <strong>and</strong> science-related school-sponsored activities,<br />
by sex <strong>and</strong> race/ethnicity: 2009.......................................................................................................................80<br />
16-2. Percentage of 9th-grade students participat<strong>in</strong>g <strong>in</strong> various non-school-sponsored activities, by sex <strong>and</strong><br />
race/ethnicity: 2009........................................................................................................................................81<br />
Page<br />
Chapter 4—Academic Preparation <strong>and</strong> Achievement<br />
17-1. Percentage distribution of students at National Assessment of <strong>Education</strong>al Progress (NAEP) read<strong>in</strong>g<br />
achievement levels, by grade, sex, <strong>and</strong> race/ethnicity: Various years, 2005–11.................................................86<br />
18-1. Percentage distribution of students at National Assessment of <strong>Education</strong>al Progress (NAEP) mathematics<br />
achievement levels, by grade, sex, <strong>and</strong> race/ethnicity: Various years, 2005–11.................................................92<br />
19-1. Percentage distribution of students at National Assessment of <strong>Education</strong>al Progress (NAEP) science<br />
achievement levels, by race/ethnicity, sex, grade, <strong>and</strong> achievement level: 2009................................................98<br />
20-1. Percentage of spr<strong>in</strong>g 2000 first-graders who scored <strong>in</strong> the top half of the fifth-grade ECLS-K mathematics<br />
assessment <strong>and</strong> of those who scored <strong>in</strong> the top half, the percentage enrolled <strong>in</strong> algebra or an advanced<br />
course other than algebra <strong>in</strong> the eighth grade, by sex <strong>and</strong> race/ethnicity: Spr<strong>in</strong>g 2004 <strong>and</strong> spr<strong>in</strong>g 2007 .......102<br />
21-1. Percentage of 9th-grade students who reported they were enrolled <strong>in</strong> various mathematics courses,<br />
by sex <strong>and</strong> race/ethnicity: 2009.....................................................................................................................106<br />
22-1. Percentage of high school graduates who completed selected mathematics <strong>and</strong> science courses <strong>in</strong><br />
high school, by sex <strong>and</strong> race/ethnicity: 2000, 2005, <strong>and</strong> 2009...................................................................... 111<br />
23-1. Percentage of test-tak<strong>in</strong>g students receiv<strong>in</strong>g a score of 3 or higher on the Advanced Placement (AP)<br />
exams, by subject, sex, <strong>and</strong> race/ethnicity: May 2010.................................................................................... 116<br />
24-1. Percentage of ACT test-tak<strong>in</strong>g population meet<strong>in</strong>g college read<strong>in</strong>ess benchmark scores, by subject,<br />
sex, <strong>and</strong> race/ethnicity: 2010 <strong>and</strong> 2011..........................................................................................................121<br />
24-2. Average SAT scores for students who took the SAT dur<strong>in</strong>g high school, by subject, sex, <strong>and</strong><br />
race/ethnicity: Selected years, 2008–11.........................................................................................................122<br />
25-1. Averaged freshman graduation rate (AFGR) <strong>in</strong> public schools, by race/ethnicity, sex, <strong>and</strong> state<br />
or jurisdiction: 2008–09...............................................................................................................................126<br />
26-1. Status dropout rates of 16- through 24-year-olds <strong>in</strong> the civilian, non<strong>in</strong>stitutionalized population,<br />
by race/ethnicity, year, <strong>and</strong> sex: October Supplement, 2008–10....................................................................130<br />
Chapter 5—College Knowledge<br />
27-1. Percentage distribution of 9th-graders expect<strong>in</strong>g to complete various educational levels, by sex <strong>and</strong><br />
race/ethnicity: 2009......................................................................................................................................136<br />
27-2. Percentage of 9th-graders plann<strong>in</strong>g different activities dur<strong>in</strong>g their first year after high school, by sex<br />
<strong>and</strong> race/ethnicity: 2009...............................................................................................................................138<br />
xxvi <strong>Higher</strong> <strong>Education</strong>: <strong>Gaps</strong> <strong>in</strong> <strong>Access</strong> <strong>and</strong> <strong>Persistence</strong> <strong>Study</strong>
Table<br />
28-1. Percentage of high school seniors who took or planned to take college preparatory <strong>and</strong>/or entrance<br />
exam<strong>in</strong>ations, by type of exam<strong>in</strong>ation, sex, <strong>and</strong> race/ethnicity: 2004............................................................143<br />
28-2. Among high school seniors who took or planned to take the SAT or the ACT, percentage who took<br />
or planned to take various steps to prepare for these tests, by type of preparation, sex, <strong>and</strong><br />
race/ethnicity: 2004......................................................................................................................................144<br />
28-3. Among high school seniors who planned to cont<strong>in</strong>ue their education after high school, percentage<br />
who applied to one or more postsecondary <strong>in</strong>stitutions while <strong>in</strong> high school, by sex <strong>and</strong><br />
race/ethnicity: 2004...................................................................................................................................... 145<br />
29-1. Percentage of high school seniors who planned to cont<strong>in</strong>ue their education after high school <strong>and</strong>,<br />
among seniors who planned to cont<strong>in</strong>ue, the percentage who used <strong>in</strong>formational resources on college<br />
entrance requirements, by type of <strong>in</strong>formational resource, sex, <strong>and</strong> race/ethnicity: 2004..............................148<br />
30-1. Percentage of high school seniors with postsecondary aspirations who reported select school choice<br />
factors as very important, by school choice factor, sex, <strong>and</strong> race/ethnicity: 2004........................................... 153<br />
31-1. Among 2004 high school seniors who had applied to college by 2006, percentage who applied for<br />
f<strong>in</strong>ancial aid, <strong>and</strong> among those who did not apply, percentage who reported various reasons for not<br />
do<strong>in</strong>g so, by sex <strong>and</strong> race/ethnicity: 2006...................................................................................................... 156<br />
32-1. Among high school seniors with postsecondary aspirations, the percentage who reported participat<strong>in</strong>g<br />
<strong>in</strong> college preparatory <strong>and</strong> awareness programs, by race/ethnicity <strong>and</strong> sex: 2004........................................... 159<br />
Page<br />
33-1. Number <strong>and</strong> percentage of 18- to 24-year-olds <strong>in</strong> the household <strong>and</strong> group quarters population, by<br />
school enrollment status, sex, race/ethnicity, <strong>and</strong> nativity: 2010....................................................................166<br />
33-2. Number <strong>and</strong> percentage of 18- to 24-year-olds <strong>in</strong> the household <strong>and</strong> group quarters population, by<br />
school enrollment status, sex, race/ethnicity, <strong>and</strong> nativity: 2006...................................................................168<br />
Chapter 6—Postsecondary <strong>Education</strong><br />
34-1. Percentage of academic year 2004 high school graduates, by the tim<strong>in</strong>g of first postsecondary<br />
enrollment, sex, <strong>and</strong> race/ethnicity: 2006..................................................................................................... 173<br />
Contents<br />
34-2. Percentage of academic year 2004 high school graduates, by the level of postsecondary <strong>in</strong>stitution first<br />
attended, sex, <strong>and</strong> race/ethnicity: 2006......................................................................................................... 174<br />
34-3. Percentage of academic year 2004 high school graduates, by the selectivity of the first postsecondary<br />
<strong>in</strong>stitution attended, sex, <strong>and</strong> race/ethnicity: 2006........................................................................................ 175<br />
35-1. Average annual tuition <strong>and</strong> fees, price of attendance, <strong>and</strong> f<strong>in</strong>ancial aid for undergraduates who<br />
attended full time, full year at one <strong>in</strong>stitution, by sex <strong>and</strong> race/ethnicity: Academic year 2007–08............... 179<br />
36-1. Percentage distribution of undergraduate postsecondary students, by enrollment <strong>in</strong>tensity, sex, <strong>and</strong><br />
race/ethnicity: Academic years 2003–04 <strong>and</strong> 2007–08.................................................................................182<br />
37-1. Percentage distribution of persistence <strong>and</strong> atta<strong>in</strong>ment by June 2009 of 2003–04 beg<strong>in</strong>n<strong>in</strong>g<br />
postsecondary students by highest degree atta<strong>in</strong>ed, sex, <strong>and</strong> race/ethnicity: 2009.........................................186<br />
37-2. Percentage of 2003–04 full-time, beg<strong>in</strong>n<strong>in</strong>g postsecondary students who first attended a 4-year<br />
<strong>in</strong>stitution <strong>and</strong> percentage distribution of their persistence <strong>and</strong> atta<strong>in</strong>ment status by June 2009,<br />
by sex <strong>and</strong> race/ethnicity: 2009.....................................................................................................................187<br />
38-1. Percentage of 2003–04 beg<strong>in</strong>n<strong>in</strong>g postsecondary students who left school by 2004 without complet<strong>in</strong>g<br />
a program <strong>and</strong> the reported reasons for leav<strong>in</strong>g, by sex <strong>and</strong> race/ethnicity: 2004..........................................190<br />
39-1. Percentage of first-year undergraduates who reported ever tak<strong>in</strong>g a remedial course, by level of<br />
<strong>in</strong>stitution, sex, <strong>and</strong> race/ethnicity: Academic years 2003–04 <strong>and</strong> 2007–08.................................................194<br />
List of Tables<br />
xxvii
Table<br />
Page<br />
39-2. Percentage of 2003–04 beg<strong>in</strong>n<strong>in</strong>g postsecondary undergraduates who reported various academic<br />
experiences, by sex <strong>and</strong> race/ethnicity: 2006................................................................................................. 195<br />
40-1. Percentage of beg<strong>in</strong>n<strong>in</strong>g postsecondary students attend<strong>in</strong>g 2- or 4-year <strong>in</strong>stitutions who reported<br />
participation <strong>in</strong> various academic activities sometimes or often dur<strong>in</strong>g their first year, by recent high<br />
school graduate status, activity, sex, <strong>and</strong> race/ethnicity: 2003–04.................................................................199<br />
40-2. Percentage of recent high school graduates attend<strong>in</strong>g 2- or 4-year postsecondary <strong>in</strong>stitutions who<br />
reported participation <strong>in</strong> various social activities sometimes or often dur<strong>in</strong>g their first year, by activity,<br />
sex, <strong>and</strong> race/ethnicity: 2003–04..................................................................................................................200<br />
41-1. Percentage of 16- to 24-year-old undergraduates who were employed, by hours worked per week, sex,<br />
<strong>and</strong> race/ethnicity: 2010...............................................................................................................................204<br />
42-1. Graduation rates of first-time postsecondary students who started as full-time degree-seek<strong>in</strong>g students,<br />
by time between start<strong>in</strong>g <strong>and</strong> graduat<strong>in</strong>g, sex, <strong>and</strong> race/ethnicity: Cohort years 2004 <strong>and</strong> 2007...................209<br />
42-2. Number <strong>and</strong> percentage distribution of degrees overall <strong>and</strong> number <strong>and</strong> percentage of science,<br />
technology, eng<strong>in</strong>eer<strong>in</strong>g, <strong>and</strong> mathematics (STEM) degrees conferred by postsecondary degree-grant<strong>in</strong>g<br />
<strong>in</strong>stitutions, by degree level, sex, <strong>and</strong> race/ethnicity: Academic year 2009–10............................................... 210<br />
Chapter 7—Postsecondary Outcomes <strong>and</strong> Employment<br />
43-1. Number <strong>and</strong> percentage of young adults ages 25 to 34, by highest level of educational atta<strong>in</strong>ment, sex,<br />
race/ethnicity, nativity, <strong>and</strong> citizenship status: 2010...................................................................................... 216<br />
44-1. Labor force status of young adults ages 25 to 34, by highest level of educational atta<strong>in</strong>ment, sex,<br />
race/ethnicity, nativity, <strong>and</strong> citizenship status: 2010......................................................................................222<br />
45-1. Median annual earn<strong>in</strong>gs of full-time, full-year wage <strong>and</strong> salary workers ages 25 to 34, by highest level<br />
of educational atta<strong>in</strong>ment, sex, race/ethnicity, nativity, <strong>and</strong> citizenship status: 2010.....................................228<br />
45-2. Median annual earn<strong>in</strong>gs of full-time, full-year wage <strong>and</strong> salary workers ages 25 to 34 with a<br />
bachelor’s or higher degree, by undergraduate field of study, sex, race/ethnicity, nativity, <strong>and</strong> citizenship<br />
status: 2010...................................................................................................................................................230<br />
46-1. Number, percentage, <strong>and</strong> percentage distribution of young adults ages 25 to 34 with a bachelor’s<br />
or higher degree, by undergraduate field of study, sex, race/ethnicity, nativity, <strong>and</strong> citizenship<br />
status: 2010...................................................................................................................................................236<br />
46-2. Percentage of young adults ages 25 to 34 with a bachelor’s or higher degree who were <strong>in</strong> the labor force<br />
<strong>and</strong> were employed <strong>in</strong> any occupation, by undergraduate field of study, sex, race/ethnicity, nativity, <strong>and</strong><br />
citizenship status: 2010.................................................................................................................................240<br />
46-3. Percentage distribution of young adults ages 25 to 34 with a bachelor’s or higher degree who have a<br />
bachelor’s degree <strong>in</strong> a science, technology, eng<strong>in</strong>eer<strong>in</strong>g, or mathematics (STEM) field, are <strong>in</strong> the labor<br />
force, <strong>and</strong> are employed, by occupation type, sex, race/ethnicity, nativity, <strong>and</strong> citizenship status: 2010.........244<br />
Chapter 8—Multivariate Analyses of Immediate Postsecondary Enrollment <strong>and</strong><br />
Degree Atta<strong>in</strong>ment<br />
ELS-1a. Percentage distribution of immediate postsecondary enrollment status of on-time high school graduates,<br />
by sex, race, <strong>and</strong> other selected characteristics: 2006.....................................................................................254<br />
ELS-1b. Mean socioeconomic status score, 10th-grade mathematics score, <strong>and</strong> 9th-grade GPA for on-time<br />
high school graduates, overall <strong>and</strong> by immediate postsecondary enrollment status: 2006.............................. 255<br />
ELS-2. Summary of logistic regression analyses for variables predict<strong>in</strong>g immediate enrollment <strong>in</strong> a postsecondary<br />
<strong>in</strong>stitution after complet<strong>in</strong>g high school, overall <strong>and</strong> by race/ethnicity <strong>and</strong> sex: 2006...................................256<br />
xxviii <strong>Higher</strong> <strong>Education</strong>: <strong>Gaps</strong> <strong>in</strong> <strong>Access</strong> <strong>and</strong> <strong>Persistence</strong> <strong>Study</strong>
Table<br />
ELS-3. Summary of logistic regression analyses for variables predict<strong>in</strong>g immediate enrollment <strong>in</strong> a postsecondary<br />
<strong>in</strong>stitution after complet<strong>in</strong>g high school, with<strong>in</strong> race/ethnicity by sex subgroups: 2006................................258<br />
BPS-1. Percentage distribution of 2003–04 beg<strong>in</strong>n<strong>in</strong>g postsecondary students who were recent high school<br />
graduates, by June 2009 degree atta<strong>in</strong>ment status <strong>and</strong> other selected characteristics.....................................266<br />
BPS-2. Summary of logistic regression analyses for variables predict<strong>in</strong>g that recent high school graduates who<br />
entered a postsecondary <strong>in</strong>stitution <strong>in</strong> academic year 2003–04 would have completed an associate’s or<br />
bachelor’s degree as of spr<strong>in</strong>g 2009, overall <strong>and</strong> by race/ethnicity <strong>and</strong> sex: 2004–09.....................................268<br />
BPS-3. Summary of logistic regression analyses for variables predict<strong>in</strong>g that recent high school graduates who<br />
entered a postsecondary <strong>in</strong>stitution <strong>in</strong> academic year 2003–04 would have completed an associate’s or<br />
bachelor’s degree as of spr<strong>in</strong>g 2009, overall <strong>and</strong> by race/ethnicity <strong>and</strong> sex: 2004–09.....................................270<br />
Page<br />
Contents<br />
List of Tables<br />
xxix
xxx <strong>Higher</strong> <strong>Education</strong>: <strong>Gaps</strong> <strong>in</strong> <strong>Access</strong> <strong>and</strong> <strong>Persistence</strong> <strong>Study</strong><br />
This page <strong>in</strong>tentionally left blank.
Introduction<br />
The National Center for <strong>Education</strong> Statistics (NCES) was<br />
directed by Congress to produce the <strong>Higher</strong> <strong>Education</strong>:<br />
<strong>Gaps</strong> <strong>in</strong> <strong>Access</strong> <strong>and</strong> <strong>Persistence</strong> <strong>Study</strong> (<strong>Higher</strong> Ed: GAPS), a<br />
statistical report that documents the scope <strong>and</strong> nature of<br />
gaps <strong>in</strong> educational participation <strong>and</strong> atta<strong>in</strong>ment between<br />
male Blacks, Hispanics, Native Hawaiians/Pacific<br />
Isl<strong>and</strong>ers, <strong>and</strong> American Indians/Alaska Natives <strong>and</strong> their<br />
female counterparts, as well as gaps between males <strong>in</strong><br />
these racial/ethnic groups <strong>and</strong> White males. The primary<br />
focus of the <strong>Higher</strong> Ed: GAPS report is to exam<strong>in</strong>e<br />
differences among males <strong>and</strong> females both overall <strong>and</strong><br />
with<strong>in</strong> racial/ethnic groups. The secondary focus of the<br />
report is to exam<strong>in</strong>e overall racial/ethnic differences.<br />
In addition to descriptive <strong>in</strong>dicators, this report also<br />
<strong>in</strong>cludes descriptive multivariate analyses of variables<br />
that are associated with male <strong>and</strong> female postsecondary<br />
attendance <strong>and</strong> atta<strong>in</strong>ment.<br />
The congressional language specified that the <strong>Higher</strong><br />
Ed: GAPS report track males of underrepresented racial/<br />
ethnic groups (i.e., Blacks, Hispanics, Native Hawaiians/<br />
Pacific Isl<strong>and</strong>ers, <strong>and</strong> American Indians/Alaska Natives)<br />
through the college atta<strong>in</strong>ment pipel<strong>in</strong>e, <strong>in</strong>clud<strong>in</strong>g<br />
college preparation, college access, college atta<strong>in</strong>ment,<br />
<strong>and</strong> graduation <strong>in</strong> fields where they are underrepresented<br />
<strong>in</strong> the labor force. Indicators appear<strong>in</strong>g <strong>in</strong> past NCES<br />
reports, such as The Condition of <strong>Education</strong> <strong>and</strong> Status<br />
<strong>and</strong> Trends <strong>in</strong> the <strong>Education</strong> of Racial/Ethnic Groups,<br />
have addressed these topics <strong>in</strong> a general way. However,<br />
the <strong>in</strong>tent of Congress <strong>in</strong>dicated that a comprehensive<br />
exam<strong>in</strong>ation of these specific topics was necessary to<br />
<strong>in</strong>form the development of prospective policies that will<br />
address these gaps. In order to select the most appropriate<br />
<strong>in</strong>dicators to support this goal, NCES convened an expert<br />
group of researchers, policy analysts, <strong>and</strong> relevant U.S.<br />
Department of <strong>Education</strong> staff to review <strong>and</strong> discuss<br />
potential <strong>in</strong>dicators, analysis methodologies, <strong>and</strong> data<br />
sources.<br />
Organization of the Report<br />
The <strong>Higher</strong> Ed: GAPS report presents <strong>in</strong>dicators<br />
that <strong>in</strong>clude the most recently available, nationally<br />
representative data from NCES, other federal agencies,<br />
<strong>and</strong> selected items from ACT <strong>and</strong> the College Board.<br />
These measures are exam<strong>in</strong>ed <strong>in</strong> seven chapters:<br />
Demographic Context, Characteristics of Schools,<br />
Student Behaviors <strong>and</strong> Afterschool Activities, Academic<br />
Preparation <strong>and</strong> Achievement, College Knowledge,<br />
Postsecondary <strong>Education</strong>, <strong>and</strong> Postsecondary Outcomes<br />
<strong>and</strong> Employment. Each <strong>in</strong>dicator consists of text<br />
describ<strong>in</strong>g key f<strong>in</strong>d<strong>in</strong>gs, technical notes, one or more<br />
figures, <strong>and</strong> one or more tables. The <strong>in</strong>dicator text<br />
generally describes overall differences by sex, differences<br />
by sex with<strong>in</strong> racial/ethnic groups, differences between<br />
m<strong>in</strong>ority males <strong>and</strong> White <strong>and</strong> Asian males, <strong>and</strong> overall<br />
racial/ethnic differences. Chapter 8 presents f<strong>in</strong>d<strong>in</strong>gs from<br />
multivariate analyses of relationships between student,<br />
family, <strong>and</strong> school/<strong>in</strong>tuitional characteristics <strong>and</strong> students’<br />
postsecondary enrollment <strong>and</strong> degree atta<strong>in</strong>ment.<br />
Appendix A is the technical appendix for the logistic<br />
regression analysis <strong>and</strong> imputation procedures, <strong>and</strong><br />
appendix B provides a guide to sources at the end of the<br />
report. St<strong>and</strong>ard error tables are available on the NCES<br />
website (http://nces.ed.gov/pubs2012/2012046/).<br />
Def<strong>in</strong>itions of Race <strong>and</strong> Ethnicity<br />
The Office of Management <strong>and</strong> Budget (OMB) is<br />
responsible for the st<strong>and</strong>ards that govern the categories<br />
used to collect <strong>and</strong> present federal data on race <strong>and</strong><br />
ethnicity. The OMB revised the guidel<strong>in</strong>es on racial/<br />
ethnic categories used by the federal government<br />
<strong>in</strong> October 1997, with a January 2003 deadl<strong>in</strong>e for<br />
implementation (Office of Management <strong>and</strong> Budget<br />
1997). The revised st<strong>and</strong>ards require a m<strong>in</strong>imum of<br />
these five categories for data on race: American Indian<br />
or Alaska Native, Asian, Black or African American,<br />
Native Hawaiian or Other Pacific Isl<strong>and</strong>er, <strong>and</strong> White.<br />
The st<strong>and</strong>ards also require the collection of data on the<br />
ethnicity categories Hispanic or Lat<strong>in</strong>o <strong>and</strong> Not Hispanic<br />
or Lat<strong>in</strong>o. It is important to note that Hispanic orig<strong>in</strong> is<br />
an ethnicity rather than a race, <strong>and</strong> therefore persons of<br />
Hispanic orig<strong>in</strong> may be of any race. Orig<strong>in</strong> can be viewed<br />
as the heritage, nationality group, l<strong>in</strong>eage, or country of<br />
birth of the person or the person’s parents or ancestors<br />
before their arrival <strong>in</strong> the United States. The race<br />
categories White, Black, Asian, Native Hawaiian or Other<br />
Pacific Isl<strong>and</strong>er, <strong>and</strong> American Indian or Alaska Native,<br />
as presented <strong>in</strong> this report, exclude persons of Hispanic<br />
orig<strong>in</strong> unless noted otherwise.<br />
The categories are def<strong>in</strong>ed as follows:<br />
American Indian or Alaska Native: A person hav<strong>in</strong>g<br />
orig<strong>in</strong>s <strong>in</strong> any of the orig<strong>in</strong>al peoples of North <strong>and</strong> South<br />
America (<strong>in</strong>clud<strong>in</strong>g Central America) <strong>and</strong> ma<strong>in</strong>ta<strong>in</strong><strong>in</strong>g<br />
tribal affiliation or community attachment.<br />
Asian: A person hav<strong>in</strong>g orig<strong>in</strong>s <strong>in</strong> any of the orig<strong>in</strong>al<br />
peoples of the Far East, Southeast Asia, or the Indian<br />
subcont<strong>in</strong>ent, <strong>in</strong>clud<strong>in</strong>g, for example, Cambodia,<br />
Ch<strong>in</strong>a, India, Japan, Korea, Malaysia, Pakistan, the<br />
Philipp<strong>in</strong>e Isl<strong>and</strong>s, Thail<strong>and</strong>, <strong>and</strong> Vietnam.<br />
Black or African American: A person hav<strong>in</strong>g orig<strong>in</strong>s <strong>in</strong><br />
any of the black racial groups of Africa.<br />
Native Hawaiian or Other Pacific Isl<strong>and</strong>er: A person<br />
hav<strong>in</strong>g orig<strong>in</strong>s <strong>in</strong> any of the orig<strong>in</strong>al peoples of Hawaii,<br />
Guam, Samoa, or other Pacific Isl<strong>and</strong>s.<br />
White: A person hav<strong>in</strong>g orig<strong>in</strong>s <strong>in</strong> any of the orig<strong>in</strong>al<br />
peoples of Europe, the Middle East, or North Africa.<br />
Hispanic or Lat<strong>in</strong>o: A person of Mexican, Puerto Rican,<br />
Cuban, South or Central American, or other Spanish<br />
culture or orig<strong>in</strong>, regardless of race.<br />
Introduction<br />
Introduction 1
With<strong>in</strong> this report, some of the category labels have<br />
been shortened <strong>in</strong> the <strong>in</strong>dicator text, tables, <strong>and</strong> figures.<br />
American Indian or Alaska Native is denoted as American<br />
Indian/Alaska Native (except when separate estimates are<br />
available for American Indians alone or Alaska Natives<br />
alone); Black or African American is shortened to Black;<br />
<strong>and</strong> Hispanic or Lat<strong>in</strong>o is shortened to Hispanic. When<br />
discussed separately, Native Hawaiian or Other Pacific<br />
Isl<strong>and</strong>er is shortened to Native Hawaiian/Pacific Isl<strong>and</strong>er.<br />
The <strong>in</strong>dicators <strong>in</strong> this report draw from a number<br />
of different sources. Many are federal surveys that<br />
collect data us<strong>in</strong>g the OMB st<strong>and</strong>ards for racial/ethnic<br />
classification described above; however, some sources<br />
have not fully adopted the st<strong>and</strong>ards, <strong>and</strong> some <strong>in</strong>dicators<br />
<strong>in</strong>clude data collected prior to the adoption of the OMB<br />
st<strong>and</strong>ards. This report focuses on the six categories that<br />
are the most common among the various data sources<br />
used: White, Black, Hispanic, Asian, Native Hawaiian/<br />
Pacific Isl<strong>and</strong>er, <strong>and</strong> American Indian/Alaska Native.<br />
Asians <strong>and</strong> Native Hawaiians/Pacific Isl<strong>and</strong>ers are<br />
comb<strong>in</strong>ed <strong>in</strong>to one category <strong>in</strong> <strong>in</strong>dicators for which the<br />
data were not collected separately for the two groups.<br />
Some of the surveys from which data are presented<br />
<strong>in</strong> this report give respondents the option of select<strong>in</strong>g<br />
either an “other” race category, a “two or more races”<br />
or “multiracial” category, or both. Where possible,<br />
<strong>in</strong>dicators present data on the “two or more races”<br />
category; however, <strong>in</strong> some cases this category may not<br />
be separately shown because the <strong>in</strong>formation was not<br />
collected or due to other data issues. The “other” category<br />
is not separately shown. Any comparisons made between<br />
persons of one racial/ethnic group to “all other racial/<br />
ethnic groups” <strong>in</strong>clude only the racial/ethnic groups<br />
shown <strong>in</strong> the <strong>in</strong>dicator. In some surveys, respondents are<br />
not given the option to select more than one race. In these<br />
surveys, respondents of two or more races must select<br />
a s<strong>in</strong>gle race category. Any comparisons between data<br />
from surveys that give the option to select more than one<br />
race <strong>and</strong> surveys that do not offer such an option should<br />
take <strong>in</strong>to account the fact that there is a potential for<br />
bias if members of one racial group are more likely than<br />
members of the others to identify themselves as “two or<br />
more races.” 1 For postsecondary data, foreign students are<br />
counted separately <strong>and</strong> are therefore not <strong>in</strong>cluded <strong>in</strong> any<br />
racial/ethnic category. Please see Appendix B: Guide to<br />
Sources at the end of this report for specific <strong>in</strong>formation<br />
on each of the report’s data sources.<br />
Limitations of the Data<br />
The relatively small sizes of the American Indian/Alaska<br />
Native <strong>and</strong> Native Hawaiian/Pacific Isl<strong>and</strong>er populations<br />
1<br />
Such bias was found by a National Center for Health Statistics study that exam<strong>in</strong>ed<br />
race/ethnicity responses to the 2000 Census. This study found, for example, that as<br />
the percentage of multiple-race respondents <strong>in</strong> a county <strong>in</strong>creased, the likelihood<br />
of respondents stat<strong>in</strong>g Black as their primary race <strong>in</strong>creased among Black/White<br />
respondents but decreased among American Indian or Alaska Native/Black<br />
respondents. See Parker, J. et al. (2004). Bridg<strong>in</strong>g Between Two St<strong>and</strong>ards for<br />
Collect<strong>in</strong>g Information on Race <strong>and</strong> Ethnicity: An Application to Census 2000 <strong>and</strong><br />
Vital Rates. Public Health Reports, 119(2): 192–205. Available through http://www.<br />
pubmedcentral.nih.gov/articlerender.fcgi?artid=1497618.<br />
pose many measurement difficulties when conduct<strong>in</strong>g<br />
statistical analysis. Even <strong>in</strong> larger surveys, the numbers of<br />
American Indians/Alaska Natives <strong>and</strong> Native Hawaiians/<br />
Pacific Isl<strong>and</strong>ers <strong>in</strong>cluded <strong>in</strong> a sample are often small.<br />
Researchers study<strong>in</strong>g data on these two populations<br />
often face small sample sizes that reduce the reliability of<br />
results. Survey data for American Indians/Alaska Natives<br />
often have somewhat higher st<strong>and</strong>ard errors than data for<br />
other racial/ethnic groups (Cahalan et al. 1998). Due to<br />
large st<strong>and</strong>ard errors, differences that seem substantial are<br />
often not statistically significant <strong>and</strong>, therefore, not cited<br />
<strong>in</strong> the text.<br />
Data on American Indians/Alaska Natives are often<br />
subject to <strong>in</strong>accuracies that can result from respondents<br />
self-identify<strong>in</strong>g their race/ethnicity. Research on the<br />
collection of race/ethnicity data suggests that the<br />
categorization of American Indian <strong>and</strong> Alaska Native is<br />
the least stable self-identification (U.S. Department of<br />
Labor, Bureau of Labor Statistics [BLS] 1995). The racial/<br />
ethnic categories presented to a respondent, <strong>and</strong> the way<br />
<strong>in</strong> which the question is asked, can <strong>in</strong>fluence the response,<br />
especially for <strong>in</strong>dividuals who consider themselves of<br />
mixed race or ethnicity. These data limitations should be<br />
kept <strong>in</strong> m<strong>in</strong>d when read<strong>in</strong>g this report.<br />
As mentioned above, Asians <strong>and</strong> Native Hawaiians/Pacific<br />
Isl<strong>and</strong>ers are comb<strong>in</strong>ed <strong>in</strong>to one category <strong>in</strong> <strong>in</strong>dicators<br />
for which the data were not collected separately for the<br />
two groups. The comb<strong>in</strong>ed category can sometimes<br />
mask significant differences between subgroups. For<br />
example, prior to 2011, the National Assessment of<br />
<strong>Education</strong>al Progress (NAEP) collected data that did<br />
not allow for separate report<strong>in</strong>g of estimates for Asians<br />
<strong>and</strong> Native Hawaiians/Pacific Isl<strong>and</strong>ers. Information<br />
from the Digest of <strong>Education</strong> Statistics, 2011 (table 21),<br />
based on the Census Bureau Current Population Reports,<br />
<strong>in</strong>dicates that 96 percent of all Asian/Pacific Isl<strong>and</strong>er<br />
5- to 24-year-olds are Asian. This comb<strong>in</strong>ed category for<br />
Asians/Pacific Isl<strong>and</strong>ers is more representative of Asians<br />
than Native Hawaiians/Pacific Isl<strong>and</strong>ers. For example,<br />
figure A shows the percentages of students scor<strong>in</strong>g at or<br />
above the Proficient level on the grade 8 NAEP read<strong>in</strong>g<br />
<strong>and</strong> mathematics assessments for Asian/Pacific Isl<strong>and</strong>er<br />
students as a comb<strong>in</strong>ed category, Asian students as a<br />
separate category, <strong>and</strong> Native Hawaiian/Pacific Isl<strong>and</strong>er<br />
students as a separate category. In 2011, approximately<br />
47 percent of 8th-grade students <strong>in</strong> the comb<strong>in</strong>ed Asian/<br />
Pacific Isl<strong>and</strong>er category scored at or above the Proficient<br />
level on the read<strong>in</strong>g assessment. When exam<strong>in</strong><strong>in</strong>g<br />
8th-grade read<strong>in</strong>g proficiency levels separately for Asians<br />
(49 percent) <strong>and</strong> Native Hawaiians/Pacific Isl<strong>and</strong>ers<br />
(24 percent), the difference between these two groups<br />
emerges. A similar pattern was found for the percentages<br />
of Asian/Pacific Isl<strong>and</strong>er (55 percent), Asian (58 percent),<br />
<strong>and</strong> Native Hawaiian/Pacific Isl<strong>and</strong>er (22 percent)<br />
8th-grade students scor<strong>in</strong>g at or above the Proficient level<br />
on the mathematics assessment.<br />
The <strong>in</strong>dicators presented <strong>in</strong> this report are <strong>in</strong>tended<br />
to provide a descriptive overview of the education<br />
2 <strong>Higher</strong> <strong>Education</strong>: <strong>Gaps</strong> <strong>in</strong> <strong>Access</strong> <strong>and</strong> <strong>Persistence</strong> <strong>Study</strong>
data available from many federal surveys. Readers are<br />
cautioned not to draw causal <strong>in</strong>ferences based on the<br />
univariate, bivariate, <strong>and</strong> multivariate results presented <strong>in</strong><br />
this report. One of the limitations of bivariate statistics<br />
is that they describe subpopulation differences without<br />
tak<strong>in</strong>g <strong>in</strong>to account the <strong>in</strong>fluence of other <strong>in</strong>dividual,<br />
family, school, or environmental factors. Many of the<br />
outcome variables exam<strong>in</strong>ed <strong>in</strong> this report may be related<br />
to other factors outside of students’ sex <strong>and</strong> race/ethnicity.<br />
Although multivariate analyses were conducted to explore<br />
some of those relationships, there may be other, more<br />
complex <strong>in</strong>teractions <strong>and</strong> relationships that have not<br />
been explored. The <strong>in</strong>dicators were selected to provide a<br />
range of data that are relevant to a variety of policy issues<br />
surround<strong>in</strong>g gaps <strong>in</strong> postsecondary access <strong>and</strong> persistence,<br />
rather than to emphasize any particular issue.<br />
Statistical Comparisons<br />
Data for <strong>in</strong>dicators <strong>in</strong> this report are obta<strong>in</strong>ed primarily<br />
from two types of surveys: universe surveys <strong>and</strong> sample<br />
surveys. In the case of universe data, <strong>in</strong>formation is<br />
collected from every member of the population. When<br />
data from an entire population are available, estimates<br />
of the total population or a subpopulation are made<br />
by simply summ<strong>in</strong>g the units <strong>in</strong> the population or<br />
subpopulation. As a result, there is no sampl<strong>in</strong>g error,<br />
<strong>and</strong> observed differences are reported as true. In the case<br />
of sample surveys, a nationally representative sample of<br />
respondents is selected <strong>and</strong> asked to participate <strong>in</strong> the<br />
data collection. When a sample survey is used, statistical<br />
uncerta<strong>in</strong>ty is <strong>in</strong>troduced, because the data come from<br />
only a portion of the entire population.<br />
Sample survey data <strong>in</strong>clude weights to make estimates<br />
from the data representative of the population of <strong>in</strong>terest.<br />
Indicators based on longitud<strong>in</strong>al survey data (i.e.,<br />
Beg<strong>in</strong>n<strong>in</strong>g Postsecondary Students Longitud<strong>in</strong>al <strong>Study</strong>,<br />
Early Childhood Longitud<strong>in</strong>al <strong>Study</strong>: K<strong>in</strong>dergarten Class<br />
of 1998–99, <strong>Education</strong> Longitud<strong>in</strong>al <strong>Study</strong> of 2002,<br />
<strong>and</strong> High School Longitud<strong>in</strong>al <strong>Study</strong> of 2009) <strong>in</strong>clude<br />
the specific weight variable name <strong>in</strong> the table <strong>and</strong> figure<br />
notes because the longitud<strong>in</strong>al datasets provide multiple<br />
weight<strong>in</strong>g variables that could be used for analysis<br />
purposes.<br />
Statistical uncerta<strong>in</strong>ty about whether the sample<br />
population represents the population at large must<br />
be considered when report<strong>in</strong>g estimates <strong>and</strong> mak<strong>in</strong>g<br />
comparisons. Us<strong>in</strong>g estimates calculated from data based<br />
on a sample of the population requires consideration of<br />
several factors before the estimates become mean<strong>in</strong>gful.<br />
When us<strong>in</strong>g data from a sample, some marg<strong>in</strong> of error<br />
will always be present <strong>in</strong> estimations of characteristics<br />
of the total population or subpopulation, because<br />
the data are available from only a portion of the total<br />
population. Consequently, data from samples can<br />
provide only an approximation of the true or actual<br />
value. The marg<strong>in</strong> of error of an estimate, or the range<br />
of potential true or actual values, depends on several<br />
factors such as the amount of variation <strong>in</strong> the responses,<br />
the size <strong>and</strong> representativeness of the sample, <strong>and</strong> the<br />
Figure A.<br />
Percentage of students scor<strong>in</strong>g at or above the Proficient level on the grade 8 National Assessment of<br />
<strong>Education</strong>al Progress (NAEP) read<strong>in</strong>g <strong>and</strong> mathematics assessments, by different categorizations of race/<br />
ethnicity: 2011<br />
Percent<br />
60<br />
50<br />
47 49<br />
55<br />
58<br />
40<br />
30<br />
20<br />
24<br />
22<br />
10<br />
0<br />
Read<strong>in</strong>g<br />
Race/ethnicity<br />
Mathematics<br />
Asian/Pacific Isl<strong>and</strong>er Asian Native Hawaiian/Pacific Isl<strong>and</strong>er<br />
NOTE: NAEP achievement levels def<strong>in</strong>e what students should know <strong>and</strong> be able to do. Basic denotes partial mastery of knowledge <strong>and</strong> skills that are<br />
fundamental for proficient work at a given grade. Proficient represents solid academic performance. Students reach<strong>in</strong>g this level have demonstrated<br />
competency over challeng<strong>in</strong>g subject matter. Advanced signifies superior performance. NAEP reports data on student race/ethnicity based on <strong>in</strong>formation<br />
obta<strong>in</strong>ed from school rosters. Race categories exclude persons of Hispanic ethnicity.<br />
SOURCE: U.S. Department of <strong>Education</strong>, National Center for <strong>Education</strong> Statistics, National Assessment of <strong>Education</strong>al Progress (NAEP), 2011 Read<strong>in</strong>g <strong>and</strong><br />
Mathematics Assessments, NAEP Data Explorer.<br />
Introduction<br />
Introduction 3
size of the subgroup for which the estimate is computed.<br />
The magnitude of this marg<strong>in</strong> of error is measured<br />
by what statisticians call the “st<strong>and</strong>ard error” of an<br />
estimate. When data from sample surveys are reported,<br />
the st<strong>and</strong>ard error is calculated for each estimate. The<br />
st<strong>and</strong>ard errors for all estimated totals, means, medians,<br />
<strong>and</strong> percentages reported <strong>in</strong> the <strong>Higher</strong> Ed: GAPS report<br />
tables can be viewed on the NCES website (http://nces.<br />
ed.gov/pubs2012/2012046/).<br />
All statements about differences <strong>in</strong> this report are<br />
supported by the data, either directly <strong>in</strong> the case of<br />
universe surveys or with statistical significance test<strong>in</strong>g<br />
<strong>in</strong> the case of sample survey data. When estimates are<br />
from a sample, caution is warranted when draw<strong>in</strong>g<br />
conclusions about one estimate <strong>in</strong> comparison to another.<br />
Although one estimate may appear to be larger than<br />
another, a statistical test may f<strong>in</strong>d that the apparent<br />
difference between them is not reliably measurable due<br />
to the uncerta<strong>in</strong>ty around the estimates. In this case,<br />
the estimates will be described as hav<strong>in</strong>g no measurable<br />
difference, mean<strong>in</strong>g that the difference between them is<br />
not statistically significant.<br />
Whether differences <strong>in</strong> means or percentages are<br />
statistically significant can be determ<strong>in</strong>ed us<strong>in</strong>g the<br />
st<strong>and</strong>ard errors of the estimates. In this publication<br />
<strong>and</strong> others produced by NCES, when differences are<br />
statistically significant, the probability that the difference<br />
occurred by chance is less than 5 percent.<br />
For all <strong>Higher</strong> Ed: GAPS report <strong>in</strong>dicators that <strong>in</strong>clude<br />
estimates based on samples, differences between estimates<br />
are stated only when they are statistically significant. To<br />
determ<strong>in</strong>e whether differences reported are statistically<br />
significant, two-tailed t tests at the .05 level are typically<br />
used. The t test formula for determ<strong>in</strong><strong>in</strong>g statistical<br />
significance is adjusted when the samples be<strong>in</strong>g compared<br />
are dependent. The t test formula is not adjusted for<br />
multiple comparisons. Due to the large sample sizes used<br />
for this report, many differences between estimates are<br />
statistically significant. Not all statistically significant<br />
results are reported <strong>in</strong> the text. This report focuses on<br />
report<strong>in</strong>g statistically significant differences between<br />
Black, Hispanic, American Indian/Alaska Native, <strong>and</strong><br />
Native Hawaiian/Pacific Isl<strong>and</strong>er males <strong>and</strong> their peers.<br />
The appearance of a “!” symbol (mean<strong>in</strong>g “Interpret data<br />
with caution”) <strong>in</strong> a table or figure <strong>in</strong>dicates a data cell<br />
with a high ratio of st<strong>and</strong>ard error to estimate (i.e., the<br />
coefficient of variation is greater than or equal to 0.30<br />
but less than 0.50); the reader should use caution when<br />
<strong>in</strong>terpret<strong>in</strong>g such data. These estimates are still discussed,<br />
however, when statistically significant differences are<br />
found despite large st<strong>and</strong>ard errors. The appearance of<br />
a “‡” symbol (mean<strong>in</strong>g “Report<strong>in</strong>g st<strong>and</strong>ards not met”)<br />
<strong>in</strong>dicates a data cell that is suppressed either due to a<br />
coefficient of variation that is greater than or equal to 0.50<br />
or too few respondents to meet report<strong>in</strong>g st<strong>and</strong>ards.<br />
All calculations <strong>in</strong> the <strong>Higher</strong> Ed: GAPS report are based<br />
on unrounded estimates. Therefore, the reader may<br />
f<strong>in</strong>d that a calculation cited <strong>in</strong> text or figures, such as a<br />
difference or a percentage change, may not be identical<br />
to the calculation obta<strong>in</strong>ed us<strong>in</strong>g the rounded values<br />
shown <strong>in</strong> the accompany<strong>in</strong>g tables. Although percentages<br />
reported <strong>in</strong> the tables are generally rounded to one<br />
decimal place (e.g., 76.5 percent), percentages reported<br />
<strong>in</strong> the text <strong>and</strong> figures are generally rounded from the<br />
orig<strong>in</strong>al number to whole numbers (with any value of<br />
0.50 or above rounded to the next highest whole number).<br />
While the data labels on the figures have been rounded<br />
to whole numbers, the graphical presentation of these<br />
data are based on the unrounded estimates shown <strong>in</strong><br />
the correspond<strong>in</strong>g table. Due to round<strong>in</strong>g, cumulative<br />
percentages may sometimes equal 99 or 101 percent,<br />
rather than 100 percent. In addition, sometimes a whole<br />
number <strong>in</strong> the text may seem rounded <strong>in</strong>correctly based<br />
on its value when rounded to one decimal place. For<br />
example, the percentage 14.479 rounds to 14.5 at one<br />
decimal place, but rounds to 14 when reported as a whole<br />
number.<br />
4 <strong>Higher</strong> <strong>Education</strong>: <strong>Gaps</strong> <strong>in</strong> <strong>Access</strong> <strong>and</strong> <strong>Persistence</strong> <strong>Study</strong>
This page <strong>in</strong>tentionally left blank.<br />
Introduction<br />
Introduction 5
Chapter 1<br />
Demographic Context<br />
1. Children Liv<strong>in</strong>g <strong>in</strong> Poverty..........................................................................................................8<br />
2. Parents’ <strong>Education</strong>al Atta<strong>in</strong>ment...........................................................................................12<br />
3. Parent Involvement <strong>in</strong> <strong>Education</strong>...........................................................................................16<br />
4. Language M<strong>in</strong>ority School-Age Children..............................................................................20<br />
5. Special Needs.........................................................................................................................24<br />
6 <strong>Higher</strong> <strong>Education</strong>: <strong>Gaps</strong> <strong>in</strong> <strong>Access</strong> <strong>and</strong> <strong>Persistence</strong> <strong>Study</strong>
Many studies have documented the associations between student background <strong>and</strong> educational outcomes (e.g., high<br />
school graduation rates <strong>and</strong> postsecondary enrollment, persistence, <strong>and</strong> atta<strong>in</strong>ment rates). Demographic factors known<br />
to be l<strong>in</strong>ked to these outcomes <strong>in</strong>clude socioeconomic status <strong>in</strong>dicators (e.g., poverty, family <strong>in</strong>come, <strong>and</strong> parents’<br />
education), parental <strong>in</strong>volvement, student disabilities, <strong>and</strong> native language. Chapter 1 exam<strong>in</strong>es some of these <strong>in</strong>dicators<br />
<strong>and</strong> analyzes group differences by sex <strong>and</strong> race/ethnicity.<br />
As a case <strong>in</strong> po<strong>in</strong>t, poverty poses a serious challenge to a child’s ability to succeed <strong>in</strong> school <strong>and</strong> its prevalence is<br />
markedly higher among certa<strong>in</strong> racial/ethnic groups than <strong>in</strong> others. Research has suggested that liv<strong>in</strong>g <strong>in</strong> poverty <strong>in</strong><br />
early childhood is associated with lower than average academic performance that extends through elementary <strong>and</strong><br />
high school <strong>and</strong> can lead to lower than average rates of school completion (Black, Hess, <strong>and</strong> Berenson-Howard 2000;<br />
Brooks-Gunn <strong>and</strong> Duncan 1997; Campbell et al. 2001; Entwisle, Alex<strong>and</strong>er, <strong>and</strong> Olson 2005; Lee <strong>and</strong> Burkman<br />
2002). Further, grow<strong>in</strong>g up <strong>in</strong> poverty is negatively correlated with children’s physical health, as well as their work<strong>in</strong>g<br />
memory, possibly due to the chronic psychological stress of liv<strong>in</strong>g <strong>in</strong> poverty (Evans <strong>and</strong> Schamberg 2009).<br />
Other factors—such as parental education levels—have also been l<strong>in</strong>ked to child outcomes such as educational<br />
experience, atta<strong>in</strong>ment, <strong>and</strong> academic achievement. For example, positive associations have been found between<br />
children with highly educated mothers <strong>and</strong> their rates of participation <strong>in</strong> early childhood education programs <strong>and</strong><br />
home literacy activities (Planty et al. 2009). In an earlier report that exam<strong>in</strong>ed the postsecondary experiences of firstgeneration<br />
college students (college students whose parents had never enrolled <strong>in</strong> postsecondary education), Nunez<br />
<strong>and</strong> Cuccaro-Alam<strong>in</strong> (1998) found that among beg<strong>in</strong>n<strong>in</strong>g postsecondary students <strong>in</strong> 1989–90, first-generation college<br />
students persisted <strong>in</strong> postsecondary education <strong>and</strong> atta<strong>in</strong>ed credentials at lower rates than their non-first-generation<br />
counterparts. This f<strong>in</strong>d<strong>in</strong>g held for students at 4-year <strong>in</strong>stitutions as well as public 2-year <strong>in</strong>stitutions. Even when<br />
controll<strong>in</strong>g for many of the characteristics that dist<strong>in</strong>guish first-generation college students from their peers, such as<br />
socioeconomic status, <strong>in</strong>stitution type, <strong>and</strong> attendance status, first-generation student status still had a negative effect<br />
on persistence <strong>and</strong> atta<strong>in</strong>ment.<br />
Extensive research exists on the importance of parental <strong>in</strong>volvement <strong>in</strong> children’s education (e.g., Jordan, Snow, <strong>and</strong><br />
Porche 2000; Starkey <strong>and</strong> Kle<strong>in</strong> 2000; Gutman <strong>and</strong> Midgley 2000; Shumow <strong>and</strong> Miller 2001). Children whose parents<br />
are <strong>in</strong>volved <strong>in</strong> their schools by do<strong>in</strong>g such th<strong>in</strong>gs as attend<strong>in</strong>g school events <strong>and</strong> back-to-school nights or volunteer<strong>in</strong>g<br />
are more likely to do well <strong>in</strong> school, to rema<strong>in</strong> <strong>in</strong> school, <strong>and</strong> to exhibit fewer behavioral problems than children whose<br />
parents are not <strong>in</strong>volved.<br />
Limited English proficiency cont<strong>in</strong>ues to be associated with educational outcomes for nonnative speakers of English<br />
<strong>in</strong> the United States. Studies have demonstrated that even with additional educational support, students who have<br />
difficulty speak<strong>in</strong>g English often have persistently lower academic achievement (e.g., on achievement tests <strong>in</strong> read<strong>in</strong>g<br />
<strong>and</strong> mathematics) <strong>and</strong> educational atta<strong>in</strong>ment than native English speakers (Brady, Ow<strong>in</strong>gs, <strong>and</strong> Qu<strong>in</strong>n 1992; Kle<strong>in</strong><br />
et al. 2004). In addition, language difficulties may contribute to the significantly higher dropout rates observed among<br />
foreign-born students <strong>in</strong> general <strong>and</strong> Hispanic students <strong>in</strong> particular than observed among native English speakers. For<br />
example, compared with their counterparts who spoke only English at home, a lower percentage of non-native English<br />
speakers 18 to 24 years old completed high school (10 percent vs. 31 percent; Kle<strong>in</strong> et al. 2004).<br />
Other students who face educational challenges are those with specific learn<strong>in</strong>g or other disabilities. At the elementary<br />
<strong>and</strong> secondary levels, students with disabilities may struggle more to meet academic st<strong>and</strong>ards, have lower performance<br />
on st<strong>and</strong>ardized tests, <strong>and</strong> graduate high school with a regular diploma at lower rates than their counterparts without<br />
disabilities. Further, obstacles for these students may cont<strong>in</strong>ue <strong>in</strong>to adulthood. For example, a survey of beg<strong>in</strong>n<strong>in</strong>g<br />
postsecondary students <strong>in</strong> 1989–90 <strong>in</strong>dicated that students who reported any disabilities had lower rates of persistence<br />
<strong>and</strong> degree atta<strong>in</strong>ment than those without disabilities (Horn <strong>and</strong> Berktold 1999). In the study, a higher percentage of<br />
students with disabilities than without disabilities delayed their postsecondary enrollment a year or more after f<strong>in</strong>ish<strong>in</strong>g<br />
high school (43 vs. 32 percent) or completed high school through earn<strong>in</strong>g a GED (i.e., pass<strong>in</strong>g the General <strong>Education</strong>al<br />
Development exam) or other alternative high school credential (12 vs. 6 percent). Those with disabilities stayed enrolled<br />
or earned a postsecondary degree or credential with<strong>in</strong> 5 years at lower rates than their counterparts without disabilities.<br />
The first two chapters <strong>in</strong> this report present demographic <strong>in</strong>formation on students, their families, <strong>and</strong> the schools they<br />
attend by sex <strong>and</strong> race/ethnicity that provides context for the education <strong>in</strong>dicators presented <strong>in</strong> later chapters. In order<br />
to describe the status of males <strong>and</strong> females <strong>and</strong> racial/ethnic groups <strong>in</strong> this country’s education system, it is important<br />
to provide contextual <strong>in</strong>formation on the relative size of each group, where the members of each group come from, <strong>and</strong><br />
where <strong>and</strong> how they live. On some <strong>in</strong>dicators, males <strong>and</strong> females are similar, while races/ethnicities are different. On<br />
other <strong>in</strong>dicators—such as the percentage of students with specific learn<strong>in</strong>g disabilities—differences are found between<br />
males <strong>and</strong> females overall, as well as with<strong>in</strong> racial/ethnic groups.<br />
Demographic Context 7
Indicator 1<br />
Children Liv<strong>in</strong>g <strong>in</strong> Poverty<br />
In 2010, the poverty rate for children liv<strong>in</strong>g with a s<strong>in</strong>gle mother was higher for<br />
American Indian children (53 percent) than for children of two or more races<br />
(41 percent), White children (35 percent), Native Hawaiian/Pacific Isl<strong>and</strong>er children<br />
(33 percent), <strong>and</strong> Asian children (29 percent). There were no differences <strong>in</strong> male<br />
versus female poverty rates for children liv<strong>in</strong>g with a s<strong>in</strong>gle mother.<br />
In 2010, some 21 percent of children under age 18 were<br />
liv<strong>in</strong>g <strong>in</strong> poverty. The percentage of children liv<strong>in</strong>g <strong>in</strong><br />
poverty ranged from 7 percent to 54 percent, depend<strong>in</strong>g<br />
on race/ethnicity, liv<strong>in</strong>g arrangement, <strong>and</strong> nativity.<br />
The percentage of children who were liv<strong>in</strong>g <strong>in</strong> poverty <strong>in</strong><br />
2010 was higher for Black children (38 percent) than for<br />
Hispanic children (32 percent), Alaska Native children<br />
(25 percent), children of two or more races (21 percent),<br />
Native Hawaiian/Pacific Isl<strong>and</strong>er children (22 percent),<br />
White children (13 percent), <strong>and</strong> Asian children (12<br />
percent). No differences were found between Black<br />
children liv<strong>in</strong>g <strong>in</strong> poverty <strong>and</strong> their American Indian<br />
peers (36 percent); however, the percentage of American<br />
Indian children liv<strong>in</strong>g <strong>in</strong> poverty was higher than those of<br />
all other racial/ethnic groups. The percentages of children<br />
liv<strong>in</strong>g <strong>in</strong> poverty were higher for Hispanic, Alaska Native,<br />
<strong>and</strong> Native Hawaiian/Pacific Isl<strong>and</strong>er children <strong>and</strong><br />
children of two or more races than for Asian <strong>and</strong> White<br />
children. No measurable differences between male <strong>and</strong><br />
female child poverty rates were found overall or with<strong>in</strong><br />
racial/ethnic groups <strong>in</strong> 2010.<br />
In 2010, the poverty rate for children liv<strong>in</strong>g with a s<strong>in</strong>gle<br />
mother was 44 percent. Differences were found across<br />
racial/ethnic groups. The poverty rate for children liv<strong>in</strong>g<br />
with a s<strong>in</strong>gle mother was higher for American Indian<br />
children (53 percent) than for children of two or more<br />
races (41 percent), White children (35 percent), Native<br />
Hawaiian/Pacific Isl<strong>and</strong>er children (33 percent), <strong>and</strong><br />
Asian children (29 percent). No differences were found<br />
between American Indian children <strong>and</strong> Black children<br />
(51 percent) or American Indian <strong>and</strong> Hispanic children<br />
(50 percent) overall. The poverty rate for children liv<strong>in</strong>g<br />
with a s<strong>in</strong>gle mother was higher for Black <strong>and</strong> Hispanic<br />
children than for children of two or more races, Alaska<br />
Native children, White children, Native Hawaiian/Pacific<br />
Isl<strong>and</strong>er children, <strong>and</strong> Asian children. Children of two or<br />
more races <strong>and</strong> White children also had higher poverty<br />
rates than Asian children. No measurable differences<br />
between males <strong>and</strong> females were found overall or with<strong>in</strong><br />
racial/ethnic groups <strong>in</strong> the poverty rate for children liv<strong>in</strong>g<br />
with a s<strong>in</strong>gle mother.<br />
Figure 1-1. Percentage of children under age 18 liv<strong>in</strong>g <strong>in</strong> poverty, by race/ethnicity <strong>and</strong> sex: 2010<br />
Percent<br />
100<br />
80<br />
60<br />
40<br />
20<br />
21 21<br />
13 13<br />
38 38<br />
32 32<br />
12 12<br />
21 23<br />
37 34<br />
26 24<br />
21 21<br />
0<br />
Total¹ White Black Hispanic Asian Native<br />
Hawaiian/<br />
Pacific<br />
Isl<strong>and</strong>er<br />
American<br />
Indian<br />
Alaska<br />
Native<br />
Two or<br />
more races<br />
Race/ethnicity<br />
Male<br />
Female<br />
¹ Total <strong>in</strong>cludes other racial/ethnic groups not shown separately <strong>in</strong> the figure.<br />
NOTE: To determ<strong>in</strong>e liv<strong>in</strong>g arrangements, children are classified either by their parent’s marital status or, if no parents are present <strong>in</strong> the household, by the<br />
marital status of the related householder. Poverty <strong>in</strong>formation was available only for children who were related to the householder. Therefore, this figure<br />
excludes any children who were not related to the householder or who are recorded as the householder or spouse of the householder. To def<strong>in</strong>e poverty, the<br />
U.S. Census Bureau uses a set of money <strong>in</strong>come thresholds that vary by family size <strong>and</strong> composition. A family, along with each <strong>in</strong>dividual <strong>in</strong> it, is considered<br />
poor if the family’s total <strong>in</strong>come is less than that family’s threshold. The poverty thresholds do not vary geographically <strong>and</strong> are adjusted annually for <strong>in</strong>flation<br />
us<strong>in</strong>g the Consumer Price Index. The official poverty def<strong>in</strong>ition counts money <strong>in</strong>come before taxes <strong>and</strong> does not <strong>in</strong>clude capital ga<strong>in</strong>s <strong>and</strong> noncash benefits<br />
(such as public hous<strong>in</strong>g, Medicaid, <strong>and</strong> food stamps). Race categories exclude persons of Hispanic ethnicity.<br />
SOURCE: U.S. Department of Commerce, Census Bureau, American Community Survey, 2010.<br />
8 <strong>Higher</strong> <strong>Education</strong>: <strong>Gaps</strong> <strong>in</strong> <strong>Access</strong> <strong>and</strong> <strong>Persistence</strong> <strong>Study</strong>
Figure 1-2.<br />
Percent<br />
100<br />
Percentage of children under age 18 liv<strong>in</strong>g <strong>in</strong> poverty with a female parent <strong>and</strong> no spouse present, by<br />
race/ethnicity <strong>and</strong> sex: 2010<br />
1<br />
80<br />
60<br />
40<br />
20<br />
0<br />
44 44<br />
35 35<br />
52 51 50 50<br />
Race/ethnicity<br />
Male<br />
29 29 29<br />
Total¹ White Black Hispanic Asian Native<br />
Hawaiian/<br />
Pacific<br />
Isl<strong>and</strong>er<br />
Female<br />
39<br />
53 53<br />
American<br />
Indian<br />
36 36<br />
Alaska<br />
Native<br />
42<br />
40<br />
Two or<br />
more races<br />
Demographics<br />
1<br />
¹ Total <strong>in</strong>cludes other racial/ethnic groups not shown separately <strong>in</strong> the figure.<br />
NOTE: To determ<strong>in</strong>e liv<strong>in</strong>g arrangements, children are classified either by their parent’s marital status or, if no parents are present <strong>in</strong> the household, by the<br />
marital status of the related householder. Poverty <strong>in</strong>formation was available only for children who were related to the householder. Therefore, this figure<br />
excludes any children who were not related to the householder or who are recorded as the householder or spouse of the householder. To def<strong>in</strong>e poverty, the<br />
U.S. Census Bureau uses a set of money <strong>in</strong>come thresholds that vary by family size <strong>and</strong> composition. A family, along with each <strong>in</strong>dividual <strong>in</strong> it, is considered<br />
poor if the family’s total <strong>in</strong>come is less than that family’s threshold. The poverty thresholds do not vary geographically <strong>and</strong> are adjusted annually for <strong>in</strong>flation<br />
us<strong>in</strong>g the Consumer Price Index. The official poverty def<strong>in</strong>ition counts money <strong>in</strong>come before taxes <strong>and</strong> does not <strong>in</strong>clude capital ga<strong>in</strong>s <strong>and</strong> noncash benefits<br />
(such as public hous<strong>in</strong>g, Medicaid, <strong>and</strong> food stamps). Race categories exclude persons of Hispanic ethnicity.<br />
SOURCE: U.S. Department of Commerce, Census Bureau, American Community Survey, 2010.<br />
The percentage of Hispanic children liv<strong>in</strong>g <strong>in</strong> poverty<br />
differed by nativity. In 2010, the percentage of Hispanic<br />
children who were liv<strong>in</strong>g <strong>in</strong> poverty was higher for<br />
children born outside of the United States than for those<br />
born with<strong>in</strong> the United States (39 vs. 31 percent). The<br />
same pattern by nativity was found <strong>in</strong> the poverty rates for<br />
children liv<strong>in</strong>g with a s<strong>in</strong>gle mother. Of those children <strong>in</strong><br />
this liv<strong>in</strong>g arrangement, 54 percent of Hispanic children<br />
born outside of the United States were liv<strong>in</strong>g <strong>in</strong> poverty,<br />
compared with 49 percent of those born with<strong>in</strong> the<br />
United States.<br />
Overall, a higher percentage of children were liv<strong>in</strong>g <strong>in</strong><br />
poverty <strong>in</strong> 2010 than <strong>in</strong> 2005 (21 vs. 18 percent). This<br />
f<strong>in</strong>d<strong>in</strong>g was true for both male <strong>and</strong> female children. Some<br />
differences were found by race/ethnicity: the percentages<br />
of White, Black, Hispanic, <strong>and</strong> American Indian children,<br />
<strong>and</strong> children of two or more races liv<strong>in</strong>g <strong>in</strong> poverty were<br />
higher <strong>in</strong> 2010 than <strong>in</strong> 2005. For example, 30 percent of<br />
American Indian children were liv<strong>in</strong>g <strong>in</strong> poverty <strong>in</strong><br />
2005 compared with 36 percent <strong>in</strong> 2010. The poverty rate<br />
for all children liv<strong>in</strong>g with a s<strong>in</strong>gle mother was also higher<br />
<strong>in</strong> 2010 than 2005 (44 vs. 42 percent). The percentage<br />
of Black children liv<strong>in</strong>g with a s<strong>in</strong>gle mother who were<br />
liv<strong>in</strong>g <strong>in</strong> poverty was higher <strong>in</strong> 2010 than <strong>in</strong> 2005 (51 vs.<br />
50 percent). In addition, the percentage of White children<br />
liv<strong>in</strong>g with a s<strong>in</strong>gle mother who were liv<strong>in</strong>g <strong>in</strong> poverty was<br />
higher <strong>in</strong> 2010 than <strong>in</strong> 2005 (35 vs. 32 percent).<br />
Technical Notes<br />
To determ<strong>in</strong>e liv<strong>in</strong>g arrangements, children are classified<br />
either by their parent’s marital status or, if no parents<br />
are present <strong>in</strong> the household, by the marital status of the<br />
related householder. Children were identified as liv<strong>in</strong>g<br />
with a s<strong>in</strong>gle mother if they were liv<strong>in</strong>g with a female<br />
parent with no spouse present <strong>in</strong> the household. Poverty<br />
<strong>in</strong>formation was available only for children who were<br />
related to the householder. Therefore, estimates exclude<br />
any children who were not related to the householder<br />
or who are recorded as the householder or spouse of the<br />
householder. To def<strong>in</strong>e poverty, the U.S. Census Bureau<br />
uses a set of money <strong>in</strong>come thresholds that vary by<br />
family size <strong>and</strong> composition. A family, along with each<br />
<strong>in</strong>dividual <strong>in</strong> it, is considered poor if the family’s total<br />
<strong>in</strong>come is less than that family’s threshold. The poverty<br />
thresholds do not vary geographically <strong>and</strong> are adjusted<br />
annually for <strong>in</strong>flation us<strong>in</strong>g the Consumer Price Index.<br />
The official poverty def<strong>in</strong>ition counts money <strong>in</strong>come<br />
before taxes <strong>and</strong> does not <strong>in</strong>clude capital ga<strong>in</strong>s <strong>and</strong><br />
noncash benefits (such as public hous<strong>in</strong>g, Medicaid, <strong>and</strong><br />
food stamps). Born with<strong>in</strong> the United States <strong>in</strong>cludes the<br />
50 states, the District of Columbia, Puerto Rico, Guam,<br />
the U.S. Virg<strong>in</strong> Isl<strong>and</strong>s, the Northern Marianas, <strong>and</strong><br />
those born abroad of American parents.<br />
Demographic Context 9
Table 1-1.<br />
Percentage of children under age 18 liv<strong>in</strong>g <strong>in</strong> poverty, by liv<strong>in</strong>g arrangements, sex, race/ethnicity, <strong>and</strong><br />
nativity: 2005 <strong>and</strong> 2010<br />
Sex, race/ethnicity, <strong>and</strong><br />
nativity 2005 2010<br />
Liv<strong>in</strong>g arrangement<br />
All children related to<br />
householder 2005 2010<br />
Married<br />
parents<br />
Female<br />
parent,<br />
no spouse<br />
present<br />
Male<br />
parent,<br />
no spouse<br />
present<br />
Married<br />
parents<br />
Female<br />
parent,<br />
no spouse<br />
present<br />
Male<br />
parent,<br />
no spouse<br />
present<br />
Total 1 18.3 21.1 8.8 42.3 21.4 10.8 44.1 26.0<br />
Sex<br />
Male 18.0 21.0 8.8 42.1 20.8 10.7 44.4 25.5<br />
Female 18.5 21.3 8.9 42.4 22.1 10.9 43.8 26.7<br />
Race/ethnicity<br />
White 10.4 12.7 5.3 31.8 15.4 6.6 35.1 19.6<br />
Black 35.5 37.8 12.9 49.7 30.2 14.5 51.3 34.8<br />
Hispanic 29.2 31.9 19.9 50.6 26.8 22.3 49.6 31.9<br />
Asian 12.1 12.2 8.8 32.4 20.8 9.5 29.3 21.7<br />
Native Hawaiian/Pacific<br />
Isl<strong>and</strong>er 21.5 22.0 16.1 38.0 ‡ 18.9 33.2 17.0<br />
American Indian/Alaska<br />
Native 2 29.9 34.0 17.0 46.7 33.1 18.6 50.2 39.1<br />
American Indian 30.2 35.5 16.3 47.5 35.4 19.1 52.8 38.9<br />
Alaska Native 24.3 24.6 16.5 35.5 36.3 ! 13.5 36.4 27.6 !<br />
Two or more races 19.1 21.3 7.1 39.8 23.1 8.7 41.3 24.7<br />
Race/ethnicity by sex<br />
Male<br />
White 10.4 12.6 5.3 31.8 15.3 6.5 35.5 19.5<br />
Black 34.9 37.6 12.9 49.1 28.4 13.8 51.7 33.3<br />
Hispanic 28.9 31.7 19.8 50.5 26.3 22.2 49.5 31.4<br />
Asian 12.6 12.4 9.0 36.3 19.8 9.9 29.4 18.9<br />
Native Hawaiian/<br />
Pacific Isl<strong>and</strong>er 21.2 21.0 16.0 39.3 ‡ 19.4 28.8 13.9 !<br />
American Indian/<br />
Alaska Native 2 31.0 35.1 18.9 48.7 28.2 19.8 50.4 41.3<br />
American Indian 30.7 37.1 18.0 48.7 29.0 21.0 52.6 41.2<br />
Alaska Native 26.5 25.5 19.4 36.2 36.9 ! 13.4 36.3 36.1 !<br />
Two or more races 18.7 21.5 6.7 39.8 22.3 8.6 42.3 25.0<br />
Female<br />
White 10.5 12.7 5.3 31.8 15.6 6.6 34.7 19.7<br />
Black 36.2 38.1 12.9 50.4 32.4 15.2 51.0 36.5<br />
Hispanic 29.5 32.1 20.0 50.6 27.3 22.4 49.6 32.4<br />
Asian 11.6 12.0 8.5 28.8 22.0 9.1 29.2 25.2<br />
Native Hawaiian/<br />
Pacific Isl<strong>and</strong>er 21.9 23.1 16.2 36.6 ‡ 18.3 38.9 21.3 !<br />
American Indian/<br />
Alaska Native 2 28.8 32.8 15.1 44.8 39.2 17.3 50.0 36.4<br />
American Indian 29.7 33.9 14.6 46.2 43.1 17.2 53.0 35.9<br />
Alaska Native 22.0 23.6 13.8 34.9 35.6 ! 13.7 36.4 18.2 !<br />
Two or more races 19.6 21.0 7.5 39.8 24.1 8.8 40.3 24.4<br />
Nativity<br />
Hispanic<br />
Born with<strong>in</strong> the United<br />
States 3 28.2 31.3 18.2 49.9 26.4 21.2 49.3 31.4<br />
Born outside of the<br />
United States 36.5 38.8 31.7 57.7 28.9 33.5 54.0 36.8<br />
! Interpret data with caution. The coefficient of variation (CV) for this estimate is 30 percent or greater.<br />
‡ Report<strong>in</strong>g st<strong>and</strong>ards not met (too few cases).<br />
1<br />
Total <strong>in</strong>cludes other racial/ethnic groups not shown separately <strong>in</strong> the table.<br />
2<br />
Includes persons report<strong>in</strong>g American Indian only, Alaska Native only, <strong>and</strong> persons from American Indian <strong>and</strong>/or Alaska Native tribes specified or not<br />
specified.<br />
3<br />
Born with<strong>in</strong> the United States <strong>in</strong>cludes the 50 states, the District of Columbia, Puerto Rico, Guam, the U.S. Virg<strong>in</strong> Isl<strong>and</strong>s, the Northern Marianas, <strong>and</strong><br />
those born abroad of American parents.<br />
NOTE: To determ<strong>in</strong>e liv<strong>in</strong>g arrangements, children are classified by either their parents’ marital status or, if no parents are present <strong>in</strong> the household, by<br />
the marital status of the related householder. Poverty <strong>in</strong>formation was available only for children who were related to the householder. Therefore, this<br />
table excludes any children who were not related to the householder or who are recorded as the householder or spouse of the householder. To def<strong>in</strong>e<br />
poverty, the U.S. Census Bureau utilizes a set of money <strong>in</strong>come thresholds that vary by family size <strong>and</strong> composition. A family, along with each <strong>in</strong>dividual <strong>in</strong><br />
it, is considered poor if the family’s total <strong>in</strong>come is less than that family’s threshold. The poverty thresholds do not vary geographically <strong>and</strong> are adjusted<br />
annually for <strong>in</strong>flation us<strong>in</strong>g the Consumer Price Index. The official poverty def<strong>in</strong>ition counts money <strong>in</strong>come before taxes <strong>and</strong> does not <strong>in</strong>clude capital<br />
ga<strong>in</strong>s <strong>and</strong> noncash benefits (such as public hous<strong>in</strong>g, Medicaid, <strong>and</strong> food stamps). Race categories exclude persons of Hispanic ethnicity.<br />
SOURCE: U.S. Department of Commerce, Census Bureau, American Community Survey, 2005 <strong>and</strong> 2010.<br />
10 <strong>Higher</strong> <strong>Education</strong>: <strong>Gaps</strong> <strong>in</strong> <strong>Access</strong> <strong>and</strong> <strong>Persistence</strong> <strong>Study</strong>
1<br />
Demographics<br />
1<br />
This page <strong>in</strong>tentionally left blank.<br />
Demographic Context 11
Indicator 2<br />
Parents’ <strong>Education</strong>al Atta<strong>in</strong>ment<br />
In 2010, no measurable differences were found <strong>in</strong> parental educational atta<strong>in</strong>ment<br />
between male <strong>and</strong> female children, but racial/ethnic groups differed on this<br />
background <strong>in</strong>dicator.<br />
This <strong>in</strong>dicator describes children ages 6 to 18 <strong>in</strong> terms<br />
of the highest education level of either parent <strong>in</strong> the<br />
household, with a focus on three educational atta<strong>in</strong>ment<br />
levels: less than high school completion, high school<br />
completion, <strong>and</strong> completion of a bachelor’s or higher<br />
degree. In 2010, about 11 percent of children between<br />
the ages of 6 <strong>and</strong> 18 lived <strong>in</strong> a household where neither<br />
parent had earned at least a high school credential (either<br />
a diploma or an equivalency credential such as a General<br />
<strong>Education</strong>al Development [GED] certificate). Twenty-one<br />
percent of children had at least one parent whose highest<br />
level of educational atta<strong>in</strong>ment was complet<strong>in</strong>g high<br />
school, <strong>and</strong> 35 percent of children between the ages of<br />
6 <strong>and</strong> 18 had at least one parent who had completed a<br />
bachelor’s or higher degree.<br />
The percentage of children with parents who had not<br />
earned a high school credential was 11 percent for both<br />
males <strong>and</strong> females. There were no measurable differences<br />
by sex <strong>in</strong> the percentage of children whose parents’<br />
highest level of education was complet<strong>in</strong>g high school, nor<br />
were differences found by sex for children whose parents’<br />
highest educational atta<strong>in</strong>ment was earn<strong>in</strong>g a bachelor’s<br />
degree or higher. When measur<strong>in</strong>g differences by sex<br />
with<strong>in</strong> racial/ethnic groups, none were found at any of<br />
the three levels of educational atta<strong>in</strong>ment exam<strong>in</strong>ed (less<br />
than high school completion, high school completion, <strong>and</strong><br />
bachelor’s or higher degree completion).<br />
A higher percentage of Hispanic children (31 percent)<br />
than children of all other/racial ethnic groups had<br />
parents who had not completed high school. In addition,<br />
a higher percentage of Black children (11 percent) had<br />
parents who had not completed high school than had<br />
Asian (10 percent), Alaska Native (7 percent), Native<br />
Hawaiian/Pacific Isl<strong>and</strong>er (5 percent), children of two or<br />
more races (5 percent), <strong>and</strong> White children (4 percent).<br />
The percentages of American Indian (11 percent) <strong>and</strong><br />
Asian children whose parents had not completed high<br />
school were higher than those for White children, Native<br />
Hawaiian/Pacific Isl<strong>and</strong>er children, <strong>and</strong> children of two<br />
or more races. These overall race/ethnicity patterns were<br />
similar for females <strong>and</strong> males across all reported racial/<br />
ethnic groups, except that no measurable differences were<br />
found between Black males <strong>and</strong> Asian <strong>and</strong> Alaska Native<br />
males.<br />
The percentage of children whose parents had completed<br />
high school as their highest level of educational<br />
atta<strong>in</strong>ment also differed across racial/ethnic groups.<br />
<strong>Higher</strong> percentages of Alaska Natives (37 percent),<br />
Native Hawaiians/Pacific Isl<strong>and</strong>ers (30 percent), Blacks<br />
Figure 2-1.<br />
Percentage of children ages 6–18 whose parents’ highest level of educational atta<strong>in</strong>ment was less than<br />
high school completion, by child’s race/ethnicity <strong>and</strong> sex: 2010<br />
Percent<br />
100<br />
80<br />
60<br />
40<br />
31 31<br />
20<br />
11 11<br />
4 4<br />
11 11<br />
10 9<br />
5 5!<br />
11 11<br />
9!<br />
4! 5 5<br />
0<br />
Total¹ White Black Hispanic Asian Native<br />
Hawaiian/<br />
Pacific<br />
Isl<strong>and</strong>er<br />
Race/ethnicity<br />
American<br />
Indian<br />
Alaska<br />
Native<br />
Two or<br />
more races<br />
Male<br />
Female<br />
! Interpret data with caution. The coefficient of variation (CV) for this estimate is 30 percent or greater.<br />
¹ Total <strong>in</strong>cludes other racial/ethnic groups not shown separately <strong>in</strong> the figure.<br />
NOTE: Parent education reflects the highest level of education atta<strong>in</strong>ed by any parent resid<strong>in</strong>g with the child. Parents <strong>in</strong>clude adoptive <strong>and</strong> step-parents but<br />
exclude nonresidential parents. Race categories exclude persons of Hispanic ethnicity.<br />
SOURCE: U.S. Department of Commerce, Census Bureau, American Community Survey, 2010.<br />
12 <strong>Higher</strong> <strong>Education</strong>: <strong>Gaps</strong> <strong>in</strong> <strong>Access</strong> <strong>and</strong> <strong>Persistence</strong> <strong>Study</strong>
Figure 2-2.<br />
Percentage of children ages 6–18 whose parents’ highest level of educational atta<strong>in</strong>ment was a<br />
bachelor’s degree or higher, by child’s race/ethnicity <strong>and</strong> sex: 2010<br />
2<br />
Percent<br />
100<br />
80<br />
60<br />
40<br />
20<br />
35 35<br />
44 44<br />
20 20<br />
16 16<br />
59 59<br />
17<br />
20<br />
18 18<br />
11<br />
22<br />
39 38<br />
Demographics<br />
0<br />
Total¹ White Black Hispanic Asian Native<br />
Hawaiian/<br />
Pacific<br />
Isl<strong>and</strong>er<br />
Race/ethnicity<br />
American<br />
Indian<br />
Alaska<br />
Native<br />
Two or<br />
more races<br />
1<br />
Male<br />
Female<br />
¹ Total <strong>in</strong>cludes other racial/ethnic groups not shown separately <strong>in</strong> the figure.<br />
NOTE: Parent education reflects the highest level of education atta<strong>in</strong>ed by any parent resid<strong>in</strong>g with the child. Parents <strong>in</strong>clude adoptive <strong>and</strong> step-parents but<br />
exclude nonresidential parents. Race categories exclude persons of Hispanic ethnicity.<br />
SOURCE: U.S. Department of Commerce, Census Bureau, American Community Survey, 2010.<br />
(27 percent), Hispanics (25 percent), <strong>and</strong> American<br />
Indians (25 percent) had parents who completed high<br />
school as their highest level of education compared with<br />
Whites (18 percent), Asians (13 percent), <strong>and</strong> children of<br />
two or more races (17 percent). The percentage for Alaska<br />
Native children was also higher than the percentages for<br />
Black <strong>and</strong> Hispanic children.<br />
The percentage of Asian children (59 percent) who had<br />
parents with at least a bachelor’s degree was higher than<br />
Technical Notes<br />
Parent education reflects the highest level of education<br />
atta<strong>in</strong>ed by any parent resid<strong>in</strong>g with the child.<br />
the percentages of children of all other racial/ethnic<br />
groups. The percentages of Asian, White (44 percent),<br />
<strong>and</strong> children of two or more races (38 percent) who had<br />
parents with a bachelor’s degree or higher were larger<br />
than the correspond<strong>in</strong>g percentages of Black (20 percent),<br />
Hispanic (16 percent), Native Hawaiian/Pacific Isl<strong>and</strong>er<br />
(18 percent), American Indian (18 percent), <strong>and</strong> Alaska<br />
Native children (16 percent).<br />
Parents <strong>in</strong>clude adoptive <strong>and</strong> step-parents but exclude<br />
nonresidential parents.<br />
Demographic Context 13
Table 2-1.<br />
Sex <strong>and</strong> race/ethnicity<br />
Sex<br />
Percentage distribution of children ages 6–18, by parents’ highest level of educational atta<strong>in</strong>ment <strong>and</strong><br />
child’s sex <strong>and</strong> race/ethnicity: 2010<br />
Less than<br />
high<br />
school<br />
completion<br />
High<br />
school<br />
completion<br />
1<br />
Some<br />
college<br />
Associate’s<br />
degree<br />
Total<br />
Bachelor’s or higher degree<br />
Bachelor’s<br />
degree<br />
Master’s<br />
degree<br />
Doctor’s<br />
or firstprofessional<br />
degree<br />
Total 2 11.1 20.5 23.1 10.3 34.9 20.4 9.9 4.6<br />
Male 11.1 20.5 23.1 10.3 35.0 20.6 9.8 4.6<br />
Female 11.2 20.6 23.0 10.4 34.8 20.2 10.0 4.6<br />
Race/ethnicity<br />
White 3.8 17.7 22.4 11.7 44.3 25.6 12.9 5.9<br />
Black 11.2 26.9 31.2 10.4 20.3 12.8 5.8 1.7<br />
Hispanic 30.6 25.4 21.0 7.2 15.8 10.5 3.7 1.7<br />
Asian 9.8 13.1 11.4 7.1 58.6 29.8 17.1 11.7<br />
Native Hawaiian/Pacific<br />
Isl<strong>and</strong>er 5.0 30.3 32.6 14.1 18.1 14.2 2.2 ! 1.7 !<br />
American Indian/Alaska<br />
Native 3 10.7 26.1 33.5 10.9 18.8 13.6 3.9 1.3<br />
American Indian 11.0 25.4 33.9 11.4 18.3 13.5 3.8 1.0<br />
Alaska Native 6.7 ! 37.2 33.4 6.3 ! 16.4 12.2 2.8 ! ‡<br />
Two or more races 5.4 17.1 27.0 12.1 38.3 21.5 11.0 5.8<br />
Race/ethnicity by sex<br />
Male<br />
White 3.7 17.7 22.6 11.6 44.4 25.9 12.6 5.9<br />
Black 11.0 26.9 31.0 10.7 20.3 12.8 5.8 1.8<br />
Hispanic 30.7 25.4 20.9 7.1 15.9 10.4 3.8 1.7<br />
Asian 10.3 12.7 11.4 7.1 58.5 30.4 16.9 11.3<br />
Native Hawaiian/<br />
Pacific Isl<strong>and</strong>er 5.3 33.2 30.3 14.7 16.5 13.1 2.0 ! 1.4 !<br />
American Indian/<br />
Alaska Native 3 10.7 26.5 34.3 10.2 18.3 12.9 3.9 1.5<br />
American Indian 11.1 25.6 34.5 10.6 18.2 13.0 4.0 1.2<br />
Alaska Native 9.1 ! 38.2 35.6 5.7 ! 11.4 6.9 ! 3.5 ! ‡<br />
Two or more races 5.4 16.8 27.2 11.5 39.0 21.6 11.6 5.9<br />
Female<br />
White 3.9 17.8 22.3 11.8 44.3 25.3 13.1 5.9<br />
Black 11.5 26.9 31.3 10.0 20.3 12.9 5.8 1.7<br />
Hispanic 30.5 25.3 21.1 7.3 15.8 10.5 3.6 1.7<br />
Asian 9.4 13.5 11.3 7.2 58.7 29.2 17.3 12.1<br />
Native Hawaiian/<br />
Pacific Isl<strong>and</strong>er 4.6 ! 26.4 35.6 13.2 20.3 15.6 2.6 ! ‡<br />
American Indian/<br />
Alaska Native 3 10.7 25.7 32.6 11.6 19.4 14.4 4.0 1.0<br />
American Indian 10.9 25.2 33.4 12.2 18.4 14.0 3.5 0.8 !<br />
Alaska Native 4.1 ! 36.2 31.1 ‡ 21.6 17.8 ‡ ‡<br />
Two or more races 5.5 17.4 26.8 12.8 37.6 21.5 10.4 5.7<br />
! Interpret data with caution. The coefficient of variation (CV) for this estimate is 30 percent or greater.<br />
‡ Report<strong>in</strong>g st<strong>and</strong>ards not met. Either there are too few cases or the coefficient of variation (CV) is 50 percent or greater.<br />
1<br />
Includes high school diploma or equivalent.<br />
2<br />
Total <strong>in</strong>cludes other racial/ethnic groups not shown separately <strong>in</strong> the table.<br />
3<br />
Includes American Indian alone, Alaska Native alone, <strong>and</strong> persons from American Indian <strong>and</strong>/or Alaska Native tribes specified or not specified.<br />
NOTE: Parent education reflects the highest level of education atta<strong>in</strong>ed by any parent resid<strong>in</strong>g with the child. Parents <strong>in</strong>clude adoptive <strong>and</strong> step-parents<br />
but exclude nonresidential parents. Detail may not sum to totals because of round<strong>in</strong>g. Race categories exclude persons of Hispanic ethnicity.<br />
SOURCE: U.S. Department of Commerce, Census Bureau, American Community Survey, 2010.<br />
14 <strong>Higher</strong> <strong>Education</strong>: <strong>Gaps</strong> <strong>in</strong> <strong>Access</strong> <strong>and</strong> <strong>Persistence</strong> <strong>Study</strong>
2<br />
Demographics<br />
1<br />
This page <strong>in</strong>tentionally left blank.<br />
Demographic Context 15
Indicator 3<br />
Parent Involvement <strong>in</strong> <strong>Education</strong><br />
In 2007, a higher percentage of female than male students had parents who<br />
reported participation <strong>in</strong> such school-related activities as attend<strong>in</strong>g a school or<br />
class event or volunteer<strong>in</strong>g or serv<strong>in</strong>g on a school committee. However, a higher<br />
percentage of males than females had parents who attended regularly scheduled<br />
parent-teacher conferences.<br />
In 2007, about 89 percent of students <strong>in</strong> k<strong>in</strong>dergarten<br />
through 12th grade had parents who reported attend<strong>in</strong>g<br />
a general school or PTO/PTA meet<strong>in</strong>g. Some 78 percent<br />
of students had parents who reported attend<strong>in</strong>g regularly<br />
scheduled parent-teacher conferences; 74 percent had<br />
parents who reported attend<strong>in</strong>g a school or class event;<br />
65 percent had parents who reported participat<strong>in</strong>g <strong>in</strong><br />
school fundrais<strong>in</strong>g; <strong>and</strong> 46 percent had parents who<br />
reported volunteer<strong>in</strong>g or serv<strong>in</strong>g on a school committee.<br />
A higher percentage of males than females had parents<br />
who attended regularly scheduled parent-teacher<br />
conferences (79 vs. 77 percent); by comparison, a lower<br />
percentage of male than female students had parents<br />
who attended school or class events (71 vs. 78 percent)<br />
or who volunteered or served on a school committee<br />
(45 vs. 48 percent). These differences by sex were also<br />
observed for White <strong>and</strong> Hispanic students with one<br />
exception: no measurable differences were found between<br />
the percentages of White male <strong>and</strong> White female<br />
students whose parents volunteered or served on a school<br />
committee.<br />
Parental participation <strong>in</strong> some school-related activities<br />
varied by race/ethnicity. A higher percentage of White<br />
students than Black <strong>and</strong> Hispanic students had parents<br />
who reported participation <strong>in</strong> such school-related<br />
activities as attend<strong>in</strong>g a school or class event, volunteer<strong>in</strong>g<br />
or serv<strong>in</strong>g on a school committee, or participat<strong>in</strong>g <strong>in</strong><br />
school fundrais<strong>in</strong>g. These racial/ethnic differences <strong>in</strong><br />
parents’ participation <strong>in</strong> the three school-related activities<br />
were also observed for males as well as females. For<br />
example, 77 percent of White males had parents who<br />
reported attend<strong>in</strong>g a school or class event, compared with<br />
62 percent of Black males <strong>and</strong> 61 percent of Hispanic<br />
males. Some 83 percent of White females had parents who<br />
reported attend<strong>in</strong>g a school or class event, compared with<br />
70 percent of Hispanic females <strong>and</strong> 68 percent of Black<br />
females. In addition, the percentage of female students<br />
whose parents reported attend<strong>in</strong>g a school or class event<br />
Figure 3-1.<br />
Percentage of students <strong>in</strong> grades K through 12 whose parents reported attend<strong>in</strong>g a regularly scheduled<br />
parent-teacher conference, attend<strong>in</strong>g a school or class event, <strong>and</strong> volunteer<strong>in</strong>g or serv<strong>in</strong>g on a school<br />
committee, by race/ethnicity <strong>and</strong> sex: 2007<br />
Attended a regularly scheduled<br />
parent-teacher conference<br />
Attended a school<br />
or class event<br />
Volunteered or served<br />
on a school committee<br />
Total¹<br />
71<br />
78<br />
45<br />
48<br />
White<br />
79<br />
76<br />
77<br />
83<br />
54<br />
54<br />
Race/<br />
ethnicity<br />
Black<br />
77<br />
78<br />
77 79 0 50 100<br />
62<br />
68<br />
32<br />
39<br />
Hispanic<br />
83<br />
77<br />
61<br />
70<br />
29<br />
35<br />
Asian<br />
82<br />
77<br />
74<br />
69<br />
40<br />
52<br />
0 50 100<br />
Percent<br />
0 50 100<br />
Male<br />
Female<br />
1<br />
Total <strong>in</strong>cludes other racial/ethnic groups not shown separately <strong>in</strong> the figure.<br />
NOTE: Report<strong>in</strong>g st<strong>and</strong>ards for Native Hawaiian/Pacific Isl<strong>and</strong>er males <strong>and</strong> females <strong>and</strong> American Indian/Alaska Native males were not met; therefore, data<br />
for these groups are not shown <strong>in</strong> the figure. Race categories exclude persons of Hispanic ethnicity.<br />
SOURCE: U.S. Department of <strong>Education</strong>, National Center for <strong>Education</strong> Statistics, Parent <strong>and</strong> Family Involvement <strong>in</strong> <strong>Education</strong> Survey of the National Household<br />
<strong>Education</strong> Surveys Program (NHES), 2007.<br />
16 <strong>Higher</strong> <strong>Education</strong>: <strong>Gaps</strong> <strong>in</strong> <strong>Access</strong> <strong>and</strong> <strong>Persistence</strong> <strong>Study</strong>
was higher for American Indian/Alaska Native females<br />
(93 percent) than White females (83 percent), Hispanic<br />
females (70 percent), Asian females (69 percent), <strong>and</strong><br />
Black females (68 percent).<br />
By comparison, no measurable differences between racial/<br />
ethnic groups were observed <strong>in</strong> the overall percentages<br />
Technical Notes<br />
In this <strong>in</strong>dicator, parent participation <strong>in</strong>dicates<br />
participation <strong>in</strong> school activities by a parent or other<br />
household member. Report<strong>in</strong>g st<strong>and</strong>ards for Native<br />
of students whose parents attended regularly scheduled<br />
parent-teacher conferences. This racial/ethnic pattern<br />
was also observed for males as well as females, with<br />
one exception: a higher percentage of Hispanic males<br />
than White males had parents who attended regularly<br />
scheduled conferences (83 vs. 79 percent).<br />
Hawaiian/Pacific Isl<strong>and</strong>er students were not met;<br />
therefore, data for this group are not discussed <strong>in</strong> the text.<br />
3<br />
Demographics<br />
1<br />
Demographic Context 17
Table 3-1.<br />
Sex <strong>and</strong> race/ethnicity<br />
Sex<br />
Percentage of students <strong>in</strong> grades K through 12 whose parents reported participation <strong>in</strong> school-related<br />
activities, by sex <strong>and</strong> race/ethnicity: 2007<br />
Number of<br />
students (<strong>in</strong><br />
thous<strong>and</strong>s)<br />
Participation <strong>in</strong> school activities by parent or other household member<br />
Attended<br />
a general<br />
school or<br />
PTO/PTA<br />
meet<strong>in</strong>g<br />
Attended a<br />
regularly<br />
scheduled<br />
parentteacher<br />
conference<br />
Attended a<br />
school or<br />
class event<br />
Volunteered<br />
or served<br />
on a school<br />
committee<br />
Participated<br />
<strong>in</strong> school<br />
fundrais<strong>in</strong>g<br />
Total 1 51,596 89.4 78.1 74.5 46.4 65.3<br />
Male 26,872 89.3 79.2 71.5 44.8 64.7<br />
Female 24,723 89.6 76.8 77.7 48.1 65.8<br />
Race/ethnicity<br />
White 29,830 91.0 77.8 80.1 54.2 72.5<br />
Black 7,837 86.7 77.3 64.7 35.0 57.8<br />
Hispanic 9,765 86.8 80.2 65.0 31.8 50.6<br />
Asian 1,383 91.0 79.9 71.4 45.8 60.5<br />
Native Hawaiian/Pacific Isl<strong>and</strong>er ‡ ‡ ‡ ‡ ‡ ‡<br />
American Indian/Alaska Native 372 94.2 79.7 80.8 58.4 49.5<br />
Race/ethnicity by sex<br />
Male<br />
White 15,361 91.2 79.1 77.4 54.3 72.2<br />
Black 4,323 84.1 77.7 62.1 31.6 56.9<br />
Hispanic 5,117 87.2 82.7 60.8 29.1 50.7<br />
Asian 719 88.9 82.3 73.7 40.0 61.4<br />
Native Hawaiian/Pacific Isl<strong>and</strong>er ‡ ‡ ‡ ‡ ‡ ‡<br />
American Indian/Alaska Native ‡ ‡ ‡ ‡ ‡ ‡<br />
Female<br />
White 14,469 90.6 76.3 82.9 54.0 72.8<br />
Black 3,514 89.9 76.9 67.9 39.1 58.9<br />
Hispanic 4,648 86.2 77.4 69.6 34.7 50.5<br />
Asian 663 93.2 77.2 68.9 52.1 59.5<br />
Native Hawaiian/Pacific Isl<strong>and</strong>er ‡ ‡ ‡ ‡ ‡ ‡<br />
American Indian/Alaska Native 234 ! 95.2 80.8 93.1 70.3 46.3 !<br />
! Interpret data with caution. The coefficient of variation (CV) for this estimate is 30 percent or greater.<br />
‡ Report<strong>in</strong>g st<strong>and</strong>ards not met. Either there are too few cases or the coefficient of variation (CV) is 50 percent or greater.<br />
1<br />
Total <strong>in</strong>cludes other racial/ethnic groups not shown separately <strong>in</strong> the table.<br />
NOTE: Detail may not sum to totals because of round<strong>in</strong>g. Race categories exclude persons of Hispanic ethnicity.<br />
SOURCE: U.S. Department of <strong>Education</strong>, National Center for <strong>Education</strong> Statistics, Parent <strong>and</strong> Family Involvement <strong>in</strong> <strong>Education</strong> Survey of the National<br />
Household <strong>Education</strong> Surveys Program (NHES), 2007.<br />
18 <strong>Higher</strong> <strong>Education</strong>: <strong>Gaps</strong> <strong>in</strong> <strong>Access</strong> <strong>and</strong> <strong>Persistence</strong> <strong>Study</strong>
3<br />
Demographics<br />
1<br />
This page <strong>in</strong>tentionally left blank.<br />
Demographic Context 19
Indicator 4<br />
Language M<strong>in</strong>ority School-Age Children<br />
In 2010, the percentage of school-age children who spoke a language other<br />
than English at home <strong>and</strong> spoke English with difficulty was higher for Hispanics<br />
(16 percent) <strong>and</strong> Asians (15 percent) than for Alaska Natives (7 percent), Native<br />
Hawaiians/Pacific Isl<strong>and</strong>ers (5 percent), American Indians (2 percent), children of<br />
two or more races (2 percent), Whites (1 percent), <strong>and</strong> Blacks (1 percent).<br />
In 2010, some 11.8 million school-age children (children<br />
ages 5 to 17), mak<strong>in</strong>g up 22 percent of the total<br />
school-age population, spoke a language other than<br />
English at home; among them, 2.7 million (5 percent of<br />
the school-age population) spoke English with difficulty.<br />
Specifically, about 7 percent of children ages 5–9 <strong>and</strong><br />
4 percent of children ages 10–17 spoke a language other<br />
than English at home <strong>and</strong> spoke English with difficulty.<br />
In 2010, the percentage of school-age children who spoke<br />
a language other than English at home <strong>and</strong> spoke English<br />
with difficulty was higher for Hispanics (16 percent) <strong>and</strong><br />
Asians (15 percent) than for Alaska Natives (7 percent),<br />
Native Hawaiians/Pacific Isl<strong>and</strong>ers (5 percent), American<br />
Indians (2 percent), children of two or more races<br />
(2 percent), Whites (1 percent), <strong>and</strong> Blacks (1 percent).<br />
These racial/ethnic differences were also observed for<br />
males as well as females. Specifically, among male<br />
school-age children, 16 percent each of Hispanics <strong>and</strong><br />
Asians spoke a language other than English at home <strong>and</strong><br />
spoke English with difficulty, compared with 6 percent<br />
of Alaska Natives, 4 percent of Native Hawaiians/<br />
Pacific Isl<strong>and</strong>ers, 2 percent of males of two or more races,<br />
<strong>and</strong> 1 percent each of Whites, Blacks, <strong>and</strong> American<br />
Indians. Among female school-age children, 15 percent<br />
of Hispanics <strong>and</strong> 14 percent of Asians spoke a language<br />
other than English at home <strong>and</strong> spoke English with<br />
difficulty, compared with 9 percent of Alaska Natives,<br />
5 percent of Native Hawaiians/Pacific Isl<strong>and</strong>ers, 2 percent<br />
each of American Indians <strong>and</strong> female children of two or<br />
more races, <strong>and</strong> 1 percent each of Whites <strong>and</strong> Blacks.<br />
A higher percentage of males than females spoke a<br />
language other than English at home <strong>and</strong> spoke English<br />
with difficulty, although the difference was less than 1<br />
percentage po<strong>in</strong>t. The percentage of school-age children<br />
who spoke a language other than English at home <strong>and</strong><br />
spoke English with difficulty was higher for Asian males<br />
than Asian females (16 vs. 14 percent). This difference<br />
was also observed between Hispanic males <strong>and</strong> Hispanic<br />
females (16 vs. 15 percent). No measurable differences<br />
were found between males <strong>and</strong> females with<strong>in</strong> other<br />
racial/ethnic groups. In addition, a higher percentage of<br />
Hispanic school-age children born outside of the United<br />
States spoke a non-English language at home <strong>and</strong> spoke<br />
English with difficulty than did their counterparts born<br />
with<strong>in</strong> the United States (35 vs. 13 percent).<br />
Technical Notes<br />
Respondents were asked whether each child <strong>in</strong> the<br />
household spoke a language other than English at home.<br />
If they answered “yes,” they were asked how well each<br />
child could speak English us<strong>in</strong>g the follow<strong>in</strong>g categories:<br />
“very well,” “well,” “not well,” <strong>and</strong> “not at all.” All<br />
children who were reported to speak English less than<br />
“very well” were considered to have difficulty speak<strong>in</strong>g<br />
English. A Spanish-language version of the American<br />
Community Survey (ACS) was available to respondents.<br />
20 <strong>Higher</strong> <strong>Education</strong>: <strong>Gaps</strong> <strong>in</strong> <strong>Access</strong> <strong>and</strong> <strong>Persistence</strong> <strong>Study</strong>
Figure 4-1.<br />
Percent<br />
60<br />
Percentage of children ages 5–17 who spoke a language other than English at home <strong>and</strong> who spoke<br />
English with difficulty, by race/ethnicity <strong>and</strong> sex: 2010<br />
4<br />
50<br />
40<br />
30<br />
20<br />
10<br />
0<br />
5 5<br />
1 1 1 1<br />
16 15 16<br />
14<br />
4 5<br />
Total¹ White Black Hispanic Asian Native<br />
Hawaiian/<br />
Pacific<br />
Isl<strong>and</strong>er<br />
Race/ethnicity<br />
1 2<br />
American<br />
Indian<br />
6<br />
9!<br />
Alaska<br />
Native<br />
2 2<br />
Two or<br />
more races<br />
Demographics<br />
1<br />
Male<br />
Female<br />
! Interpret data with caution. The coefficient of variation (CV) for this estimate is 30 percent or greater.<br />
1<br />
Total <strong>in</strong>cludes other racial/ethnic groups not shown separately <strong>in</strong> the figure.<br />
NOTE: Respondents were asked whether each child <strong>in</strong> the household spoke a language other than English at home. If they answered “yes,” they were asked<br />
how well each child could speak English us<strong>in</strong>g the follow<strong>in</strong>g categories: “very well,” “well,” “not well,” <strong>and</strong> “not at all.” All children who were reported to speak<br />
English less than “very well” were considered to have difficulty speak<strong>in</strong>g English. A Spanish-language version of the American Community Survey (ACS) was<br />
available to respondents. Race categories exclude persons of Hispanic ethnicity.<br />
SOURCE: U.S. Department of Commerce, Census Bureau, American Community Survey (ACS), 2010.<br />
Demographic Context 21
22 <strong>Higher</strong> <strong>Education</strong>: <strong>Gaps</strong> <strong>in</strong> <strong>Access</strong> <strong>and</strong> <strong>Persistence</strong> <strong>Study</strong><br />
Table 4-1.<br />
Number <strong>and</strong> percentage of children ages 5–17 who spoke a language other than English at home <strong>and</strong> who spoke English with difficulty, by sex, race/<br />
ethnicity, <strong>and</strong> nativity: 2010<br />
Sex, race/ethnicity, <strong>and</strong> nativity<br />
Sex<br />
Total<br />
population<br />
Number<br />
[Numbers <strong>in</strong> thous<strong>and</strong>s]<br />
Percent<br />
Spoke a language other than English at home<br />
Spoke English with difficulty<br />
Total Ages 5–9 Ages 10–17<br />
Number Percent Number Percent Number Percent<br />
Total 1 54,037 11,774 21.8 2,710 5.0 1,418 6.9 1,292 3.8<br />
Male 27,693 5,927 21.4 1,420 5.1 736 7.1 684 3.9<br />
Female 26,344 5,847 22.2 1,290 4.9 682 6.8 608 3.7<br />
Race/ethnicity<br />
White 29,421 1,653 5.6 325 1.1 138 1.3 186 1.0<br />
Black 7,645 467 6.1 101 1.3 36 1.3 65 1.3<br />
Hispanic 12,093 7,886 65.2 1,878 15.5 1,050 21.6 828 11.4<br />
Asian 2,314 1,455 62.9 353 15.3 169 18.5 183 13.1<br />
Native Hawaiian/Pacific Isl<strong>and</strong>er 94 28 29.7 4 4.7 2 4.8 3 4.7<br />
American Indian/Alaska Native 2 420 63 15.0 9 2.1 3 2.1 6 2.1<br />
American Indian 340 48 14.2 5 1.6 2 1.5 4 1.7<br />
Alaska Native 28 8 27.2 2 7.5 1 ! 6.6 ! 1 8.0<br />
Two or more races 1,922 184 9.6 33 1.7 16 1.9 17 1.5<br />
Race/ethnicity by sex<br />
Male<br />
White 15,113 817 5.4 161 1.1 70 1.3 91 1.0<br />
Black 3,903 222 5.7 50 1.3 18 1.3 32 1.3<br />
Hispanic 6,206 3,990 64.3 993 16.0 551 22.2 441 11.9<br />
Asian 1,168 742 63.5 191 16.3 87 19.4 104 14.4<br />
Native Hawaiian/Pacific Isl<strong>and</strong>er 52 15 29.3 2 4.3 1 ! 4.8 ! 1 ! 4.0 !<br />
American Indian/Alaska Native 2 213 32 15.1 4 1.8 1 1.4 3 2.0<br />
American Indian 172 25 14.5 2 1.2 1 ! 0.8 ! 2 1.5<br />
Alaska Native 14 4 25.0 1 6.3 # 5.0 ! 1 ! 7.2 !<br />
Two or more races 972 87 9.0 16 1.7 7 1.8 9 1.5<br />
See notes at end of table.
Table 4-1.<br />
Number <strong>and</strong> percentage of children ages 5–17 who spoke a language other than English at home <strong>and</strong> who spoke English with difficulty, by sex, race/<br />
ethnicity, <strong>and</strong> nativity: 2010—Cont<strong>in</strong>ued<br />
Sex, race/ethnicity, <strong>and</strong> nativity<br />
Total<br />
population<br />
Number<br />
[Numbers <strong>in</strong> thous<strong>and</strong>s]<br />
Percent<br />
Spoke a language other than English at home<br />
Spoke English with difficulty<br />
Total Ages 5–9 Ages 10–17<br />
Number Percent Number Percent Number Percent<br />
Total 1 54,037 11,774 21.8 2,710 5.0 1,418 6.9 1,292 3.8<br />
Race/ethnicity by sex<br />
Female<br />
Nativity<br />
White 14,308 836 5.8 163 1.1 69 1.3 95 1.1<br />
Black 3,741 245 6.5 52 1.4 19 1.4 33 1.4<br />
Hispanic 5,887 3,896 66.2 885 15.0 499 21.0 386 11.0<br />
Asian 1,145 712 62.2 162 14.2 83 17.7 79 11.7<br />
Native Hawaiian/Pacific Isl<strong>and</strong>er 43 13 30.1 2 5.1 1 ! 4.6 ! 1 ! 5.4 !<br />
American Indian/Alaska Native 2 207 31 14.9 5 2.5 2 2.9 3 2.2<br />
American Indian 169 23 13.9 3 2.0 1 ! 2.2 ! 2 1.9<br />
Alaska Native 13 4 29.6 1 ! 8.8 ! # 9.0 ! 1 ! 8.7 !<br />
Two or more races 950 97 10.2 16 1.7 8 2.0 8 1.5<br />
Hispanic or Lat<strong>in</strong>o<br />
Born with<strong>in</strong> the United States 3 10,800 6,647 61.6 1,419 13.1 916 20.0 503 8.1<br />
Born outside of the United States 1,293 1,239 95.8 459 35.5 134 48.3 325 32.0<br />
# Rounds to zero.<br />
! Interpret data with caution. The coefficient of variation (CV) for this estimate is 30 percent or greater.<br />
1<br />
Total <strong>in</strong>cludes other racial/ethnic groups not shown separately <strong>in</strong> the table.<br />
2<br />
Includes persons report<strong>in</strong>g American Indian only, Alaska Native only, <strong>and</strong> persons from American Indian <strong>and</strong>/or Alaska Native tribes specified or not specified.<br />
3<br />
Born with<strong>in</strong> the United States refers to the 50 states, the District of Columbia, Puerto Rico, Guam, the U.S. Virg<strong>in</strong> Isl<strong>and</strong>s, <strong>and</strong> the Northern Marianas. Also <strong>in</strong>cludes those born abroad of American parents.<br />
NOTE: Respondents were asked whether each child <strong>in</strong> the household spoke a language other than English at home. If they answered “yes,” they were asked how well each child could speak English us<strong>in</strong>g the<br />
follow<strong>in</strong>g categories: “very well,” “well,” “not well,” <strong>and</strong> “not at all.” All children who were reported to speak English less than “very well” were considered to have difficulty speak<strong>in</strong>g English. A Spanish-language<br />
version of the American Community Survey (ACS) was available to respondents. Detail may not sum to totals because of round<strong>in</strong>g. Race categories exclude persons of Hispanic ethnicity.<br />
SOURCE: U.S. Department of Commerce, Census Bureau, American Community Survey (ACS), 2010.<br />
Demographic Context 23<br />
1<br />
Demographics<br />
4
Indicator 5<br />
Special Needs<br />
Among 9th-grade students <strong>in</strong> 2009, a higher percentage of males (13 percent)<br />
than females (7 percent) received special education services.<br />
In 2009, about 10 percent of 9th-grade students received<br />
special education services. A higher percentage of male<br />
(13 percent) than female (7 percent) students received<br />
special education services. This pattern was also found<br />
among males <strong>and</strong> females for Whites (13 vs. 8 percent),<br />
Blacks (16 vs. 7 percent), Hispanics (12 vs. 6 percent), <strong>and</strong><br />
students of two or more races (14 vs. 7 percent).<br />
Differences <strong>in</strong> the receipt of special education services<br />
were also found across racial/ethnic groups. A higher<br />
percentage of American Indians/Alaska Natives (23<br />
percent) than Whites (11 percent), Blacks (11 percent),<br />
Hispanics (9 percent), Asians (2 percent), <strong>and</strong> students of<br />
two or more races (11 percent) received special education<br />
services. Among male students, a higher percentage of<br />
American Indian/Alaska Natives (27 percent), Whites<br />
(13 percent), Blacks (16 percent), Hispanics (12 percent),<br />
<strong>and</strong> males of two or more races (14 percent) received<br />
special education services than Asian males (2 percent).<br />
Among female students, no statistically significant<br />
differences were found between American Indians/Alaska<br />
Natives <strong>and</strong> other racial/ethnic groups, partially due to<br />
small sample sizes. A higher percentage of Whites (8<br />
percent), Blacks (7 percent), Hispanics (6 percent), <strong>and</strong><br />
females of two or more races (7 percent) received special<br />
education services than Asian females (1 percent).<br />
Us<strong>in</strong>g a different data source <strong>and</strong> year, this <strong>in</strong>dicator<br />
also exam<strong>in</strong>es 12- to 17-year-olds who have ever been<br />
diagnosed with a learn<strong>in</strong>g disability. In 2008, about<br />
9 percent of 12- to 17-year-olds had ever been diagnosed<br />
with a learn<strong>in</strong>g disability, with a higher percentage of<br />
12- to 17-year-old males than females (11 vs. 7 percent)<br />
diagnosed. This pattern was also found among males <strong>and</strong><br />
females for Whites (14 vs. 8 percent) <strong>and</strong> Blacks (11 vs.<br />
7 percent).<br />
Among these data on 12- to 17-year-olds, few differences<br />
<strong>in</strong> learn<strong>in</strong>g diagnosis rates were found across racial/<br />
ethnic groups possibly due, <strong>in</strong> part, to small sample<br />
sizes. In 2008, a higher percentage of 12- to 17-year-old<br />
Whites (11 percent) than 12- to 17-year-old Hispanics<br />
Figure 5-1. Percentage of students receiv<strong>in</strong>g special education services <strong>in</strong> 9th grade, by race/ethnicity <strong>and</strong> sex: 2009<br />
Percent<br />
60<br />
50<br />
40<br />
30<br />
27!<br />
20<br />
10<br />
0<br />
16<br />
19!<br />
13<br />
13<br />
12<br />
7<br />
8<br />
7<br />
6<br />
2!<br />
1!<br />
Total 1 White Black Hispanic Asian American Indian/<br />
Alaska Native<br />
Race/ethnicity<br />
14<br />
7<br />
Two or<br />
more races<br />
Male<br />
Female<br />
! Interpret data with caution. The coefficient of variation (CV) for this estimate is 30 percent or greater.<br />
1<br />
Total <strong>in</strong>cludes other racial/ethnic groups not shown separately <strong>in</strong> the figure.<br />
NOTE: Report<strong>in</strong>g st<strong>and</strong>ards for Native Hawaiians/Pacific Isl<strong>and</strong>ers were not met; therefore, data for this group are not shown <strong>in</strong> the figure. Race categories<br />
exclude persons of Hispanic ethnicity. These data are based on parent reports <strong>and</strong> are weighted by the W1PARENT variable.<br />
SOURCE: U.S. Department of <strong>Education</strong>, National Center for <strong>Education</strong> Statistics, High School Longitud<strong>in</strong>al <strong>Study</strong> of 2009, Base-Year Restricted-Use Data File.<br />
24 <strong>Higher</strong> <strong>Education</strong>: <strong>Gaps</strong> <strong>in</strong> <strong>Access</strong> <strong>and</strong> <strong>Persistence</strong> <strong>Study</strong>
Figure 5-2.<br />
Percent<br />
60<br />
Percentage of children ages 12–17 ever hav<strong>in</strong>g been diagnosed with a learn<strong>in</strong>g disability, by race/<br />
ethnicity <strong>and</strong> sex: 2008<br />
5<br />
50<br />
40<br />
30<br />
20<br />
10<br />
11<br />
7<br />
14<br />
8<br />
11<br />
7 7<br />
5<br />
Demographics<br />
0<br />
Total 1 White Black Hispanic<br />
Race/ethnicity<br />
Male Female<br />
1<br />
1<br />
Total <strong>in</strong>cludes other racial/ethnic groups not shown separately <strong>in</strong> the figure.<br />
NOTE: Report<strong>in</strong>g st<strong>and</strong>ards for Asians, American Indians/Alaska Natives, <strong>and</strong> two or more races were not met; therefore, data for these groups are not shown<br />
<strong>in</strong> the figure. “Learn<strong>in</strong>g disability” is based on parent responses to the question “Has a representative from a school or a health professional ever told you that<br />
[child’s name] had a learn<strong>in</strong>g disability?” Race categories exclude persons of Hispanic ethnicity.<br />
SOURCE: U.S. Department of Health <strong>and</strong> Human Services, Centers for Disease Control <strong>and</strong> Prevention (CDC), National Center for Health Statistics, National<br />
Health Interview Survey, 2008.<br />
(6 percent) had ever been diagnosed with a learn<strong>in</strong>g<br />
disability. In addition, 9 percent of Black youth had ever<br />
been diagnosed with a learn<strong>in</strong>g disability. No measurable<br />
differences <strong>in</strong> learn<strong>in</strong>g diagnosis rates were found between<br />
Black youths <strong>and</strong> White or Hispanic youths.<br />
The percentage of 12- to 17-year-olds ever diagnosed with<br />
a learn<strong>in</strong>g disability <strong>in</strong> 2008, overall <strong>and</strong> by sex, were not<br />
measurably different from those <strong>in</strong> 1999.<br />
Technical Notes<br />
Data on children diagnosed with learn<strong>in</strong>g disabilities<br />
are based on parent responses to the question “Has a<br />
representative from a school or a health professional ever<br />
told you that [child’s name] had a learn<strong>in</strong>g disability?”<br />
Demographic Context 25
Table 5-1.<br />
Percentage of students receiv<strong>in</strong>g special education services <strong>in</strong> 9th grade, by race/ethnicity <strong>and</strong> sex:<br />
2009<br />
Sex Total White Black Hispanic Asian<br />
Sex<br />
Native<br />
Hawaiian/<br />
Pacific<br />
Isl<strong>and</strong>er<br />
American<br />
Indian/<br />
Alaska<br />
Native<br />
Total 1 10.2 10.7 11.3 9.1 1.6 ‡ 23.1 10.6<br />
Male 13.0 13.2 16.4 11.9 2.2 ! ‡ 26.7 ! 14.2<br />
Two or<br />
more<br />
races<br />
Female 7.3 8.0 7.3 6.3 1.1 ! ‡ 18.6 ! 7.2<br />
! Interpret data with caution. The coefficient of variation (CV) for this estimate is 30 percent or greater.<br />
‡ Report<strong>in</strong>g st<strong>and</strong>ards not met (too few cases).<br />
1<br />
Total <strong>in</strong>cludes other racial/ethnic groups not shown separately <strong>in</strong> the table.<br />
NOTE: These data are based on parent reports <strong>and</strong> are weighted by the W1PARENT variable. Race categories exclude persons of Hispanic ethnicity.<br />
SOURCE: U.S. Department of <strong>Education</strong>, National Center for <strong>Education</strong> Statistics, High School Longitud<strong>in</strong>al <strong>Study</strong> of 2009, Base-Year Restricted-Use Data<br />
File.<br />
26 <strong>Higher</strong> <strong>Education</strong>: <strong>Gaps</strong> <strong>in</strong> <strong>Access</strong> <strong>and</strong> <strong>Persistence</strong> <strong>Study</strong>
Table 5-2.<br />
Percentage of children ages 12–17 ever hav<strong>in</strong>g been diagnosed with a learn<strong>in</strong>g disability, by sex <strong>and</strong><br />
race/ethnicity: Selected years, 1999—2008<br />
Sex <strong>and</strong> race/ethnicity 1999 2002 2005 2008<br />
Sex<br />
Total 1 9.6 10.5 9.2 9.4<br />
Male 13.0 13.8 11.0 11.4<br />
Female 6.0 7.1 7.4 7.3<br />
Race/ethnicity<br />
White 10.4 11.0 9.3 11.2<br />
Black 10.3 12.6 10.8 9.1<br />
Hispanic 6.4 7.0 8.2 5.9<br />
Asian ‡ # ‡ ‡<br />
Native Hawaiian/Pacific Isl<strong>and</strong>er — — — —<br />
American Indian/Alaska Native ‡ ‡ ‡ ‡<br />
Two or more races ‡ ‡ ‡ ‡<br />
Race/ethnicity by sex<br />
Male<br />
White 14.0 14.1 10.8 13.8<br />
Black 13.9 17.7 14.5 11.2<br />
Hispanic 8.7 9.1 10.2 6.6<br />
Asian ‡ # ‡ ‡<br />
Native Hawaiian/Pacific Isl<strong>and</strong>er — — — —<br />
American Indian/Alaska Native ‡ ‡ ‡ ‡<br />
Two or more races ‡ ‡ ‡ ‡<br />
5<br />
Demographics<br />
1<br />
Female<br />
White 6.5 7.8 7.7 8.5<br />
Black 6.7 7.2 7.2 6.8<br />
Hispanic 3.9 5.0 6.2 5.1<br />
Asian ‡ # # #<br />
Native Hawaiian/Pacific Isl<strong>and</strong>er — — — —<br />
American Indian/Alaska Native ‡ ‡ ‡ ‡<br />
Two or more races ‡ ‡ ‡ ‡<br />
— Not available.<br />
# Rounds to zero.<br />
‡ Report<strong>in</strong>g st<strong>and</strong>ards not met. Either there are too few cases or the coefficient of variation (CV) is 50 percent or greater.<br />
1<br />
Total <strong>in</strong>cludes other racial/ethnic groups not shown separately <strong>in</strong> the table.<br />
NOTE: “Learn<strong>in</strong>g disability” is based on parent responses to the question “Has a representative from a school or a health professional ever told you that<br />
[child’s name] had a learn<strong>in</strong>g disability?” Race categories exclude persons of Hispanic ethnicity.<br />
SOURCE: U.S. Department of Health <strong>and</strong> Human Services, Centers for Disease Control <strong>and</strong> Prevention (CDC), National Center for Health Statistics,<br />
National Health Interview Survey, 1999, 2002, 2005, <strong>and</strong> 2008.<br />
Demographic Context 27
Chapter 2<br />
Characteristics of Schools<br />
6. Segregation <strong>and</strong> Poverty <strong>in</strong> Schools....................................................................................30<br />
7. Adequate Yearly Progress.....................................................................................................36<br />
8. Types of Public Schools.........................................................................................................38<br />
9. Advanced Coursework Offer<strong>in</strong>gs.........................................................................................44<br />
10. High School Guidance Counsel<strong>in</strong>g.....................................................................................50<br />
28 <strong>Higher</strong> <strong>Education</strong>: <strong>Gaps</strong> <strong>in</strong> <strong>Access</strong> <strong>and</strong> <strong>Persistence</strong> <strong>Study</strong>
Although <strong>in</strong>dividual student characteristics have been shown to <strong>in</strong>fluence academic <strong>in</strong>dicators—such as high school<br />
<strong>and</strong> college completion rates (Adelman 2006; Brady, Ow<strong>in</strong>gs, <strong>and</strong> Qu<strong>in</strong>n 1992; Brooks-Gunn <strong>and</strong> Duncan 1997; Horn<br />
<strong>and</strong> Berktold 1999; Nunez <strong>and</strong> Cuccaro-Alam<strong>in</strong> 1998)—school-level factors (e.g., school poverty <strong>and</strong> segregation) may<br />
also contribute to differences <strong>in</strong> educational outcomes for males <strong>and</strong> females with<strong>in</strong> <strong>and</strong> across racial/ethnic groups.<br />
For example, us<strong>in</strong>g the percentage of a school’s enrollment that is eligible for the National School Lunch Program’s<br />
free or reduced-price lunch (FRPL) as the measure of school poverty, <strong>in</strong> 2007–08 some 68 percent of 12th-graders <strong>in</strong><br />
high-poverty schools graduated with a diploma, compared with 91 percent of 12th-graders <strong>in</strong> low-poverty schools (Aud<br />
et al. 2010). Also <strong>in</strong> that year, about 28 percent of high school graduates from high-poverty schools attended a 4-year<br />
<strong>in</strong>stitution after graduation, compared with 52 percent of high school graduates from low-poverty schools.<br />
The concentration of various racial/ethnic groups at high-poverty <strong>and</strong> other schools is also important to consider when<br />
exam<strong>in</strong><strong>in</strong>g educational outcomes. In 2007–08, for <strong>in</strong>stance, about 14 percent of students attend<strong>in</strong>g high-poverty<br />
elementary schools were White, 34 percent were Black, 46 percent were Hispanic, 4 percent were Asian/Pacific Isl<strong>and</strong>er,<br />
<strong>and</strong> 2 percent were American Indian/Alaska Native. At low-poverty elementary schools, average student enrollment<br />
was 75 percent White, 6 percent Black, 11 percent Hispanic, 7 percent Asian/Pacific Isl<strong>and</strong>er, <strong>and</strong> 1 percent American<br />
Indian/Alaska Native (Aud et al. 2010). Some studies suggest that the number of schools serv<strong>in</strong>g mostly racial/ethnic<br />
m<strong>in</strong>orities <strong>and</strong> lower <strong>in</strong>come students is <strong>in</strong>creas<strong>in</strong>g <strong>and</strong> that these schools tend to be organized <strong>and</strong> operated differently<br />
than those serv<strong>in</strong>g higher <strong>in</strong>come or predom<strong>in</strong>antly White students (Clotfelter 2001, 2004; Frankenberg et al. 2003;<br />
Rumberger <strong>and</strong> Palardy 2005).<br />
There is further evidence that school-level socioeconomic status (SES) may have a greater effect on academic growth<br />
<strong>and</strong> achievement than does <strong>in</strong>dividual student-level SES. (Rumberger <strong>and</strong> Palardy 2005). However, school policies <strong>and</strong><br />
practices, such as academic climate <strong>and</strong> teacher expectations, can serve to either mitigate or <strong>in</strong>crease the magnitude<br />
of SES effects. For example, high schools that offer the opportunity for students to take advanced coursework may<br />
provide an advantage for students <strong>in</strong> terms of college persistance. In a study by Horn <strong>and</strong> Kojaku (2001), students<br />
who completed rigorous high school curricula exhibited greater persistance <strong>in</strong> postsecondary education than their<br />
counterparts who completed core curricula or lower, even when all family background characteristics, <strong>in</strong>dicators<br />
of socioeconomic status, <strong>and</strong> selectivity of first postsecondary <strong>in</strong>stitution attended were taken <strong>in</strong>to consideration.<br />
Another important school program—high school guidance counsel<strong>in</strong>g—has received attention for its potential to<br />
<strong>in</strong>fluence college go<strong>in</strong>g for historically underrepresented students. Research has shown an association between students’<br />
consistent, frequent contact with guidance counselors <strong>and</strong> higher levels of high school achievement, college aspirations,<br />
<strong>and</strong> f<strong>in</strong>ancial aid knowledge (McDonough 2005; Plank <strong>and</strong> Jordan 2001).<br />
Other school-level characteristics are associated with positive <strong>and</strong> negative educational outcomes for student subgroups.<br />
For example, schools with higher proportions of low-<strong>in</strong>come <strong>and</strong> m<strong>in</strong>ority students—<strong>in</strong>clud<strong>in</strong>g those with special needs<br />
or with limited English proficiency—less frequently make adequate yearly progress (AYP) than schools with lower<br />
proportions of such students (U.S. Department of <strong>Education</strong> 2010). 2 To address achievement gaps, school districts <strong>and</strong><br />
states are beg<strong>in</strong>n<strong>in</strong>g to experiment with the use of special schools such as magnet <strong>and</strong> charter schools <strong>in</strong> an attempt to<br />
overcome these academic challenges with diverse student populations.<br />
To further exam<strong>in</strong>e school-level characteristics, chapter 2 <strong>in</strong>vestigates the extent to which males <strong>and</strong> females (with<strong>in</strong><br />
<strong>and</strong> across racial/ethnic groups) attend alternative, charter, <strong>and</strong> magnet schools; high-poverty schools; <strong>and</strong> highperform<strong>in</strong>g<br />
schools. Student access to rigorous coursework <strong>and</strong> guidance programs that provide assistance with college<br />
plann<strong>in</strong>g <strong>and</strong> admission are also explored.<br />
2<br />
The No Child Left Beh<strong>in</strong>d Act of 2001 (NCLB) is designed to ensure that all children reach proficiency <strong>in</strong> read<strong>in</strong>g <strong>and</strong> mathematics by the 2013–14 school year. S<strong>in</strong>ce its<br />
adoption, schools have been accountable for meet<strong>in</strong>g adequate yearly progress (AYP)—the m<strong>in</strong>imum level of improvement that public schools must atta<strong>in</strong> each year under the<br />
Elementary <strong>and</strong> Secondary <strong>Education</strong> Act (ESEA).<br />
Characteristics of Schools 29
Indicator 6<br />
Segregation <strong>and</strong> Poverty <strong>in</strong> Schools<br />
Enrollment at high-poverty public schools was higher <strong>in</strong> school year 2010–11<br />
for Black (41 percent), Hispanic (38 percent), <strong>and</strong> American Indian/Alaska<br />
Native students (31 percent) than it was for Pacific Isl<strong>and</strong>er (19 percent), Asian<br />
(15 percent), <strong>and</strong> White (6 percent) students.<br />
In school year 2010–11, over 49 million students were<br />
enrolled <strong>in</strong> public elementary <strong>and</strong> secondary schools;<br />
52 percent of these students were White, 16 percent were<br />
Black, 23 percent were Hispanic, 5 percent were Asian,<br />
less than 1 percent were Pacific Isl<strong>and</strong>er, 1 percent were<br />
American Indian/Alaska Native, <strong>and</strong> 2 percent were of<br />
two or more races. Exam<strong>in</strong><strong>in</strong>g the composition of public<br />
elementary <strong>and</strong> secondary schools <strong>in</strong> terms of racial/ethnic<br />
<strong>and</strong> poverty concentration provides a picture of the extent<br />
to which students <strong>in</strong> certa<strong>in</strong> racial/ethnic groups may be<br />
racially <strong>and</strong>/or economically isolated.<br />
Look<strong>in</strong>g at enrollment patterns by students’ race/<br />
ethnicity, 84 percent of White students attended a<br />
predom<strong>in</strong>antly White school (a school where at least<br />
50 percent of the students were White), 46 percent of<br />
Black students attended a predom<strong>in</strong>antly Black school,<br />
56 percent of Hispanic students attended a predom<strong>in</strong>antly<br />
Hispanic school, 12 percent of Asians attended a<br />
predom<strong>in</strong>antly Asian school, 13 percent of Pacific Isl<strong>and</strong>er<br />
students attended a predom<strong>in</strong>antly Pacific Isl<strong>and</strong>er<br />
school, <strong>and</strong> 23 percent of American Indian/Alaska Native<br />
students attended a predom<strong>in</strong>antly American Indian/<br />
Alaska Native school. Racial/ethnic enrollment patterns<br />
classified by sex were similar to the overall racial/ethnic<br />
patterns outl<strong>in</strong>ed above.<br />
Concern<strong>in</strong>g school poverty, 24 percent of all students<br />
attended schools where 25 percent or fewer students<br />
were eligible for free or reduced-price lunch (hereafter<br />
low-poverty schools), 56 percent attended schools where<br />
between 26 <strong>and</strong> 75 percent of students were eligible, <strong>and</strong><br />
20 percent attended schools where more than 75 percent<br />
of students were eligible (hereafter high-poverty schools).<br />
<strong>Higher</strong> percentages of Asian students (39 percent), White<br />
students (33 percent), <strong>and</strong> students of two or more races<br />
(25 percent) attended a low-poverty school than did<br />
students <strong>in</strong> other racial/ethnic groups (between 9 <strong>and</strong><br />
14 percent). Conversely, higher percentages of Black<br />
(41 percent), Hispanic (38 percent), <strong>and</strong> American<br />
Indian/Alaska Native students (31 percent) attended a<br />
high-poverty school than did their peers who were Pacific<br />
Isl<strong>and</strong>er (19 percent), of two or more races (16 percent),<br />
Asian (15 percent), <strong>and</strong> White (6 percent). Racial/ethnic<br />
enrollment patterns classified by sex were similar to the<br />
overall racial/ethnic patterns outl<strong>in</strong>ed above.<br />
Figure 6-1.<br />
Percentage of White, Black, Hispanic, Asian, Pacific Isl<strong>and</strong>er, <strong>and</strong> American Indian/Alaska Native<br />
students <strong>in</strong> public elementary <strong>and</strong> secondary schools that enroll 50 percent or more students of their<br />
respective racial or ethnic group, by sex: School year 2010–11<br />
Percent<br />
100<br />
80<br />
84 84<br />
60<br />
56 56<br />
46 46<br />
40<br />
20<br />
12 12 13 13<br />
23 23<br />
0<br />
White Black Hispanic Asian Pacific Isl<strong>and</strong>er American Indian/<br />
Alaska Native<br />
Race/ethnicity<br />
Male<br />
Female<br />
NOTE: Race categories exclude persons of Hispanic ethnicity.<br />
SOURCE: U.S. Department of <strong>Education</strong>, National Center for <strong>Education</strong> Statistics, Common Core of Data (CCD), “Public Elementary/Secondary School Universe<br />
Survey,” 2010–11.<br />
30 <strong>Higher</strong> <strong>Education</strong>: <strong>Gaps</strong> <strong>in</strong> <strong>Access</strong> <strong>and</strong> <strong>Persistence</strong> <strong>Study</strong>
Figure 6-2.<br />
Percentage of students <strong>in</strong> low- <strong>and</strong> high-poverty public elementary <strong>and</strong> secondary schools, by race/<br />
ethnicity <strong>and</strong> sex: School year 2010–11<br />
6<br />
Percent<br />
60<br />
50<br />
40<br />
30<br />
20<br />
10<br />
0<br />
24 24<br />
33 33<br />
9 9<br />
Low-poverty schools<br />
13 13<br />
38 39 14 14<br />
Total 1 White Black Hispanic Asian Pacific<br />
Isl<strong>and</strong>er<br />
11 11<br />
American<br />
Indian/<br />
Alaska<br />
Native<br />
25 25<br />
Two or<br />
more<br />
races<br />
Race/ethnicity<br />
Male<br />
2020<br />
Female<br />
6 6<br />
42 41<br />
High-poverty schools<br />
38 38<br />
15 14<br />
19 19<br />
31 31<br />
16<br />
15<br />
Total 1 White Black Hispanic Asian Pacific American Two or<br />
Isl<strong>and</strong>er Indian/<br />
Alaska<br />
Native<br />
more<br />
races<br />
1<br />
Total <strong>in</strong>cludes other racial/ethnic groups not shown separately <strong>in</strong> the figure.<br />
NOTE: Low-poverty schools are those where 25 percent or fewer students were eligible for free or reduced-price lunch; high-poverty schools are those where<br />
more than 75 percent of students were eligible for free or reduced-price lunch. Race categories exclude persons of Hispanic ethnicity.<br />
SOURCE: U.S. Department of <strong>Education</strong>, National Center for <strong>Education</strong> Statistics, Common Core of Data (CCD), “Public Elementary/Secondary School<br />
Universe Survey,” 2010–11.<br />
School Characteristics<br />
2<br />
Characteristics of Schools 31
Table 6-1.<br />
Sex <strong>and</strong> race/ethnicity<br />
Sex<br />
Percentage of public elementary <strong>and</strong> secondary school students enrolled <strong>in</strong> schools with 50 percent or<br />
more enrollment of specific racial/ethnic groups, by sex <strong>and</strong> race/ethnicity: 2010–11<br />
Total, 50<br />
percent<br />
or more<br />
White enrollment 1 Black enrollment 1 Hispanic enrollment 1<br />
50–75<br />
percent<br />
More<br />
than 75<br />
percent<br />
Total, 50<br />
percent<br />
or more<br />
50–75<br />
percent<br />
More<br />
than 75<br />
percent<br />
Total, 50<br />
percent<br />
or more<br />
50–75<br />
percent<br />
More<br />
than 75<br />
percent<br />
Total 2 56.6 22.8 33.7 9.5 4.4 5.1 17.3 8.7 8.5<br />
Male 56.6 22.8 33.8 9.5 4.4 5.1 17.3 8.8 8.5<br />
Female 56.5 22.8 33.7 9.6 4.4 5.2 17.3 8.7 8.6<br />
Race/ethnicity<br />
White 84.2 27.5 56.7 2.0 1.6 0.3 3.6 2.9 0.8<br />
Black 23.5 17.0 6.5 45.8 16.9 29.0 9.1 7.2 2.0<br />
Hispanic 21.0 14.6 6.4 3.6 2.7 0.9 56.2 23.4 32.9<br />
Asian 39.9 25.7 14.2 3.1 2.3 0.8 12.1 8.9 3.1<br />
Pacific Isl<strong>and</strong>er 27.3 16.2 11.1 2.2 1.4 0.7 13.2 9.7 3.6<br />
American Indian/<br />
Alaska Native 46.7 28.1 18.6 2.7 1.9 0.8 9.4 6.3 3.1<br />
Two or more races 57.7 32.8 24.9 6.8 4.7 2.1 8.1 6.2 1.9<br />
Race/ethnicity by sex<br />
Male<br />
White 84.0 27.4 56.5 2.0 1.7 0.4 3.7 2.9 0.8<br />
Black 23.7 17.0 6.6 45.6 16.8 28.7 9.2 7.2 2.0<br />
Hispanic 21.0 14.6 6.4 3.6 2.7 0.9 56.2 23.4 32.8<br />
Asian 39.0 25.5 13.5 3.2 2.4 0.8 12.4 9.2 3.2<br />
Pacific Isl<strong>and</strong>er 27.1 16.0 11.1 2.1 1.4 0.7 13.3 9.6 3.7<br />
American Indian/<br />
Alaska Native 46.8 28.2 18.6 2.7 1.9 0.8 9.4 6.3 3.1<br />
Two or more races 57.7 32.7 25.0 6.7 4.6 2.0 8.2 6.3 2.0<br />
Female<br />
White 84.4 27.5 56.8 1.9 1.6 0.3 3.6 2.8 0.7<br />
Black 23.3 17.0 6.4 46.1 16.9 29.2 9.1 7.1 1.9<br />
Hispanic 21.0 14.6 6.4 3.5 2.6 0.9 56.3 23.4 32.9<br />
Asian 40.9 25.9 15.0 3.0 2.3 0.7 11.7 8.7 3.0<br />
Pacific Isl<strong>and</strong>er 27.4 16.4 11.0 2.2 1.4 0.8 13.2 9.7 3.5<br />
American Indian/<br />
Alaska Native 46.6 28.0 18.6 2.8 1.9 0.8 9.4 6.2 3.2<br />
Two or more races 57.6 32.9 24.7 6.9 4.8 2.1 8.0 6.1 1.9<br />
See notes at end of table.<br />
32 <strong>Higher</strong> <strong>Education</strong>: <strong>Gaps</strong> <strong>in</strong> <strong>Access</strong> <strong>and</strong> <strong>Persistence</strong> <strong>Study</strong>
Table 6-1.<br />
Sex <strong>and</strong> race/ethnicity<br />
Sex<br />
Percentage of public elementary <strong>and</strong> secondary school students enrolled <strong>in</strong> schools with 50 percent or<br />
more enrollment of specific racial/ethnic groups, by sex <strong>and</strong> race/ethnicity: 2010–11—Cont<strong>in</strong>ued<br />
Total, 50<br />
percent<br />
or more<br />
Asian enrollment 1 Pacific Isl<strong>and</strong>er enrollment 1<br />
50–75<br />
percent<br />
More<br />
than 75<br />
percent<br />
Total, 50<br />
percent<br />
or more<br />
50–75<br />
percent<br />
More<br />
than 75<br />
percent<br />
American Indian/Alaska<br />
Native enrollment 1<br />
Total, 50<br />
percent<br />
or more<br />
50–75<br />
percent<br />
More<br />
than 75<br />
percent<br />
All other<br />
enrollment<br />
1<br />
Total 2 0.9 0.7 0.1 0.1 0.1 # 0.3 0.1 0.2 15.4<br />
Male 0.9 0.7 0.1 0.1 0.1 # 0.3 0.1 0.2 15.4<br />
Female 0.9 0.7 0.1 0.1 # # 0.3 0.1 0.2 15.4<br />
Race/ethnicity<br />
White 0.2 0.2 # # # # 0.1 0.1 # 9.9<br />
Black 0.2 0.2 # # # # # # # 21.3<br />
Hispanic 0.5 0.5 # # # # 0.1 # # 18.6<br />
Asian 11.9 9.6 2.3 0.2 0.2 # # # # 32.7<br />
Pacific Isl<strong>and</strong>er 6.3 6.2 0.2 13.1 8.8 4.4 0.1 0.1 # 37.7<br />
American Indian/<br />
Alaska Native 0.2 0.2 # # # # 22.9 6.8 16.1 18.1<br />
Two or more races 1.0 0.9 0.1 0.2 0.1 # 0.2 0.1 0.1 26.1<br />
Race/ethnicity by sex<br />
Male<br />
White 0.2 0.2 # # # # 0.1 0.1 # 10.0<br />
Black 0.2 0.2 # # # # # # # 21.2<br />
Hispanic 0.5 0.5 # # # # 0.1 # # 18.6<br />
Asian 12.1 9.7 2.4 0.2 0.2 # # # # 33.1<br />
Pacific Isl<strong>and</strong>er 6.4 6.2 0.2 13.1 8.8 4.3 0.1 0.1 # 37.8<br />
American Indian/<br />
Alaska Native 0.2 0.2 # # # # 22.9 6.8 16.1 18.0<br />
Two or more races 1.0 1.0 0.1 0.2 0.1 # 0.2 0.1 0.1 26.0<br />
6<br />
School Characteristics<br />
2<br />
Female<br />
White 0.2 0.2 # # # # 0.1 0.1 # 9.9<br />
Black 0.2 0.2 # # # # # # # 21.3<br />
Hispanic 0.5 0.5 # # # # 0.1 # # 18.6<br />
Asian 11.8 9.5 2.3 0.2 0.2 # # # # 32.3<br />
Pacific Isl<strong>and</strong>er 6.3 6.1 0.2 13.2 8.7 4.5 0.1 0.1 # 37.6<br />
American Indian/<br />
Alaska Native 0.2 0.2 # # # # 22.9 6.9 16.0 18.1<br />
Two or more races 1.0 0.9 0.1 0.1 0.1 # 0.2 0.1 0.1 26.2<br />
# Rounds to zero.<br />
1<br />
Enrollment columns for White, Black, Hispanic, Asian, Pacific Isl<strong>and</strong>er, <strong>and</strong> American Indian/Alaska Native provide the percentage of students who<br />
are enrolled <strong>in</strong> a school where students <strong>in</strong> the specified race or ethnicity group make up one of the follow<strong>in</strong>g: 50 percent or more of that school’s<br />
enrollment, 50–75 percent of that school’s enrollment, or more than 75 percent of that school’s enrollment. For example, 21 percent of Hispanic students<br />
<strong>in</strong> public elementary <strong>and</strong> secondary schools attend a school where 50 percent or more of the students are White, 15 percent attend a school where<br />
50–75 percent of the students are White, <strong>and</strong> 6 percent attend a school where more than 75 percent of the students are White. The “All other enrollment”<br />
column provides the percentage of students enrolled <strong>in</strong> schools with racial/ethnic enrollment compositions other than 50 percent or more White, Black,<br />
Hispanic, Asian, Pacific Isl<strong>and</strong>er, or American Indian/Alaska Native.<br />
2<br />
Total <strong>in</strong>cludes other racial/ethnic groups not shown separately <strong>in</strong> the table <strong>and</strong> students whose racial/ethnic group was not reported.<br />
NOTE: Detail may not sum to totals because of round<strong>in</strong>g. Race categories exclude persons of Hispanic ethnicity.<br />
SOURCE: U.S. Department of <strong>Education</strong>, National Center for <strong>Education</strong> Statistics, Common Core of Data (CCD), “Public Elementary/Secondary School<br />
Universe Survey,” 2010–11.<br />
Characteristics of Schools 33
Table 6-2. Number <strong>and</strong> percentage of public elementary <strong>and</strong> secondary school students <strong>and</strong> percentage<br />
distribution of students eligible for free or reduced-price lunch, by sex <strong>and</strong> race/ethnicity: School year<br />
2010–11<br />
Percentage distribution of students <strong>in</strong> school eligible for<br />
free or reduced-price lunch 2<br />
Sex <strong>and</strong> race/ethnicity<br />
Number of<br />
students 1<br />
Percent of<br />
students 1<br />
Total<br />
25 percent<br />
or fewer<br />
26–50<br />
percent<br />
51–75<br />
percent<br />
More than<br />
75 percent<br />
Total 3 49,212,583 100.0 100.0 24.3 29.0 26.7 20.1<br />
Sex<br />
Male 25,277,620 51.4 100.0 24.2 28.9 26.7 20.1<br />
Female 23,934,411 48.6 100.0 24.4 29.0 26.6 20.0<br />
Race/ethnicity<br />
White 25,801,021 52.4 100.0 33.1 36.5 24.2 6.2<br />
Black 7,873,809 16.0 100.0 8.8 18.9 30.9 41.4<br />
Hispanic 11,367,157 23.1 100.0 13.0 19.4 29.9 37.7<br />
Asian 2,281,908 4.6 100.0 38.7 25.9 20.8 14.6<br />
Pacific Isl<strong>and</strong>er 169,678 0.3 100.0 14.4 32.2 34.2 19.2<br />
American Indian/Alaska Native 561,126 1.1 100.0 11.5 23.8 33.4 31.4<br />
Two or more races 1,157,332 2.4 100.0 25.0 31.8 27.6 15.6<br />
Race/ethnicity by sex<br />
Male<br />
White 13,316,510 27.1 100.0 32.9 36.4 24.3 6.3<br />
Black 4,016,659 8.2 100.0 8.9 18.9 30.7 41.6<br />
Hispanic 5,822,182 11.8 100.0 12.9 19.4 29.9 37.8<br />
Asian 1,163,246 2.4 100.0 38.2 25.7 21.1 14.9<br />
Pacific Isl<strong>and</strong>er 87,657 0.2 100.0 14.4 32.3 34.0 19.3<br />
American Indian/Alaska<br />
Native 287,382 0.6 100.0 11.5 23.8 33.3 31.4<br />
Two or more races 583,984 1.2 100.0 25.0 31.8 27.5 15.7<br />
Female<br />
White 12,484,511 25.4 100.0 33.2 36.6 24.1 6.0<br />
Black 3,857,150 7.8 100.0 8.7 19.0 31.0 41.3<br />
Hispanic 5,544,975 11.3 100.0 13.0 19.4 29.9 37.6<br />
Asian 1,118,662 2.3 100.0 39.2 26.1 20.5 14.2<br />
Pacific Isl<strong>and</strong>er 82,021 0.2 100.0 14.3 32.2 34.4 19.1<br />
American Indian/Alaska<br />
Native 273,744 0.6 100.0 11.4 23.8 33.4 31.4<br />
Two or more races 573,348 1.2 100.0 25.0 31.9 27.7 15.4<br />
1<br />
Includes students enrolled <strong>in</strong> schools that did not report free or reduced-price lunch eligibility.<br />
2<br />
Columns <strong>in</strong>dicate the percentage of students who attended schools where persons who are eligible for free or reduced-price lunch make up one of<br />
the follow<strong>in</strong>g: 25 percent or fewer of that school’s enrollment, 26–50 percent of that school’s enrollment, 51–75 percent of that school’s enrollment, or<br />
more than 75 percent of that school’s enrollment. For example, 24 percent of female students <strong>in</strong> public elementary <strong>and</strong> secondary schools attend a<br />
school where 25 percent or fewer of the students were eligible for free or reduced-price lunch <strong>and</strong> 20 percent attend a school where more than<br />
75 percent of the students were eligible for free or reduced-price lunch.<br />
3<br />
Total <strong>in</strong>cludes other racial/ethnic groups not shown separately <strong>in</strong> the table. Also <strong>in</strong>cludes schools that did not report data on sex <strong>and</strong> race/ethnicity.<br />
NOTE: The National School Lunch Program is a federally assisted meal program. To be eligible, a student must be from a household with an <strong>in</strong>come at<br />
or below 130 percent of the poverty threshold for free lunch, or between 130 percent <strong>and</strong> 185 percent of the poverty threshold for reduced-price lunch.<br />
Schools with miss<strong>in</strong>g data were excluded from the percentage distribution analysis. Detail may not sum to totals because of round<strong>in</strong>g. Race categories<br />
exclude persons of Hispanic ethnicity.<br />
SOURCE: U.S. Department of <strong>Education</strong>, National Center for <strong>Education</strong> Statistics, Common Core of Data (CCD), “Public Elementary/Secondary School<br />
Universe Survey,” 2010-11.<br />
34 <strong>Higher</strong> <strong>Education</strong>: <strong>Gaps</strong> <strong>in</strong> <strong>Access</strong> <strong>and</strong> <strong>Persistence</strong> <strong>Study</strong>
6<br />
School Characteristics<br />
2<br />
This page <strong>in</strong>tentionally left blank.<br />
Characteristics of Schools 35
Indicator 7<br />
Adequate Yearly Progress<br />
In school year 2008–09, higher percentages of Hispanic (48 percent), Black (46<br />
percent), American Indian/Alaska Native (43 percent), <strong>and</strong> Asian/Pacific Isl<strong>and</strong>er<br />
(40 percent) students attended schools that did not meet adequate yearly<br />
progress (AYP) than did their White peers (33 percent).<br />
Adequate yearly progress (AYP) is an <strong>in</strong>dividual state’s<br />
measure of yearly progress toward achiev<strong>in</strong>g state<br />
academic st<strong>and</strong>ards based on criteria conta<strong>in</strong>ed <strong>in</strong> the<br />
Elementary <strong>and</strong> Secondary <strong>Education</strong> Act (ESEA) statute<br />
that <strong>in</strong>volve meet<strong>in</strong>g predeterm<strong>in</strong>ed annual objectives<br />
<strong>in</strong> various subject areas. AYP represents the m<strong>in</strong>imum<br />
level of improvement that public schools must atta<strong>in</strong> each<br />
year. In school year 2008–09, some 60 percent of the<br />
48 million students <strong>in</strong> public elementary <strong>and</strong> secondary<br />
schools that reported data attended a school that met<br />
AYP. Thirty-n<strong>in</strong>e percent attended schools that did not<br />
meet AYP, <strong>and</strong> 1 percent attended schools that were not<br />
required to meet AYP.<br />
Technical Notes<br />
Data are derived from the 96 percent of public schools<br />
that reported on adequate yearly progress. This <strong>in</strong>dicator<br />
presents <strong>in</strong>formation on Asians <strong>and</strong> Pacific Isl<strong>and</strong>ers as<br />
a comb<strong>in</strong>ed category because the data were collected <strong>in</strong><br />
a manner that does not permit separate report<strong>in</strong>g. S<strong>in</strong>ce<br />
The percentage of students attend<strong>in</strong>g schools that did not<br />
meet AYP was similar for males <strong>and</strong> females (both overall<br />
<strong>and</strong> with<strong>in</strong> each racial/ethnic group), although it did vary<br />
by race/ethnicity. <strong>Higher</strong> percentages of Black, Hispanic,<br />
Asian/Pacific Isl<strong>and</strong>er, <strong>and</strong> American Indian/Alaska<br />
Native students than White students attended schools<br />
that did not meet AYP. The percentages were: Hispanics<br />
(48 percent), Blacks (46 percent), American Indians/<br />
Alaska Natives (43 percent), Asians/Pacific Isl<strong>and</strong>ers<br />
(40 percent), <strong>and</strong> Whites (33 percent).<br />
96 percent of all Asian/Pacific Isl<strong>and</strong>er 5- to 24-year-olds<br />
are Asian, this comb<strong>in</strong>ed category substantially reflects<br />
the situation for Asians, rather than Pacific Isl<strong>and</strong>ers.<br />
For more <strong>in</strong>formation, please see the <strong>in</strong>troduction to this<br />
report.<br />
Figure 7-1.<br />
Percentage of students attend<strong>in</strong>g public elementary <strong>and</strong> secondary schools, by status of adequate yearly<br />
progress (AYP), race/ethnicity, <strong>and</strong> sex: School year 2008–09<br />
Race/ethnicity <strong>and</strong> sex<br />
Total 1<br />
White<br />
Black<br />
Hispanic<br />
Asian/<br />
Pacific<br />
Isl<strong>and</strong>er<br />
American<br />
Indian/<br />
Alaska Native<br />
Male<br />
Female<br />
Male<br />
Female<br />
Male<br />
Female<br />
Male<br />
Female<br />
Male<br />
Female<br />
Male<br />
Female<br />
1.1<br />
1.0<br />
0.9<br />
0.8<br />
1.3<br />
1.0<br />
1.8<br />
1.7<br />
0.8<br />
0.7<br />
0.7<br />
0.5<br />
59.9 39.0<br />
60.0 39.0<br />
66.1 33.0<br />
66.2 33.0<br />
52.3 46.5<br />
52.6 46.3<br />
50.3 47.9<br />
50.5 47.8<br />
59.2 40.0<br />
60.0 39.3<br />
56.3 43.1<br />
56.2 43.3<br />
0 10 20 30 40 50 60 70 80 90 100<br />
Not required to<br />
meet AYP<br />
Percent<br />
Met AYP<br />
Did not meet AYP<br />
1<br />
Total <strong>in</strong>cludes other racial/ethnic groups not shown separately <strong>in</strong> the figure.<br />
NOTE: AYP is an <strong>in</strong>dividual state’s measure of yearly progress toward achiev<strong>in</strong>g state academic st<strong>and</strong>ards based on criteria conta<strong>in</strong>ed <strong>in</strong> the Elementary<br />
<strong>and</strong> Secondary <strong>Education</strong> Act (ESEA) statute. AYP is the m<strong>in</strong>imum level of improvement that public schools must atta<strong>in</strong> each year <strong>and</strong> is based on spr<strong>in</strong>g<br />
accountability test<strong>in</strong>g <strong>and</strong> prior performance. Data are derived from the 96 percent of schools that reported on AYP. Race categories exclude persons of<br />
Hispanic ethnicity. Detail may not sum to totals because of round<strong>in</strong>g.<br />
SOURCE: U.S. Department of <strong>Education</strong>, National Center for <strong>Education</strong> Statistics, Common Core of Data (CCD), “Public Elementary/Secondary School<br />
Universe Survey,” 2008–09 <strong>and</strong> EDFacts SY 2008–09.<br />
36 <strong>Higher</strong> <strong>Education</strong>: <strong>Gaps</strong> <strong>in</strong> <strong>Access</strong> <strong>and</strong> <strong>Persistence</strong> <strong>Study</strong>
Table 7-1.<br />
Sex <strong>and</strong> race/ethnicity<br />
Number <strong>and</strong> percentage of students attend<strong>in</strong>g public elementary <strong>and</strong> secondary schools, by status of<br />
adequate yearly progress (AYP), sex, <strong>and</strong> race/ethnicity: School year 2008–09<br />
Total<br />
Not required to<br />
meet AYP<br />
Required to meet AYP<br />
Met AYP<br />
Did not meet<br />
AYP<br />
Total, number 1 48,263,000 520,000 28,936,000 18,808,000<br />
Total, percentage 1 100.0 1.1 60.0 39.0<br />
Sex<br />
Male 100.0 1.1 59.9 39.0<br />
Female 100.0 1.0 60.0 39.0<br />
Race/ethnicity<br />
White 100.0 0.8 66.2 33.0<br />
Black 100.0 1.2 52.4 46.4<br />
Hispanic 100.0 1.7 50.4 47.8<br />
Asian/Pacific Isl<strong>and</strong>er 100.0 0.7 59.6 39.7<br />
American Indian/Alaska Native 100.0 0.6 56.2 43.2<br />
Two or more races — — — —<br />
Race/ethnicity by sex<br />
Male<br />
White 100.0 0.9 66.1 33.0<br />
Black 100.0 1.3 52.3 46.5<br />
Hispanic 100.0 1.8 50.3 47.9<br />
Asian/Pacific Isl<strong>and</strong>er 100.0 0.8 59.2 40.0<br />
American Indian/Alaska Native 100.0 0.7 56.3 43.1<br />
Two or more races — — — —<br />
7<br />
School Characteristics<br />
2<br />
Female<br />
White 100.0 0.8 66.2 33.0<br />
Black 100.0 1.0 52.6 46.3<br />
Hispanic 100.0 1.7 50.5 47.8<br />
Asian/Pacific Isl<strong>and</strong>er 100.0 0.7 60.0 39.3<br />
American Indian/Alaska Native 100.0 0.5 56.2 43.3<br />
Two or more races — — — —<br />
— Not available.<br />
1<br />
Total <strong>in</strong>cludes other racial/ethnic groups not shown separately <strong>in</strong> the table.<br />
NOTE: Excludes enrollments for schools for which no data on AYP were available. AYP is an <strong>in</strong>dividual state’s measure of yearly progress toward achiev<strong>in</strong>g<br />
state academic st<strong>and</strong>ards based on criteria conta<strong>in</strong>ed <strong>in</strong> the Elementary <strong>and</strong> Secondary <strong>Education</strong> Act (ESEA) statute. AYP is the m<strong>in</strong>imum level of<br />
improvement that public schools must atta<strong>in</strong> each year <strong>and</strong> is based on spr<strong>in</strong>g accountability test<strong>in</strong>g <strong>and</strong> prior performance. Data are derived from the<br />
96 percent of schools that reported on AYP. Also, excludes schools for which enrollment data by race/ethnicity <strong>and</strong> sex were not available. Detail may<br />
not sum to totals because of round<strong>in</strong>g. Race categories exclude persons of Hispanic ethnicity.<br />
SOURCE: U.S. Department of <strong>Education</strong>, National Center for <strong>Education</strong> Statistics, Common Core of Data (CCD), “Public Elementary/Secondary School<br />
Universe Survey,” 2008–09 <strong>and</strong> EDFacts SY 2008–09.<br />
Characteristics of Schools 37
Indicator 8<br />
Types of Public Schools<br />
In school year 2010–11, higher percentages of males than females were enrolled at<br />
alternative schools end<strong>in</strong>g <strong>in</strong> grade 12, both overall <strong>and</strong> with<strong>in</strong> each racial/ethnic<br />
group. For example, 6 percent of Hispanic males versus 5 percent of Hispanic<br />
females were enrolled at these schools.<br />
In school year 2010–11, over 49 million students were<br />
enrolled <strong>in</strong> public elementary <strong>and</strong> secondary schools<br />
<strong>in</strong> the United States. Nearly all (98 percent) of them<br />
attended regular public schools, 1 percent attended<br />
alternative schools, <strong>and</strong> less than 1 percent each attended<br />
special education schools <strong>and</strong> vocational education<br />
schools. About 4 percent each of students attended public<br />
charter schools <strong>and</strong> magnet schools, most of which were<br />
also classified as regular schools.<br />
<strong>Higher</strong> percentages of Black, Hispanic, Pacific Isl<strong>and</strong>er,<br />
<strong>and</strong> American Indian/Alaska Native students attended<br />
alternative schools than did their peers who were White,<br />
Asian, <strong>and</strong> of two or more races. <strong>Higher</strong> percentages of<br />
males than females were enrolled at these schools, but<br />
the differences by sex (overall <strong>and</strong> for specific racial/<br />
ethnic groups) were all less than one percentage po<strong>in</strong>t.<br />
At charter schools, higher percentages of students who<br />
were Black, Hispanic, Pacific Isl<strong>and</strong>er, <strong>and</strong> of two or<br />
more races were enrolled than their White, Asian, <strong>and</strong><br />
American Indian/Alaska Native peers. At magnet schools,<br />
higher percentages of students who were Black, Hispanic,<br />
Asian, <strong>and</strong> of two or more races were enrolled than their<br />
White, Pacific Isl<strong>and</strong>er, <strong>and</strong> American Indian/Alaska<br />
Native peers. Female enrollment was higher than male<br />
enrollment overall <strong>and</strong> by race/ethnicity at both charter<br />
<strong>and</strong> magnet schools.<br />
Public schools that end <strong>in</strong> grade 12 enrolled over<br />
15 million students <strong>in</strong> 2010–11. (These schools may<br />
<strong>in</strong>clude both secondary schools <strong>and</strong> schools that offer<br />
both primary <strong>and</strong> secondary grades, as long as the last<br />
grade is grade 12.) N<strong>in</strong>ety-five percent of students <strong>in</strong><br />
schools that end <strong>in</strong> grade 12 attended regular public<br />
schools, 3 percent attended alternative schools, <strong>and</strong> 1<br />
percent each attended special education schools <strong>and</strong><br />
vocational education schools. Five percent of these<br />
students attended public charter schools, <strong>and</strong> 6 percent<br />
attended magnet schools.<br />
<strong>Higher</strong> percentages of Hispanic (5 percent), American<br />
Indian/Alaska Native (5 percent), Black (4 percent), <strong>and</strong><br />
Pacific Isl<strong>and</strong>er (4 percent) students enrolled <strong>in</strong> alternative<br />
schools that end <strong>in</strong> grade 12 than students of two or more<br />
races (3 percent) <strong>and</strong> White <strong>and</strong> Asian students (2 percent<br />
each). Male enrollment was higher than female enrollment<br />
at alternative schools that end <strong>in</strong> grade 12 overall <strong>and</strong><br />
for each racial/ethnic group. For example, 6 percent of<br />
Hispanic males versus 5 percent of Hispanic females were<br />
enrolled at these schools.<br />
Figure 8-1.<br />
Percentage of students <strong>in</strong> public alternative elementary <strong>and</strong> secondary schools end<strong>in</strong>g <strong>in</strong> grade 12, by<br />
race/ethnicity <strong>and</strong> sex: School year 2010–11<br />
Percent<br />
60<br />
50<br />
40<br />
30<br />
20<br />
10<br />
0<br />
3 3<br />
2 2<br />
5 3<br />
6 5<br />
2 2<br />
4 4 5 5 4 3<br />
Total 1 White Black Hispanic Asian Pacific Isl<strong>and</strong>er American<br />
Indian/Alaska<br />
Race/ethnicity<br />
Native<br />
Two or more<br />
races<br />
Male<br />
Female<br />
1<br />
Total <strong>in</strong>cludes other racial/ethnic groups not shown separately <strong>in</strong> the figure.<br />
NOTE: Race categories exclude persons of Hispanic ethnicity.<br />
SOURCE: U.S. Department of <strong>Education</strong>, National Center for <strong>Education</strong> Statistics, Common Core of Data (CCD), “Public Elementary/Secondary School<br />
Universe Survey,” 2010–11.<br />
38 <strong>Higher</strong> <strong>Education</strong>: <strong>Gaps</strong> <strong>in</strong> <strong>Access</strong> <strong>and</strong> <strong>Persistence</strong> <strong>Study</strong>
Figure 8-2.<br />
Percentage of students <strong>in</strong> public charter <strong>and</strong> magnet elementary <strong>and</strong> secondary schools end<strong>in</strong>g <strong>in</strong> grade<br />
12, by race/ethnicity <strong>and</strong> sex: School year 2010–11<br />
8<br />
Percent<br />
60<br />
50<br />
40<br />
30<br />
20<br />
10<br />
0<br />
5 5 4 4<br />
6 7 6 7<br />
Charter schools<br />
3 3<br />
7 7<br />
Total 1 White Black Hispanic Asian Pacific<br />
Isl<strong>and</strong>er<br />
4 5 7 8<br />
American<br />
Indian/<br />
Alaska<br />
Native<br />
Two or<br />
more<br />
races<br />
Race/ethnicity<br />
Male<br />
6<br />
6<br />
Female<br />
4 4<br />
Magnet schools<br />
11 13 8 8 8 9<br />
4 5 3 3<br />
7 7<br />
Total 1 White Black Hispanic Asian Pacific American Two or<br />
Isl<strong>and</strong>er Indian/<br />
Alaska<br />
more<br />
races<br />
Native<br />
1<br />
Total <strong>in</strong>cludes other racial/ethnic groups not shown separately <strong>in</strong> the figure.<br />
NOTE: Race categories exclude persons of Hispanic ethnicity.<br />
SOURCE: U.S. Department of <strong>Education</strong>, National Center for <strong>Education</strong> Statistics, Common Core of Data (CCD), “Public Elementary/Secondary School<br />
Universe Survey,” 2010–11.<br />
School Characteristics<br />
2<br />
At charter schools that end <strong>in</strong> grade 12, higher<br />
percentages of students who were of two or more races<br />
(8 percent), Pacific Isl<strong>and</strong>er (7 percent), Black (7 percent),<br />
Hispanic (6 percent), <strong>and</strong> American Indian/Alaska Native<br />
(5 percent) were enrolled than their peers who were<br />
White (4 percent) <strong>and</strong> Asian (3 percent). The percentage<br />
of female enrollment was higher than that of male<br />
enrollment at charter schools that end <strong>in</strong> grade 12, both<br />
overall <strong>and</strong> for each racial/ethnic group. For <strong>in</strong>stance,<br />
7 percent of Black females were enrolled at these schools,<br />
compared with 6 percent of Black males. At magnet<br />
Technical Notes<br />
A special education school is a public elementary/<br />
secondary school that focuses primarily on special<br />
education—<strong>in</strong>clud<strong>in</strong>g <strong>in</strong>struction for students with<br />
various conditions—<strong>and</strong> that adapts curriculum,<br />
materials, or <strong>in</strong>struction for students served. A vocational<br />
education school is a public elementary/secondary school<br />
that focuses primarily on provid<strong>in</strong>g formal preparation for<br />
semiskilled, skilled, technical, or professional occupations<br />
for high-school-age students who have opted to develop<br />
or exp<strong>and</strong> their employment opportunities, often <strong>in</strong> lieu<br />
of prepar<strong>in</strong>g for college entry. An alternative education<br />
school is a public elementary/secondary school that<br />
(1) addresses needs of students that typically cannot<br />
be met <strong>in</strong> a regular school, (2) provides nontraditional<br />
education, (3) serves as an adjunct to a regular school,<br />
or (4) falls outside the categories of regular, special<br />
schools that end <strong>in</strong> grade 12, higher percentages of<br />
students who were Black (12 percent), Asian (9 percent),<br />
Hispanic (8 percent), <strong>and</strong> of two or more races were<br />
enrolled (7 percent) than Pacific Isl<strong>and</strong>er (5 percent),<br />
White (4 percent), <strong>and</strong> American Indian/Alaska Native<br />
students (3 percent). Females enrolled at these schools <strong>in</strong><br />
higher percentages than males, both overall <strong>and</strong> <strong>in</strong> terms<br />
of race/ethnicity. For <strong>in</strong>stance, at magnet schools end<strong>in</strong>g<br />
<strong>in</strong> grade 12, enrollment was at 13 percent for Black<br />
females, compared with 11 percent for Black males.<br />
education, or vocational education. A charter school is a<br />
school provid<strong>in</strong>g free public elementary <strong>and</strong>/or secondary<br />
education to eligible students under a specific charter<br />
granted by an appropriate authority <strong>and</strong> designated by<br />
such authority to be a charter school. A magnet school is<br />
a special school or program designed to attract students<br />
of different racial/ethnic backgrounds for the purpose<br />
of reduc<strong>in</strong>g, prevent<strong>in</strong>g, or elim<strong>in</strong>at<strong>in</strong>g racial isolation<br />
(50 percent or more m<strong>in</strong>ority enrollment) or to provide<br />
an academic or social focus on a particular theme (e.g.,<br />
science/math, perform<strong>in</strong>g arts, gifted/talented, or foreign<br />
language), or both. Regular, special education, vocational<br />
education, <strong>and</strong> alternative school categories are mutually<br />
exclusive, whereas charter <strong>and</strong> magnet schools can also be<br />
categorized as one of these types of schools.<br />
Characteristics of Schools 39
Table 8-1.<br />
Number <strong>and</strong> percentage distribution of students <strong>in</strong> public elementary <strong>and</strong> secondary schools, by school<br />
type, race/ethnicity, <strong>and</strong> sex: School year 2010–11<br />
Race/ethnicity <strong>and</strong> sex Total Regular<br />
Special<br />
education 1<br />
Vocational<br />
education 2 Alternative 3 Charter 4 Magnet 5<br />
Total 6 49,212,031 48,291,063 191,677 164,074 565,217 1,789,496 2,057,769<br />
Race/ethnicity<br />
Number<br />
White 25,801,021 25,448,326 87,226 70,795 194,674 647,735 686,555<br />
Black 7,873,809 7,641,434 50,859 41,125 140,391 516,703 653,158<br />
Hispanic 11,367,157 11,099,087 40,318 38,685 189,067 489,462 534,799<br />
Asian 2,281,908 2,247,723 7,066 10,507 16,612 58,239 115,958<br />
Pacific Isl<strong>and</strong>er 169,678 166,747 441 161 2,329 8,421 4,630<br />
American Indian/Alaska Native 561,126 547,609 2,005 855 10,657 16,963 12,020<br />
Two or more races 1,157,332 1,140,137 3,762 1,946 11,487 51,973 50,649<br />
Race/ethnicity by sex<br />
Male 25,277,620 24,746,160 123,956 89,387 318,117 886,502 1,026,397<br />
White 13,316,510 13,109,690 56,251 41,128 109,441 324,541 347,997<br />
Black 4,016,659 3,881,909 33,411 20,586 80,753 254,564 317,991<br />
Hispanic 5,822,182 5,670,336 25,845 20,281 105,720 240,852 268,992<br />
Asian 1,163,246 1,143,814 4,437 5,876 9,119 28,723 58,388<br />
Pacific Isl<strong>and</strong>er 87,657 86,022 281 87 1,267 4,282 2,297<br />
American Indian/Alaska Native 287,382 280,063 1,297 449 5,573 8,438 6,033<br />
Two or more races 583,984 574,326 2,434 980 6,244 25,102 24,699<br />
Female 23,934,411 23,544,903 67,721 74,687 247,100 902,994 1,031,372<br />
White 12,484,511 12,338,636 30,975 29,667 85,233 323,194 338,558<br />
Black 3,857,150 3,759,525 17,448 20,539 59,638 262,139 335,167<br />
Hispanic 5,544,975 5,428,751 14,473 18,404 83,347 248,610 265,807<br />
Asian 1,118,662 1,103,909 2,629 4,631 7,493 29,516 57,570<br />
Pacific Isl<strong>and</strong>er 82,021 80,725 160 74 1,062 4,139 2,333<br />
American Indian/Alaska Native 273,744 267,546 708 406 5,084 8,525 5,987<br />
Two or more races 573,348 565,811 1,328 966 5,243 26,871 25,950<br />
See notes at end of table.<br />
40 <strong>Higher</strong> <strong>Education</strong>: <strong>Gaps</strong> <strong>in</strong> <strong>Access</strong> <strong>and</strong> <strong>Persistence</strong> <strong>Study</strong>
Table 8-1.<br />
Number <strong>and</strong> percentage distribution of students <strong>in</strong> public elementary <strong>and</strong> secondary schools, by school<br />
type, race/ethnicity, <strong>and</strong> sex: School year 2010–11—Cont<strong>in</strong>ued<br />
Race/ethnicity <strong>and</strong> sex Total Regular<br />
Special<br />
education 1<br />
Vocational<br />
education 2 Alternative 3 Charter 4 Magnet 5<br />
Percent of total<br />
Total 6 100.0 98.1 0.4 0.3 1.1 3.6 4.2<br />
Race/ethnicity<br />
White 100.0 98.6 0.3 0.3 0.8 2.5 2.7<br />
Black 100.0 97.0 0.6 0.5 1.8 6.6 8.3<br />
Hispanic 100.0 97.6 0.4 0.3 1.7 4.3 4.7<br />
Asian 100.0 98.5 0.3 0.5 0.7 2.6 5.1<br />
Pacific Isl<strong>and</strong>er 100.0 98.3 0.3 0.1 1.4 5.0 2.7<br />
American Indian/Alaska Native 100.0 97.6 0.4 0.2 1.9 3.0 2.1<br />
Two or more races 100.0 98.5 0.3 0.2 1.0 4.5 4.4<br />
Race/ethnicity by sex<br />
Male 100.0 97.9 0.5 0.4 1.3 3.5 4.1<br />
White 100.0 98.4 0.4 0.3 0.8 2.4 2.6<br />
Black 100.0 96.6 0.8 0.5 2.0 6.3 7.9<br />
Hispanic 100.0 97.4 0.4 0.3 1.8 4.1 4.6<br />
Asian 100.0 98.3 0.4 0.5 0.8 2.5 5.0<br />
Pacific Isl<strong>and</strong>er 100.0 98.1 0.3 0.1 1.4 4.9 2.6<br />
American Indian/Alaska Native 100.0 97.5 0.5 0.2 1.9 2.9 2.1<br />
Two or more races 100.0 98.3 0.4 0.2 1.1 4.3 4.2<br />
8<br />
School Characteristics<br />
2<br />
Female 100.0 98.4 0.3 0.3 1.0 3.8 4.3<br />
White 100.0 98.8 0.2 0.2 0.7 2.6 2.7<br />
Black 100.0 97.5 0.5 0.5 1.5 6.8 8.7<br />
Hispanic 100.0 97.9 0.3 0.3 1.5 4.5 4.8<br />
Asian 100.0 98.7 0.2 0.4 0.7 2.6 5.1<br />
Pacific Isl<strong>and</strong>er 100.0 98.4 0.2 0.1 1.3 5.0 2.8<br />
American Indian/Alaska Native 100.0 97.7 0.3 0.1 1.9 3.1 2.2<br />
Two or more races 100.0 98.7 0.2 0.2 0.9 4.7 4.5<br />
1<br />
A public elementary/secondary school that focuses primarily on special education—<strong>in</strong>clud<strong>in</strong>g <strong>in</strong>struction for students with various conditions—<strong>and</strong><br />
that adapts curriculum, materials, or <strong>in</strong>struction for students served.<br />
2<br />
A public elementary/secondary school that focuses primarily on provid<strong>in</strong>g formal preparation for semiskilled, skilled, technical, or professional<br />
occupations for high-school-age students who have opted to develop or exp<strong>and</strong> their employment opportunities, often <strong>in</strong> lieu of prepar<strong>in</strong>g for college<br />
entry.<br />
3<br />
A public elementary/secondary school that (1) addresses needs of students that typically cannot be met <strong>in</strong> a regular school, (2) provides<br />
nontraditional education, (3) serves as an adjunct to a regular school, or (4) falls outside the categories of regular, special education, or vocational<br />
education.<br />
4<br />
A school provid<strong>in</strong>g free public elementary <strong>and</strong>/or secondary education to eligible students under a specific charter granted by an appropriate<br />
authority <strong>and</strong> designated by such authority to be a charter school.<br />
5<br />
A special school or program designed to attract students of different racial/ethnic backgrounds for the purpose of reduc<strong>in</strong>g, prevent<strong>in</strong>g, or<br />
elim<strong>in</strong>at<strong>in</strong>g racial isolation or to provide an academic or social focus on a particular theme, or both.<br />
6<br />
Total <strong>in</strong>cludes other racial/ethnic groups not shown separately <strong>in</strong> the table.<br />
NOTE: Excludes schools for which enrollment data by race/ethnicity <strong>and</strong> sex were not available. Regular, special education, vocational education, <strong>and</strong><br />
alternative school categories are mutually exclusive, whereas charter <strong>and</strong> magnet schools can also be categorized as one of these types of schools.<br />
Detail may not sum to totals because of round<strong>in</strong>g. Race categories exclude persons of Hispanic ethnicity.<br />
SOURCE: U.S. Department of <strong>Education</strong>, National Center for <strong>Education</strong> Statistics, Common Core of Data (CCD), “Public Elementary/Secondary School<br />
Universe Survey,” 2010–11.<br />
Characteristics of Schools 41
Table 8-2.<br />
Number <strong>and</strong> percentage distribution of students <strong>in</strong> public elementary <strong>and</strong> secondary schools end<strong>in</strong>g<br />
<strong>in</strong> grade 12, by school type, race/ethnicity, <strong>and</strong> sex: School year 2010–11<br />
Race/ethnicity <strong>and</strong> sex Total Regular<br />
Special<br />
education 1<br />
Vocational<br />
education 2 Alternative 3 Charter 4 Magnet 5<br />
Total 6 15,443,133 14,704,134 113,411 159,487 466,101 744,761 957,689<br />
Race/ethnicity<br />
Number<br />
White 8,517,520 8,232,382 49,774 69,250 166,114 319,752 312,882<br />
Black 2,503,668 2,331,058 29,867 39,080 103,663 166,800 299,902<br />
Hispanic 3,176,731 2,949,265 25,776 38,103 163,587 202,018 256,453<br />
Asian 717,083 690,066 4,403 10,193 12,421 22,296 61,160<br />
Pacific Isl<strong>and</strong>er 51,339 48,935 293 147 1,964 3,448 2,330<br />
American Indian/Alaska Native 186,884 175,570 1,248 843 9,223 8,540 5,132<br />
Two or more races 289,908 276,858 2,050 1,871 9,129 21,907 19,830<br />
Race/ethnicity by sex<br />
Male 7,900,786 7,473,997 75,125 87,064 264,600 364,138 473,056<br />
White 4,374,574 4,207,263 33,002 40,369 93,940 158,354 157,469<br />
Black 1,265,572 1,164,931 20,232 19,510 60,899 80,683 142,956<br />
Hispanic 1,625,801 1,497,382 16,675 19,987 91,757 97,684 128,361<br />
Asian 368,893 353,286 2,831 5,731 7,045 11,029 30,963<br />
Pacific Isl<strong>and</strong>er 26,371 25,032 190 79 1,070 1,740 1,158<br />
American Indian/Alaska Native 95,966 89,833 830 443 4,860 4,235 2,608<br />
Two or more races 143,609 136,270 1,365 945 5,029 10,413 9,541<br />
Female 7,542,347 7,230,137 38,286 72,423 201,501 380,623 484,633<br />
White 4,142,946 4,025,119 16,772 28,881 72,174 161,398 155,413<br />
Black 1,238,096 1,166,127 9,635 19,570 42,764 86,117 156,946<br />
Hispanic 1,550,930 1,451,883 9,101 18,116 71,830 104,334 128,092<br />
Asian 348,190 336,780 1,572 4,462 5,376 11,267 30,197<br />
Pacific Isl<strong>and</strong>er 24,968 23,903 103 68 894 1,708 1,172<br />
American Indian/Alaska Native 90,918 85,737 418 400 4,363 4,305 2,524<br />
Two or more races 146,299 140,588 685 926 4,100 11,494 10,289<br />
See notes at end of table.<br />
42 <strong>Higher</strong> <strong>Education</strong>: <strong>Gaps</strong> <strong>in</strong> <strong>Access</strong> <strong>and</strong> <strong>Persistence</strong> <strong>Study</strong>
Table 8-2.<br />
Number <strong>and</strong> percentage distribution of students <strong>in</strong> public elementary <strong>and</strong> secondary schools end<strong>in</strong>g<br />
<strong>in</strong> grade 12, by school type, race/ethnicity, <strong>and</strong> sex: School year 2010–11—Cont<strong>in</strong>ued<br />
Race/ethnicity <strong>and</strong> sex Total Regular<br />
Special<br />
education 1<br />
Vocational<br />
education 2 Alternative 3 Charter 4 Magnet 5<br />
Percent of total<br />
Total 6 100.0 95.2 0.7 1.0 3.0 4.8 6.2<br />
Race/ethnicity<br />
White 100.0 96.7 0.6 0.8 2.0 3.8 3.7<br />
Black 100.0 93.1 1.2 1.6 4.1 6.7 12.0<br />
Hispanic 100.0 92.8 0.8 1.2 5.1 6.4 8.1<br />
Asian 100.0 96.2 0.6 1.4 1.7 3.1 8.5<br />
Pacific Isl<strong>and</strong>er 100.0 95.3 0.6 0.3 3.8 6.7 4.5<br />
American Indian/Alaska Native 100.0 93.9 0.7 0.5 4.9 4.6 2.7<br />
Two or more races 100.0 95.5 0.7 0.6 3.1 7.6 6.8<br />
Race/ethnicity by sex<br />
Male 100.0 94.6 1.0 1.1 3.3 4.6 6.0<br />
White 100.0 96.2 0.8 0.9 2.1 3.6 3.6<br />
Black 100.0 92.0 1.6 1.5 4.8 6.4 11.3<br />
Hispanic 100.0 92.1 1.0 1.2 5.6 6.0 7.9<br />
Asian 100.0 95.8 0.8 1.6 1.9 3.0 8.4<br />
Pacific Isl<strong>and</strong>er 100.0 94.9 0.7 0.3 4.1 6.6 4.4<br />
American Indian/Alaska Native 100.0 93.6 0.9 0.5 5.1 4.4 2.7<br />
Two or more races 100.0 94.9 1.0 0.7 3.5 7.3 6.6<br />
8<br />
School Characteristics<br />
2<br />
Female 100.0 95.9 0.5 1.0 2.7 5.0 6.4<br />
White 100.0 97.2 0.4 0.7 1.7 3.9 3.8<br />
Black 100.0 94.2 0.8 1.6 3.5 7.0 12.7<br />
Hispanic 100.0 93.6 0.6 1.2 4.6 6.7 8.3<br />
Asian 100.0 96.7 0.5 1.3 1.5 3.2 8.7<br />
Pacific Isl<strong>and</strong>er 100.0 95.7 0.4 0.3 3.6 6.8 4.7<br />
American Indian/Alaska Native 100.0 94.3 0.5 0.4 4.8 4.7 2.8<br />
Two or more races 100.0 96.1 0.5 0.6 2.8 7.9 7.0<br />
1<br />
A public elementary/secondary school that focuses primarily on special education—<strong>in</strong>clud<strong>in</strong>g <strong>in</strong>struction for students with various conditions—<strong>and</strong><br />
that adapts curriculum, materials, or <strong>in</strong>struction for students served.<br />
2<br />
A public elementary/secondary school that focuses primarily on provid<strong>in</strong>g formal preparation for semiskilled, skilled, technical, or professional<br />
occupations for high-school-age students who have opted to develop or exp<strong>and</strong> their employment opportunities, often <strong>in</strong> lieu of prepar<strong>in</strong>g for college<br />
entry.<br />
3<br />
A public elementary/secondary school that (1) addresses needs of students that typically cannot be met <strong>in</strong> a regular school, (2) provides<br />
nontraditional education, (3) serves as an adjunct to a regular school, or (4) falls outside the categories of regular, special education, or vocational<br />
education.<br />
4<br />
A school provid<strong>in</strong>g free public elementary <strong>and</strong>/or secondary education to eligible students under a specific charter granted by an appropriate<br />
authority <strong>and</strong> designated by such authority to be a charter school.<br />
5<br />
A special school or program designed to attract students of different racial/ethnic backgrounds for the purpose of reduc<strong>in</strong>g, prevent<strong>in</strong>g, or<br />
elim<strong>in</strong>at<strong>in</strong>g racial isolation, or to provide an academic or social focus on a particular theme, or both.<br />
6<br />
Total <strong>in</strong>cludes other racial/ethnic groups not shown separately <strong>in</strong> the table.<br />
NOTE: Excludes schools for which enrollment data by race/ethnicity <strong>and</strong> sex were not available. May <strong>in</strong>clude both secondary schools <strong>and</strong> schools that<br />
offer both primary <strong>and</strong> secondary grades, as long as the last grade is grade 12. Regular, special education, vocational education, <strong>and</strong> alternative<br />
school categories are mutually exclusive, whereas charter <strong>and</strong> magnet schools can also be categorized as one of these types of schools. Detail may<br />
not sum to totals because of round<strong>in</strong>g. Race categories exclude persons of Hispanic ethnicity.<br />
SOURCE: U.S. Department of <strong>Education</strong>, National Center for <strong>Education</strong> Statistics, Common Core of Data (CCD), “Public Elementary/Secondary School<br />
Universe Survey,” 2010–11.<br />
Characteristics of Schools 43
Indicator 9<br />
Advanced Coursework Offer<strong>in</strong>gs<br />
A higher percentage of 2009 Asian/Pacific Isl<strong>and</strong>er high school graduates than<br />
their White, Black, <strong>and</strong> American Indian/Alaska Native peers attended schools that<br />
offered at least one AP or IB course; this percentage was also higher for Hispanics<br />
than for Whites. No measurable differences <strong>in</strong> AP or IB mathematics or science<br />
course availability were found between males <strong>and</strong> females either overall or by<br />
race/ethnicity.<br />
Some 92 percent of 2009 high school graduates attended<br />
schools that offered at least one AP or IB course. No<br />
measurable differences were found between males <strong>and</strong><br />
females (overall or among the specific racial/ethnic<br />
groups) <strong>in</strong> the percentage of graduates <strong>in</strong> schools that<br />
offered at least one AP or IB course. A higher percentage<br />
of Asian/Pacific Isl<strong>and</strong>er graduates attended a school that<br />
offered at least one AP or IB course (98 percent) than<br />
did their White (91 percent), Black (94 percent), <strong>and</strong><br />
American Indian/Alaska Native peers (90 percent). The<br />
percentage attend<strong>in</strong>g such a school was also higher for<br />
Hispanic graduates (96 percent) than for White graduates.<br />
These overall patterns by race/ethnicity were generally<br />
similar to those for males <strong>and</strong> females.<br />
A majority of high school graduates attended schools with<br />
at least two AP or IB course offer<strong>in</strong>gs <strong>in</strong> specific subject<br />
areas, <strong>in</strong>clud<strong>in</strong>g social studies (74 percent), science<br />
(71 percent), English (65 percent), <strong>and</strong> mathematics<br />
(61 percent); the percentages of graduates hav<strong>in</strong>g access<br />
to two or more AP or IB courses <strong>in</strong> foreign language <strong>and</strong><br />
all other subjects were 52 <strong>and</strong> 48 percent, respectively.<br />
No measurable differences were found between male <strong>and</strong><br />
female graduates (overall or among the specific racial/<br />
ethnic groups) <strong>in</strong> the percentage with access to two or<br />
more AP or IB courses <strong>in</strong> mathematics or science.<br />
<strong>Higher</strong> percentages of 2009 Asian/Pacific Isl<strong>and</strong>er <strong>and</strong><br />
Hispanic high school graduates attended schools that<br />
offered two or more AP or IB courses <strong>in</strong> mathematics<br />
than did their White <strong>and</strong> Black classmates (85 <strong>and</strong><br />
69 percent vs. 59 <strong>and</strong> 53 percent, respectively). This<br />
percentage was also higher for Asians/Pacific Isl<strong>and</strong>ers<br />
than for Hispanics <strong>and</strong> American Indians/Alaska Natives<br />
(62 percent). Additionally, the above patterns for AP<br />
or IB mathematics course availability by race/ethnicity<br />
held among female graduates. Among male high school<br />
graduates, the percentages with this level of access to AP<br />
or IB mathematics courses were higher for Asians/Pacific<br />
Isl<strong>and</strong>ers <strong>and</strong> Hispanics than for Whites <strong>and</strong> Blacks,<br />
Figure 9-1.<br />
Percentage distribution of high school graduates, by number of advanced placement (AP) or<br />
<strong>in</strong>ternational baccalaureate (IB) courses offered <strong>in</strong> school, race/ethnicity, <strong>and</strong> sex: 2009<br />
Race/ethnicity <strong>and</strong> sex<br />
Total 1<br />
White<br />
Black<br />
Hispanic<br />
Asian/<br />
Pacific<br />
Isl<strong>and</strong>er<br />
American<br />
Indian/<br />
Alaska Native<br />
Male<br />
Female<br />
Male<br />
Female<br />
Male<br />
Female<br />
Male<br />
Female<br />
Male<br />
Female<br />
Male<br />
Female<br />
8 92<br />
7 93<br />
9 91<br />
9 91<br />
7 93<br />
6 94<br />
4 96<br />
3 97<br />
1!<br />
99<br />
2 98<br />
11 ! 89<br />
9 ! 91<br />
0 20 40 60 80 100<br />
Percent<br />
No AP or IB courses offered<br />
At least one AP or IB course offered<br />
! Interpret data with caution. The coefficient of variation (CV) for this estimate is 30 percent or greater.<br />
1<br />
Total <strong>in</strong>cludes other racial/ethnic groups not shown separately <strong>in</strong> the figure.<br />
NOTE: Race categories exclude persons of Hispanic ethnicity.<br />
SOURCE: U.S. Department of <strong>Education</strong>, National Center for <strong>Education</strong> Statistics, National Assessment of <strong>Education</strong>al Progress (NAEP), High School Transcript<br />
<strong>Study</strong> (HSTS), 2009.<br />
44 <strong>Higher</strong> <strong>Education</strong>: <strong>Gaps</strong> <strong>in</strong> <strong>Access</strong> <strong>and</strong> <strong>Persistence</strong> <strong>Study</strong>
higher for Asians/Pacific Isl<strong>and</strong>ers than for Hispanics <strong>and</strong><br />
American Indians/Alaska Natives, <strong>and</strong> higher for Whites<br />
than Blacks.<br />
<strong>Higher</strong> percentages of 2009 Asian/Pacific Isl<strong>and</strong>er <strong>and</strong><br />
Hispanic high school graduates attended schools that<br />
offered two or more AP or IB courses <strong>in</strong> science than did<br />
their White <strong>and</strong> Black counterparts (82 <strong>and</strong> 80 percent vs.<br />
Technical Notes<br />
AP or IB mathematics courses <strong>in</strong>clude calculus (AB <strong>and</strong><br />
BC) <strong>and</strong> statistics. AP or IB science courses <strong>in</strong>clude those<br />
<strong>in</strong> biology, chemistry, physics, environmental science, <strong>and</strong><br />
design technology. Social studies courses <strong>in</strong>clude those<br />
AP or IB courses <strong>in</strong> psychology, economics, geography,<br />
government, politics, <strong>and</strong> history. Foreign language<br />
courses <strong>in</strong>clude any foreign language course designated<br />
as IB or for which AP test<strong>in</strong>g is offered. Other AP or IB<br />
courses <strong>in</strong>clude those <strong>in</strong> f<strong>in</strong>e arts, music, theater, <strong>and</strong><br />
computer science. Course catalogs conta<strong>in</strong>ed all of the<br />
courses that graduates could have taken <strong>in</strong> high school,<br />
69 <strong>and</strong> 65 percent, respectively). However, no measurable<br />
differences were found <strong>in</strong> the percentage of American<br />
Indians/Alaska Natives with this level of access to AP or<br />
IB science courses (66 percent) <strong>and</strong> those for their peers<br />
<strong>in</strong> any of the other racial/ethnic groups. These overall<br />
patterns of access to AP or IB science by race/ethnicity<br />
also held among males <strong>and</strong> females.<br />
<strong>in</strong>clud<strong>in</strong>g vocational, remedial, honors, special education,<br />
or off-campus courses, as well as courses taught <strong>in</strong> a<br />
language other than English. This <strong>in</strong>dicator presents<br />
<strong>in</strong>formation on Asians <strong>and</strong> Pacific Isl<strong>and</strong>ers as a comb<strong>in</strong>ed<br />
category because the data were collected <strong>in</strong> a manner that<br />
does not permit separate report<strong>in</strong>g. S<strong>in</strong>ce 96 percent of<br />
all Asian/Pacific Isl<strong>and</strong>er 5- to 24-year-olds are Asian,<br />
this comb<strong>in</strong>ed category substantially reflects the situation<br />
for Asians, rather than Pacific Isl<strong>and</strong>ers. For more<br />
<strong>in</strong>formation, please see the <strong>in</strong>troduction to this report.<br />
9<br />
School Characteristics<br />
2<br />
Characteristics of Schools 45
Figure 9-2.<br />
Percentage of high school graduates <strong>in</strong> schools that offered two or more advanced placement (AP) or<br />
<strong>in</strong>ternational baccalaureate (IB) courses <strong>in</strong> mathematics, by race/ethnicity <strong>and</strong> sex: 2009<br />
Percent<br />
100<br />
85 84<br />
80<br />
60<br />
61 62<br />
59 59<br />
50<br />
55<br />
68<br />
70<br />
64<br />
61<br />
40<br />
20<br />
0<br />
Total 1 White Black Hispanic Asian/Pacific<br />
Race/ethnicity<br />
Isl<strong>and</strong>er<br />
American Indian/<br />
Alaska Native<br />
Male<br />
Female<br />
1<br />
Total <strong>in</strong>cludes other racial/ethnic groups not shown separately <strong>in</strong> the figure.<br />
NOTE: Race categories exclude persons of Hispanic ethnicity.<br />
SOURCE: U.S. Department of <strong>Education</strong>, National Center for <strong>Education</strong> Statistics, National Assessment of <strong>Education</strong>al Progress (NAEP), High School Transcript<br />
<strong>Study</strong> (HSTS), 2009.<br />
Figure 9-3.<br />
Percentage of high school graduates <strong>in</strong> schools that offered two or more advanced placement (AP) or<br />
<strong>in</strong>ternational baccalaureate (IB) courses <strong>in</strong> science, by race/ethnicity <strong>and</strong> sex: 2009<br />
Percent<br />
100<br />
80<br />
60<br />
70 72<br />
69 69<br />
63<br />
68<br />
78<br />
82 82 82<br />
64<br />
67<br />
40<br />
20<br />
0<br />
Total 1 White Black Hispanic Asian/Pacific<br />
Race/ethnicity<br />
Isl<strong>and</strong>er<br />
American Indian/<br />
Alaska Native<br />
Male<br />
Female<br />
1<br />
Total <strong>in</strong>cludes other racial/ethnic groups not shown separately <strong>in</strong> the figure.<br />
NOTE: Race categories exclude persons of Hispanic ethnicity.<br />
SOURCE: U.S. Department of <strong>Education</strong>, National Center for <strong>Education</strong> Statistics, National Assessment of <strong>Education</strong>al Progress (NAEP), High School Transcript<br />
<strong>Study</strong> (HSTS), 2009.<br />
46 <strong>Higher</strong> <strong>Education</strong>: <strong>Gaps</strong> <strong>in</strong> <strong>Access</strong> <strong>and</strong> <strong>Persistence</strong> <strong>Study</strong>
Table 9-1.<br />
Sex <strong>and</strong> race/ethnicity<br />
Sex<br />
Percentage of high school graduates <strong>in</strong> schools offer<strong>in</strong>g advanced placement (AP) <strong>and</strong> <strong>in</strong>ternational<br />
baccalaureate (IB) courses, by subject, sex, <strong>and</strong> race/ethnicity: 2009<br />
No AP<br />
or IB<br />
courses<br />
offered<br />
Any course<br />
At least one course offered <strong>in</strong> an AP or IB subject 1<br />
Mathematics<br />
Science English<br />
Social<br />
studies<br />
Foreign<br />
language<br />
Other<br />
subjects<br />
Total 2 7.5 92.5 85.4 82.6 85.8 85.2 63.6 65.0<br />
Male 7.7 92.3 85.1 81.5 85.8 84.9 62.6 64.5<br />
Female 7.3 92.7 85.8 83.7 85.8 85.5 64.5 65.5<br />
Race/ethnicity<br />
White 9.4 90.6 83.4 80.9 82.2 81.8 57.9 62.1<br />
Black 6.2 93.8 82.5 80.1 90.0 86.2 58.7 60.5<br />
Hispanic 3.8 96.2 92.3 87.2 92.4 93.7 81.2 72.3<br />
Asian/Pacific Isl<strong>and</strong>er 1.5 98.5 95.6 93.4 95.8 96.5 87.9 85.3<br />
American Indian/Alaska Native 10.3 ! 89.7 81.2 78.3 78.5 72.9 49.2 54.9<br />
Two or more races — — — — — — — —<br />
Race/ethnicity by sex<br />
Male<br />
White 9.3 90.7 83.3 80.5 82.5 82.0 57.7 62.1<br />
Black 6.6 93.4 81.4 77.0 89.3 84.5 55.8 58.2<br />
Hispanic 4.5 95.5 91.7 85.0 91.8 93.5 79.0 71.5<br />
Asian/Pacific Isl<strong>and</strong>er 1.3 ! 98.7 95.5 92.8 96.6 96.8 87.8 85.0<br />
American Indian/Alaska Native 11.3 ! 88.7 81.8 77.3 79.3 72.2 50.4 54.6<br />
Two or more races — — — — — — — —<br />
9<br />
School Characteristics<br />
2<br />
Female<br />
White 9.4 90.6 83.4 81.4 81.9 81.7 58.1 62.2<br />
Black 5.9 94.1 83.5 82.8 90.5 87.6 61.2 62.6<br />
Hispanic 3.3 96.7 92.8 89.2 92.9 94.0 83.2 72.9<br />
Asian/Pacific Isl<strong>and</strong>er 1.7 98.3 95.7 94.0 95.1 96.2 88.0 85.6<br />
American Indian/Alaska Native 9.4 ! 90.6 80.7 79.1 77.8 73.5 48.3 55.2<br />
Two or more races — — — — — — — —<br />
— Not available.<br />
! Interpret data with caution. The coefficient of variation for this estimate is 30 percent or greater.<br />
1<br />
These columns <strong>in</strong>dicate the percentages of graduates <strong>in</strong> schools that offer at least one course <strong>in</strong> the designated AP or IB subject. For example,<br />
92.3 percent of male graduates attended a school that offered at least one AP or IB course <strong>in</strong> any subject.<br />
2<br />
Total <strong>in</strong>cludes other racial/ethnic groups not shown separately <strong>in</strong> the table.<br />
NOTE: AP or IB mathematics courses <strong>in</strong>clude calculus (AB <strong>and</strong> BC) <strong>and</strong> statistics. AP or IB science courses <strong>in</strong>clude those <strong>in</strong> biology, chemistry,<br />
physics, environmental science, <strong>and</strong> design technology. Social studies courses <strong>in</strong>clude those AP or IB courses <strong>in</strong> psychology, economics, geography,<br />
government, politics, <strong>and</strong> history. Foreign language courses <strong>in</strong>clude any foreign language course designated as IB or for which AP test<strong>in</strong>g is offered.<br />
Other AP or IB courses <strong>in</strong>clude those <strong>in</strong> f<strong>in</strong>e arts, music, theater, <strong>and</strong> computer science. Race categories exclude persons of Hispanic ethnicity.<br />
SOURCE: U.S. Department of <strong>Education</strong>, National Center for <strong>Education</strong> Statistics, National Assessment of <strong>Education</strong>al Progress (NAEP), High School<br />
Transcript <strong>Study</strong> (HSTS), 2009.<br />
Characteristics of Schools 47
48 <strong>Higher</strong> <strong>Education</strong>: <strong>Gaps</strong> <strong>in</strong> <strong>Access</strong> <strong>and</strong> <strong>Persistence</strong> <strong>Study</strong><br />
Table 9-2.<br />
Sex <strong>and</strong> race/ethnicity<br />
Sex<br />
Percentage distribution of high school graduates, by type <strong>and</strong> number of advanced placement (AP) or <strong>in</strong>ternational baccalaureate (IB) courses offered<br />
<strong>in</strong> school, average number of courses offered, sex, <strong>and</strong> race/ethnicity: 2009<br />
Mathematics 1 Science 1 English 1<br />
Number of AP or IB courses<br />
No course<br />
One<br />
course<br />
Two or<br />
more<br />
courses<br />
Average<br />
number<br />
of<br />
courses<br />
Number of AP or IB courses<br />
No course<br />
One<br />
course<br />
Two or<br />
more<br />
courses<br />
Average<br />
number<br />
of<br />
courses<br />
Number of AP or IB courses<br />
No course<br />
Total 2 14.6 24.0 61.5 1.9 17.4 11.4 71.2 3.1 14.2 20.3 65.5 1.6<br />
Male 14.9 24.1 61.0 1.9 18.5 11.2 70.4 3.0 14.2 20.8 65.0 1.6<br />
Female 14.2 23.8 62.0 1.9 16.3 11.6 72.1 3.1 14.2 19.9 65.9 1.6<br />
Race/ethnicity<br />
White 16.6 24.2 59.2 1.8 19.1 11.8 69.2 2.9 17.8 21.2 61.1 1.5<br />
Black 17.5 29.7 52.8 1.7 19.9 14.8 65.3 3.1 10.0 24.1 65.8 1.8<br />
Hispanic 7.7 23.2 69.1 2.1 12.8 6.8 80.4 3.6 7.6 13.2 79.2 1.8<br />
Asian/Pacific Isl<strong>and</strong>er 4.4 11.1 84.5 2.5 6.6 11.1 ! 82.3 3.6 4.2 21.6 74.2 1.9<br />
American Indian/Alaska Native 18.8 19.0 62.2 1.8 21.7 ! 12.2 ! 66.0 2.8 21.5 8.4 ! 70.1 1.6<br />
Two or more races — — — — — — — — — — — —<br />
One<br />
course<br />
Two or<br />
more<br />
courses<br />
Average<br />
number<br />
of<br />
courses<br />
Race/ethnicity by sex<br />
Male<br />
White 16.7 24.1 59.2 1.8 19.5 11.5 69.0 2.9 17.5 21.0 61.6 1.5<br />
Black 18.6 31.0 50.5 1.7 23.0 14.4 62.6 3.0 10.7 26.1 63.2 1.7<br />
Hispanic 8.3 23.9 67.8 2.1 15.0 6.7 78.3 3.5 8.2 14.4 77.4 1.8<br />
Asian/Pacific Isl<strong>and</strong>er 4.5 10.9 84.6 2.5 7.2 10.7 ! 82.1 3.6 3.4 22.6 74.0 1.9<br />
American Indian/Alaska Native 18.2 17.8 ! 64.0 1.8 ‡ 13.0 ! 64.3 2.8 20.7 6.8 ! 72.5 1.6<br />
Two or more races — — — — — — — — — — — —<br />
Female<br />
White 16.6 24.3 59.2 1.8 18.6 12.1 69.3 2.9 18.1 21.3 60.6 1.5<br />
Black 16.5 28.6 54.8 1.8 17.2 15.2 67.7 3.3 9.5 22.4 68.1 1.8<br />
Hispanic 7.2 22.6 70.2 2.1 10.8 6.9 82.3 3.7 7.1 12.1 80.7 1.9<br />
Asian/Pacific Isl<strong>and</strong>er 4.3 ! 11.3 84.5 2.5 6.0 11.5 ! 82.5 3.7 4.9 20.7 74.4 1.9<br />
American Indian/Alaska Native 19.3 19.9 60.8 1.8 20.9 ! 11.6 ! 67.5 2.9 22.2 9.8 ! 68.1 1.5<br />
Two or more races — — — — — — — — — — — —<br />
See notes at end of table.
Table 9-2.<br />
Sex <strong>and</strong> race/ethnicity<br />
Sex<br />
Percentage distribution of high school graduates, by type <strong>and</strong> number of advanced placement (AP) or <strong>in</strong>ternational baccalaureate (IB) courses offered<br />
<strong>in</strong> school, average number of courses offered, sex, <strong>and</strong> race/ethnicity: 2009—Cont<strong>in</strong>ued<br />
Social studies 1 Foreign language 1 Other subjects 1<br />
Number of AP or IB courses<br />
No course<br />
One<br />
course<br />
Two or<br />
more<br />
courses<br />
Average<br />
number<br />
of<br />
courses<br />
Number of AP or IB courses<br />
No course<br />
One<br />
course<br />
Two or<br />
more<br />
courses<br />
Average<br />
number<br />
of<br />
courses<br />
Number of AP or IB courses<br />
No course<br />
Total 2 14.8 11.1 74.2 4.2 36.4 11.5 52.1 3.0 35.0 17.0 47.9 2.8<br />
Male 15.1 11.0 74.0 4.2 37.4 11.1 51.5 2.9 35.5 16.7 47.8 2.7<br />
Female 14.5 11.2 74.3 4.3 35.5 11.9 52.6 3.0 34.5 17.4 48.1 2.8<br />
Race/ethnicity<br />
White 18.2 12.1 69.7 3.8 42.1 11.1 46.8 2.6 37.9 17.2 45.0 2.5<br />
Black 13.8 13.8 72.3 4.6 41.3 11.6 47.1 3.2 39.5 12.8 47.7 3.1<br />
Hispanic 6.3 7.5 86.3 5.2 18.8 14.2 67.0 3.9 27.7 17.0 55.2 3.5<br />
Asian/Pacific Isl<strong>and</strong>er 3.5 4.5 92.0 5.0 12.1 10.0 ! 77.9 4.0 14.7 26.3 59.0 3.3<br />
American Indian/Alaska Native 27.1 ! 6.2 ! 66.7 3.4 50.8 10.3 ! 38.9 1.9 45.1 16.4 ! 38.5 2.1<br />
Two or more races — — — — — — — — — — — —<br />
Race/ethnicity by sex<br />
Male<br />
White 18.0 11.9 70.0 3.8 42.3 10.7 47.0 2.6 37.9 16.7 45.4 2.5<br />
Black 15.5 13.7 70.8 4.4 44.2 11.5 44.2 3.0 41.8 13.2 44.9 2.9<br />
Hispanic 6.5 7.1 86.3 5.1 21.0 13.6 65.4 3.8 28.5 16.7 54.8 3.5<br />
Asian/Pacific Isl<strong>and</strong>er 3.2 5.0 91.9 4.9 12.2 9.7 ! 78.1 4.0 15.0 25.4 59.6 3.3<br />
American Indian/Alaska Native 27.8 ! ‡ 66.4 3.6 49.7 11.7 ! 38.7 2.0 45.4 ‡ 42.2 2.2<br />
Two or more races — — — — — — — — — — — —<br />
One<br />
course<br />
Two or<br />
more<br />
courses<br />
Average<br />
number<br />
of<br />
courses<br />
Characteristics of Schools 49<br />
Female<br />
White 18.3 12.2 69.5 3.8 41.9 11.4 46.7 2.6 37.8 17.7 44.5 2.5<br />
Black 12.4 13.9 73.7 4.8 38.8 11.6 49.6 3.4 37.4 12.5 50.1 3.2<br />
Hispanic 6.0 7.7 86.3 5.3 16.8 14.7 68.5 4.0 27.1 17.3 55.6 3.6<br />
Asian/Pacific Isl<strong>and</strong>er 3.8 4.0 92.2 5.0 12.0 10.4 ! 77.6 4.1 14.4 27.2 58.4 3.4<br />
American Indian/Alaska Native 26.5 ! 6.6 ! 66.9 3.2 51.7 9.1 ! 39.2 1.9 44.8 19.9 35.3 2.0<br />
Two or more races — — — — — — — — — — — —<br />
— Not available.<br />
! Interpret data with caution. The coefficient of variation for this estimate is 30 percent or greater.<br />
‡ Report<strong>in</strong>g st<strong>and</strong>ards not met. The coefficient of variation for this estimate is 50 percent or greater.<br />
1<br />
These columns <strong>in</strong>dicate the percentages of graduates <strong>in</strong> schools that offered different numbers of courses <strong>in</strong> the designated AP or IB subject. For example, 24.1 percent of male graduates attended schools that<br />
offered one AP or IB mathematics course <strong>and</strong> 61.0 percent of males attended schools that offered two or more AP or IB mathematics courses; <strong>in</strong> addition, for males, the average number of AP or IB mathematics<br />
courses offered <strong>in</strong> their schools was 1.9.<br />
2<br />
Total <strong>in</strong>cludes other racial/ethnic groups not shown separately <strong>in</strong> the table.<br />
NOTE: AP or IB mathematics courses <strong>in</strong>clude calculus (AB <strong>and</strong> BC) <strong>and</strong> statistics. AP or IB science courses <strong>in</strong>clude those <strong>in</strong> biology, chemistry, physics, environmental science, <strong>and</strong> design technology. Social studies<br />
courses <strong>in</strong>clude those AP or IB courses <strong>in</strong> psychology, economics, geography, government, politics, <strong>and</strong> history. Foreign language courses <strong>in</strong>clude any foreign language course designated as IB or for which AP<br />
test<strong>in</strong>g is offered. Other AP or IB courses <strong>in</strong>clude those <strong>in</strong> f<strong>in</strong>e arts, music, theater, <strong>and</strong> computer science. Race categories exclude persons of Hispanic ethnicity.<br />
SOURCE: U.S. Department of <strong>Education</strong>, National Center for <strong>Education</strong> Statistics, National Assessment of <strong>Education</strong>al Progress (NAEP), High School Transcript <strong>Study</strong> (HSTS), 2009.<br />
2<br />
School Characteristics<br />
9
Indicator 10<br />
High School Guidance Counsel<strong>in</strong>g<br />
In 2009, a higher percentage of Asian 9th-graders (60 percent) than Black<br />
(44 percent), Hispanic (41 percent), <strong>and</strong> American Indian/Alaska Native 9thgraders<br />
(29 percent) had school counselors who reported that their school’s<br />
primary counsel<strong>in</strong>g program goal was help<strong>in</strong>g students plan <strong>and</strong> prepare for<br />
postsecondary education.<br />
In 2009, school counselors of a nationally representative<br />
sample of 9th-graders reported on the primary goals<br />
of their school counsel<strong>in</strong>g programs. About 48 percent<br />
of 9th-graders had counselors who reported that the<br />
counsel<strong>in</strong>g program’s primary goal was help<strong>in</strong>g students<br />
plan <strong>and</strong> prepare for postsecondary education, <strong>and</strong><br />
35 percent had counselors who reported that the primary<br />
goal was help<strong>in</strong>g students improve their achievement<br />
<strong>in</strong> high school. No measurable differences were found<br />
between male <strong>and</strong> female 9th-graders (overall or with<strong>in</strong><br />
racial/ethnic groups) for either of the primary counsel<strong>in</strong>g<br />
goals.<br />
A higher percentage of Asian 9th-graders (60 percent)<br />
than Black (44 percent), Hispanic (41 percent), <strong>and</strong><br />
American Indian/Alaska Native 9th-graders (29 percent)<br />
had counselors who reported <strong>in</strong> 2009 that the primary<br />
counsel<strong>in</strong>g program goal was help<strong>in</strong>g students plan<br />
<strong>and</strong> prepare for postsecondary education. Among male<br />
9th-graders, higher percentages of Asians (56 percent) <strong>and</strong><br />
Whites (51 percent) than Hispanics (38 percent) attended<br />
schools <strong>in</strong> which the counsel<strong>in</strong>g program’s primary<br />
goal was postsecondary plann<strong>in</strong>g <strong>and</strong> preparation. For<br />
females, a higher percentage of Asian than Hispanic<br />
9th-graders (64 vs. 44 percent) attended schools <strong>in</strong> which<br />
the counsel<strong>in</strong>g program’s primary goal was postsecondary<br />
plann<strong>in</strong>g <strong>and</strong> preparation.<br />
The percentage of 9th-graders whose counselors reported<br />
<strong>in</strong> 2009 that the primary counsel<strong>in</strong>g program goal was<br />
help<strong>in</strong>g students improve their achievement <strong>in</strong> high school<br />
was higher for Hispanics (45 percent) than for students<br />
of two or more races (34 percent), Asians (30 percent),<br />
Whites (30 percent), <strong>and</strong> American Indians/Alaska<br />
Natives (23 percent). Similar racial/ethnic patterns were<br />
also observed for male 9th-graders. For females, a higher<br />
percentage of Hispanic 9th-graders (42 percent) than<br />
White (30 percent) <strong>and</strong> Asian (27 percent) 9th-graders<br />
attended schools <strong>in</strong> which the counsel<strong>in</strong>g program’s<br />
primary goal was improv<strong>in</strong>g students’ high school<br />
achievement.<br />
50 <strong>Higher</strong> <strong>Education</strong>: <strong>Gaps</strong> <strong>in</strong> <strong>Access</strong> <strong>and</strong> <strong>Persistence</strong> <strong>Study</strong>
Figure 10-1.<br />
Percentage of 9th-graders whose school counselors reported that the primary goal of the school<br />
counsel<strong>in</strong>g program was help<strong>in</strong>g students plan <strong>and</strong> prepare for postsecondary education, by race/<br />
ethnicity <strong>and</strong> sex: 2009<br />
10<br />
Percent<br />
100<br />
80<br />
60<br />
40<br />
20<br />
0<br />
64<br />
56<br />
47<br />
49<br />
51 51<br />
50 51<br />
46<br />
44<br />
40<br />
38<br />
Total 1 White Black Hispanic Asian Two or more races<br />
Race/ethnicity<br />
School Characteristics<br />
2<br />
Male<br />
Female<br />
1<br />
Total <strong>in</strong>cludes other racial/ethnic groups not shown separately <strong>in</strong> the figure.<br />
NOTE: Report<strong>in</strong>g st<strong>and</strong>ards for American Indian/Alaska Native females <strong>and</strong> Native Hawaiian/Pacific Isl<strong>and</strong>er males <strong>and</strong> females were not met; therefore,<br />
data for American Indians/Alaska Natives <strong>and</strong> Native Hawaiians/Pacific Isl<strong>and</strong>ers are not shown <strong>in</strong> the figure. Data weighted by W1STUDENT. Race categories<br />
exclude persons of Hispanic ethnicity.<br />
SOURCE: U.S. Department of <strong>Education</strong>, National Center for <strong>Education</strong> Statistics, High School Longitud<strong>in</strong>al <strong>Study</strong> of 2009, Base-Year Public-Use Data File.<br />
Figure 10-2.<br />
Percentage of 9th-graders whose school counselors reported that the primary goal of the school<br />
counsel<strong>in</strong>g program was help<strong>in</strong>g students improve their achievement <strong>in</strong> high school, by race/ethnicity<br />
<strong>and</strong> sex: 2009<br />
Percent<br />
100<br />
80<br />
60<br />
40<br />
36<br />
34<br />
30 30<br />
45<br />
41<br />
48<br />
42<br />
32<br />
27<br />
35<br />
33<br />
20<br />
0<br />
Total 1 White Black Hispanic Asian Two or more races<br />
Race/ethnicity<br />
Male<br />
Female<br />
1<br />
Total <strong>in</strong>cludes other racial/ethnic groups not shown separately <strong>in</strong> the figure.<br />
NOTE: Report<strong>in</strong>g st<strong>and</strong>ards for American Indian/Alaska Native females <strong>and</strong> Native Hawaiian/Pacific Isl<strong>and</strong>er males <strong>and</strong> females were not met; therefore,<br />
data for American Indians/Alaska Natives <strong>and</strong> Native Hawaiians/Pacific Isl<strong>and</strong>ers are not shown <strong>in</strong> the figure. Data weighted by W1STUDENT. Race categories<br />
exclude persons of Hispanic ethnicity.<br />
SOURCE: U.S. Department of <strong>Education</strong>, National Center for <strong>Education</strong> Statistics, High School Longitud<strong>in</strong>al <strong>Study</strong> of 2009, Base-Year Public-Use Data File.<br />
Characteristics of Schools 51
Table 10-1.<br />
Sex <strong>and</strong> race/ethnicity<br />
Sex<br />
Percentage of 9th-graders whose school counselors reported selected factors as the primary goal of the<br />
school counsel<strong>in</strong>g program, by sex <strong>and</strong> race/ethnicity: 2009<br />
Help<strong>in</strong>g students<br />
plan <strong>and</strong> prepare<br />
for postsecondary<br />
education<br />
Help<strong>in</strong>g students<br />
improve their<br />
achievement <strong>in</strong> high<br />
school<br />
Total 48.1 35.4<br />
Male 46.9 36.4<br />
Female 49.3 34.3<br />
Race/ethnicity<br />
White 51.3 30.0<br />
Black 43.7 43.0<br />
Hispanic 41.2 45.0<br />
Asian 60.2 29.7<br />
Native Hawaiian/Pacific Isl<strong>and</strong>er ‡ ‡<br />
American Indian/Alaska Native 29.1 ! 23.3 !<br />
Two or more races 50.2 34.0<br />
Race/ethnicity by sex<br />
Male<br />
White 51.2 29.9<br />
Black 40.5 45.1<br />
Hispanic 38.4 48.1<br />
Asian 56.4 32.1<br />
Native Hawaiian/Pacific Isl<strong>and</strong>er ‡ ‡<br />
American Indian/Alaska Native 33.9 ! 24.2 !<br />
Two or more races 49.7 35.0<br />
Female<br />
White 51.3 30.1<br />
Black 46.5 41.1<br />
Hispanic 44.0 41.9<br />
Asian 64.1 27.2<br />
Native Hawaiian/Pacific Isl<strong>and</strong>er ‡ ‡<br />
American Indian/Alaska Native ‡ ‡<br />
Two or more races 50.7 33.0<br />
! Interpret data with caution. The coefficient of variation (CV) for this estimate is 30 percent or greater.<br />
‡ Report<strong>in</strong>g st<strong>and</strong>ards not met. Either there are too few cases or the coefficient of variation (CV) is 50 percent or greater.<br />
NOTE: Data weighted by W1STUDENT. Race categories exclude persons of Hispanic ethnicity.<br />
SOURCE: U.S. Department of <strong>Education</strong>, National Center for <strong>Education</strong> Statistics, High School Longitud<strong>in</strong>al <strong>Study</strong> of 2009, Base-Year Public-Use Data File.<br />
52 <strong>Higher</strong> <strong>Education</strong>: <strong>Gaps</strong> <strong>in</strong> <strong>Access</strong> <strong>and</strong> <strong>Persistence</strong> <strong>Study</strong>
10<br />
School Characteristics<br />
2<br />
This page <strong>in</strong>tentionally left blank.<br />
Characteristics of Schools 53
Chapter 3<br />
Student Behaviors <strong>and</strong> Afterschool Activities<br />
11. Retention, Suspension, <strong>and</strong> Expulsion................................................................................... 56<br />
12. Safety at School...................................................................................................................... 62<br />
13. Alcohol <strong>and</strong> Other Drug Use.................................................................................................. 66<br />
14. Homework............................................................................................................................... 70<br />
15. Part-Time Work......................................................................................................................... 74<br />
16. School-Sponsored <strong>and</strong> Non-School-Sponsored Activities.................................................... 78<br />
54 <strong>Higher</strong> <strong>Education</strong>: <strong>Gaps</strong> <strong>in</strong> <strong>Access</strong> <strong>and</strong> <strong>Persistence</strong> <strong>Study</strong>
Researchers have long studied the l<strong>in</strong>ks between educational outcomes <strong>and</strong> students’ behaviors <strong>and</strong> activities outside<br />
of school. Some of these behaviors <strong>and</strong> activities may support high student achievement <strong>and</strong> persistence, while other<br />
behaviors <strong>and</strong> activities have been associated with negative outcomes. Chapter 3 explores the prevalence of specific<br />
behaviors <strong>and</strong> activities among males <strong>and</strong> females of various racial/ethnic groups.<br />
Some student activities, such as complet<strong>in</strong>g homework <strong>and</strong> participat<strong>in</strong>g <strong>in</strong> school-sponsored activities, have been<br />
l<strong>in</strong>ked to higher student achievement, graduation rates, <strong>and</strong> postsecondary outcomes. Research has generally <strong>in</strong>dicated<br />
a positive relationship between educational outcomes <strong>and</strong> homework completion, although the strength of the<br />
relationship varies by grade level <strong>and</strong> the frequency of <strong>and</strong> amount of time allocated to homework (Cooper, Rob<strong>in</strong>son,<br />
<strong>and</strong> Patall 2006). Many educators <strong>and</strong> policymakers see benefits of homework beyond improved test scores <strong>and</strong><br />
advocate its assignment to students <strong>in</strong> all grades. For example, homework may be used to re<strong>in</strong>force learn<strong>in</strong>g by giv<strong>in</strong>g<br />
students the opportunity to practice material presented <strong>in</strong> class or to prepare for new material. It can also be used for<br />
non<strong>in</strong>structional purposes to promote parent-child <strong>in</strong>teraction or facilitate parent-teacher communication (Epste<strong>in</strong> <strong>and</strong><br />
Van Voorhis 2001).<br />
Research has also <strong>in</strong>dicated positive relationships between academic <strong>in</strong>dicators <strong>and</strong> student participation <strong>in</strong> schoolsponsored<br />
extracurricular activities. Almost every high school <strong>in</strong> the United States offers some type of extracurricular<br />
activity, such as music, academic clubs, <strong>and</strong> sports. Some extracurricular activities re<strong>in</strong>force lessons learned <strong>in</strong> the<br />
classroom, offer<strong>in</strong>g students the opportunity to apply academic skills <strong>in</strong> a real-world context. Other activities offer<br />
opportunities for students to learn the values of teamwork, <strong>in</strong>dividual <strong>and</strong> group responsibility, perseverance,<br />
competition, <strong>and</strong> diversity <strong>and</strong> to ga<strong>in</strong> a sense of culture <strong>and</strong> community. Research suggests that participation <strong>in</strong><br />
extracurricular activities may also <strong>in</strong>crease students’ sense of engagement or attachment to their school, decreas<strong>in</strong>g the<br />
likelihood of school failure <strong>and</strong> dropp<strong>in</strong>g out (Broh 2002; F<strong>in</strong>n 1993; Jordan 1999; Jordan <strong>and</strong> Nettles 1999; Lamborn<br />
et al. 1992). Other studies have shown that high school students engaged <strong>in</strong> extracurricular activities are more<br />
likely to experience higher literacy <strong>and</strong> other test scores, grade po<strong>in</strong>t averages, <strong>and</strong> postsecondary aspirations (Broh<br />
2002; Feldman <strong>and</strong> Matjasko 2007; Lipscomb 2007; Shulruf, Tumen, <strong>and</strong> Tolley 2008).<br />
Among the events <strong>and</strong> behaviors generally associated with poor educational outcomes for students are grade retention<br />
<strong>and</strong> school suspension or expulsion. Children are reta<strong>in</strong>ed <strong>in</strong> a grade if they do not exhibit the academic or social skills<br />
necessary to advance (e.g., gett<strong>in</strong>g along with others, follow<strong>in</strong>g directions, regulat<strong>in</strong>g emotions). These children may<br />
experience low academic achievement <strong>and</strong> motivation, <strong>and</strong> many may behave <strong>in</strong> ways that underm<strong>in</strong>e their efforts<br />
<strong>in</strong> school <strong>and</strong> their community (Jimerson 2001). Other research has confirmed that students suspended from<br />
school are at higher risk for other poor school outcomes, <strong>in</strong>clud<strong>in</strong>g dropp<strong>in</strong>g out of school (Ensm<strong>in</strong>ger <strong>and</strong> Slusarick<br />
1992; Grissom <strong>and</strong> Shepard 1989; Jimerson 1999; Jimerson, Anderson, <strong>and</strong> Whipple 2002; Jimerson, Ferguson,<br />
Whipple, Anderson, <strong>and</strong> Dalton 2002; Rumberger 1987; Rumberger 1995; S<strong>and</strong>oval <strong>and</strong> Fitzgerald 1985).<br />
Negative behaviors also <strong>in</strong>clude crime, victimization, <strong>and</strong> substance abuse. Victimization at school can have last<strong>in</strong>g<br />
effects: <strong>in</strong> addition to lonel<strong>in</strong>ess, depression, <strong>and</strong> adjustment difficulties (Crick <strong>and</strong> Bigbee 1998; Crick <strong>and</strong> Grotpeter<br />
1996; Nansel et al. 2001; Pr<strong>in</strong>ste<strong>in</strong>, Boergers, <strong>and</strong> Vernberg 2001; Storch et al. 2003), victimized children are more<br />
prone to truancy (R<strong>in</strong>gwalt, Ennett, <strong>and</strong> Johnson 2003), poor academic performance (MacMillan <strong>and</strong> Hagan<br />
2004; Wei <strong>and</strong> Williams 2004), dropp<strong>in</strong>g out of school (Beauvais et al. 1996; MacMillan <strong>and</strong> Hagan 2004), <strong>and</strong><br />
violent behaviors (Nansel et al. 2003). Students who use alcohol, cigarettes, <strong>and</strong> drugs such as marijuana are more likely<br />
than their peers to experience low academic achievement, truancy, <strong>and</strong> other discipl<strong>in</strong>e-related issues (Bryant et al.<br />
2003; Bryant <strong>and</strong> Zimmerman 2002).<br />
Students often seek part-time employment once they reach high school. While summer employment may not affect<br />
student achievement, some studies have shown negative effects (e.g., <strong>in</strong> terms of grades, st<strong>and</strong>ardized test scores, <strong>and</strong><br />
course selections) for students who work dur<strong>in</strong>g the school year (S<strong>in</strong>gh 1998; S<strong>in</strong>gh <strong>and</strong> Ozturk 2000). <strong>Higher</strong> grade<br />
po<strong>in</strong>t averages <strong>in</strong> elementary <strong>and</strong> middle school were correlated with fewer hours worked when students reached<br />
10th grade (S<strong>in</strong>gh 1998). Further, work<strong>in</strong>g part time was associated with students tak<strong>in</strong>g fewer mathematics <strong>and</strong><br />
science courses <strong>and</strong> demonstrat<strong>in</strong>g lower mathematics achievement overall (S<strong>in</strong>gh <strong>and</strong> Ozturk 2000).<br />
Student Behaviors <strong>and</strong> Afterschool Activities 55
Indicator 11<br />
Retention, Suspension, <strong>and</strong> Expulsion<br />
In 2009, a higher percentage of male than female 9th-grade students had ever<br />
been reta<strong>in</strong>ed <strong>in</strong> any grade (k<strong>in</strong>dergarten through 9). Also, compared with their<br />
female peers, higher percentages of White, Black, <strong>and</strong> Hispanic male 9th-grade<br />
students had ever been suspended or expelled. For example, 42 percent of Black<br />
males versus 24 percent of Black females had ever been suspended or expelled.<br />
In 2009, accord<strong>in</strong>g to parent reports, 13 percent of 9thgrade<br />
students had been reta<strong>in</strong>ed <strong>in</strong> any of grades from<br />
k<strong>in</strong>dergarten through 9. Three percent of 9th-grade<br />
students had ever had a lapse <strong>in</strong> school attendance (times<br />
when the child stopped go<strong>in</strong>g to school for a period of a<br />
month or more other than for illness, <strong>in</strong>jury or vacation)<br />
<strong>and</strong> 15 percent had ever been suspended or expelled. The<br />
percentage of 9th-grade students whose parents had ever<br />
been contacted by their school regard<strong>in</strong>g problem<br />
behavior at school was 27 percent. In addition, 19 percent<br />
of students had ever had their parents contacted regard<strong>in</strong>g<br />
poor attendance at school, <strong>and</strong> 27 percent had ever had<br />
their parents contacted about poor academic performance.<br />
A higher percentage of male than female 9th-grade<br />
students had ever been reta<strong>in</strong>ed <strong>in</strong> any grade by 2009<br />
(15 vs. 10 percent). This difference was also observed<br />
among White <strong>and</strong> Hispanic males <strong>and</strong> females (11 vs. 8<br />
percent <strong>and</strong> 20 vs. 10 percent, respectively), although no<br />
measurable differences by sex were found for the other<br />
racial/ethnic groups. The percentage of 9th-grade students<br />
who had ever been reta<strong>in</strong>ed was higher among students<br />
who were American Indian/Alaska Native (27 percent),<br />
Black (25 percent), <strong>and</strong> Hispanic (15 percent) than among<br />
their White (10 percent) <strong>and</strong> Asian peers (3 percent) <strong>and</strong><br />
their peers of two or more races (11 percent). In addition,<br />
the percentage of Blacks who had ever been reta<strong>in</strong>ed was<br />
higher than that for Hispanics <strong>and</strong> the percentages of<br />
Whites <strong>and</strong> students of two or more races were higher<br />
than that for Asians. Similar patterns by race/ethnicity<br />
were also found among both male <strong>and</strong> female students.<br />
In 2009, about 19 percent of 9th-grade males had ever<br />
been suspended or expelled, compared with 10 percent of<br />
9th-grade females. <strong>Higher</strong> percentages of White, Black,<br />
<strong>and</strong> Hispanic male students than female students had ever<br />
been suspended or expelled. For example, 42 percent of<br />
Black males versus 24 percent of Black females had ever<br />
been suspended or expelled, a difference of 18 percentage<br />
po<strong>in</strong>ts. Across racial/ethnic groups, suspension or<br />
expulsion percentages were higher among Black students<br />
(32 percent), American Indian/Alaska Native students<br />
(28 percent), <strong>and</strong> students of two or more races (23<br />
percent) than among their White (10 percent), Hispanic<br />
(15 percent), <strong>and</strong> Asian peers (6 percent). These<br />
percentages were also higher for Hispanic students than<br />
Figure 11-1. Percentage of 9th-grade students who had ever been reta<strong>in</strong>ed <strong>in</strong> any of grades k<strong>in</strong>dergarten through 9,<br />
by race/ethnicity <strong>and</strong> sex: 2009<br />
Percent<br />
60<br />
50<br />
40<br />
30<br />
20<br />
10<br />
0<br />
29<br />
21<br />
20<br />
15<br />
10<br />
11<br />
13<br />
10<br />
8<br />
9<br />
4!<br />
3!<br />
Total 1 White Black Hispanic Asian Two or more races<br />
Race/ethnicity<br />
Male<br />
Female<br />
! Interpret data with caution. The coefficient of variation (CV) is 30 percent or greater.<br />
1<br />
Total <strong>in</strong>cludes other racial/ethnic groups not shown separately <strong>in</strong> the figure.<br />
NOTE: Data are based on parent responses. Report<strong>in</strong>g st<strong>and</strong>ards for Native Hawaiian/Pacific Isl<strong>and</strong>er males <strong>and</strong> females <strong>and</strong> American Indian/Alaska Native<br />
females were not met; therefore, data for Native Hawaiian/Pacific Isl<strong>and</strong>er <strong>and</strong> American Indian/Alaska Native males <strong>and</strong> females are not shown <strong>in</strong> the<br />
figure. Data weighted by W1PARENT. Race categories exclude persons of Hispanic ethnicity.<br />
SOURCE: U.S. Department of <strong>Education</strong>, National Center for <strong>Education</strong> Statistics, High School Longitud<strong>in</strong>al <strong>Study</strong> of 2009, Base-Year Restricted-Use File.<br />
56 <strong>Higher</strong> <strong>Education</strong>: <strong>Gaps</strong> <strong>in</strong> <strong>Access</strong> <strong>and</strong> <strong>Persistence</strong> <strong>Study</strong>
Figure 11-2.<br />
Percent<br />
60<br />
Percentage of 9th-grade students who had ever been suspended or expelled, by race/ethnicity <strong>and</strong> sex:<br />
2009<br />
11<br />
50<br />
40<br />
42<br />
34<br />
30<br />
20<br />
10<br />
19<br />
10<br />
14<br />
5<br />
24<br />
19<br />
10<br />
21!<br />
27<br />
18<br />
0<br />
Total 1 White Black Hispanic American Indian/<br />
Alaska Native<br />
Race/ethnicity<br />
Two or more races<br />
Male<br />
Female<br />
! Interpret data with caution. The coefficient of variation (CV) is 30 percent or greater.<br />
1<br />
Total <strong>in</strong>cludes other racial/ethnic groups not shown separately <strong>in</strong> the figure.<br />
NOTE: Data are based on parent responses. Report<strong>in</strong>g st<strong>and</strong>ards for Asian females <strong>and</strong> Native Hawaiian/Pacific Isl<strong>and</strong>er males <strong>and</strong> females were not met;<br />
therefore, data for Asian <strong>and</strong> Native Hawaiian/Pacific Isl<strong>and</strong>er males <strong>and</strong> females are not shown <strong>in</strong> the figure. Data weighted by W1PARENT. Race categories<br />
exclude persons of Hispanic ethnicity.<br />
SOURCE: U.S. Department of <strong>Education</strong>, National Center for <strong>Education</strong> Statistics, High School Longitud<strong>in</strong>al <strong>Study</strong> of 2009, Base-Year Restricted-Use File.<br />
for White <strong>and</strong> Asian students. Similar patterns by race/<br />
ethnicity were also found among both male <strong>and</strong> female<br />
students.<br />
Thirty-five percent of 9th-grade male students’ parents<br />
had ever been contacted by their school about problem<br />
behavior at school, compared with 19 percent of their<br />
female peers. <strong>Higher</strong> percentages of males than females<br />
had reports of problem behavior at school <strong>in</strong> all racial/<br />
ethnic groups except for American Indian/Alaska<br />
Natives, for whom there was no measurable difference<br />
due to small sample sizes. For <strong>in</strong>stance, the percentage<br />
of Black males with reports of problem behavior was 58<br />
percent, compared with 37 percent for Black females. In<br />
terms of overall racial/ethnic differences, Black students<br />
had a higher percentage of reported problem behavior at<br />
school (46 percent) than did their White (20 percent),<br />
Hispanic (33 percent), <strong>and</strong> Asian (13 percent) peers as<br />
well as their peers of two or more races (32 percent).<br />
Additionally, higher percentages of Hispanic, American<br />
Indian/Alaska Native students (44 percent), <strong>and</strong> students<br />
of two or more races had parents who had been contacted<br />
Technical Notes<br />
Data are based on parent responses. The total percentage<br />
of students ever reta<strong>in</strong>ed <strong>in</strong> any grade (k<strong>in</strong>dergarten<br />
through 9) <strong>in</strong>cludes responses from parents who did not<br />
by the school about their problem behavior than did their<br />
White <strong>and</strong> Asian peers. Patterns among males <strong>and</strong> females<br />
by race/ethnicity were generally similar to the overall<br />
pattern.<br />
In 2009, a higher percentage of 9th-grade males than<br />
females had ever had a parent contacted about their poor<br />
academic performance (34 vs. 20 percent). This difference<br />
by sex was also found for Whites, Blacks, Hispanics, <strong>and</strong><br />
students of two or more races. For example, 45 percent<br />
of Black males had had a parent contacted about their<br />
poor academic performance, compared with 28 percent<br />
of their female counterparts. Regard<strong>in</strong>g overall racial/<br />
ethnic differences <strong>in</strong> parent contact for poor academic<br />
performance, the percentages were higher for Blacks<br />
(35 percent), Hispanics (29 percent), American Indian/<br />
Alaska Natives (50 percent), <strong>and</strong> students of two or more<br />
races (34 percent) than for Whites (23 percent) <strong>and</strong> Asians<br />
(11 percent). Racial/ethnic patterns of parent contact for<br />
poor academic performance for males <strong>and</strong> females were<br />
generally similar to the overall pattern by race/ethnicity.<br />
<strong>in</strong>dicate the specific grade(s) at which their child was<br />
reta<strong>in</strong>ed.<br />
Behaviors <strong>and</strong> Activities<br />
3<br />
Student Behaviors <strong>and</strong> Afterschool Activities 57
Table 11-1.<br />
Percentage of 9th-grade students who had ever been reta<strong>in</strong>ed <strong>in</strong> a grade, by grade level, sex, <strong>and</strong> race/<br />
ethnicity: 2009<br />
Ever reta<strong>in</strong>ed <strong>in</strong> any grade<br />
(k<strong>in</strong>dergarten through 9)<br />
Ever reta<strong>in</strong>ed <strong>in</strong> any of grades<br />
k<strong>in</strong>dergarten through 5<br />
Ever reta<strong>in</strong>ed <strong>in</strong> any of grades<br />
6 through 9<br />
Race/ethnicity Total Male Female Total Male Female Total Male Female<br />
Total 1 12.8 15.3 10.1 10.4 12.1 8.7 2.9 3.8 1.9<br />
White 9.5 11.3 7.6 7.7 8.9 6.4 2.1 2.9 1.4<br />
Black 24.7 28.7 21.4 19.7 21.5 18.2 6.3 8.7 4.4 !<br />
Hispanic 15.3 20.1 10.4 13.1 16.5 9.6 3.0 4.4 1.6 !<br />
Asian 3.3 3.9 ! 2.6 ! 3.1 3.8 ! 2.4 ! ‡ ‡ ‡<br />
Native Hawaiian/<br />
Pacific Isl<strong>and</strong>er ‡ ‡ ‡ ‡ ‡ ‡ ‡ ‡ ‡<br />
American Indian/<br />
Alaska Native 26.8 34.9 ‡ 19.9 ! 22.1 ! ‡ 7.4 ! 13.9 ! ‡<br />
Two or more races 11.1 12.8 9.4 8.7 10.3 7.2 2.6 2.7 ! 2.5 !<br />
! Interpret data with caution. The coefficient of variation (CV) for this estimate is 30 percent or greater.<br />
‡ Report<strong>in</strong>g st<strong>and</strong>ards not met. There are either too few cases or the coefficient of variation (CV) is 50 percent or greater.<br />
1<br />
Totals <strong>in</strong>clude other racial/ethnic groups not shown separately <strong>in</strong> the table.<br />
NOTE: Data are based on parent responses. Totals for “ever reta<strong>in</strong>ed <strong>in</strong> any grade (k<strong>in</strong>dergarten through 9)” <strong>in</strong>clude responses from parents who did not<br />
<strong>in</strong>dicate the specific grade(s) at which their child was reta<strong>in</strong>ed. Students reta<strong>in</strong>ed more than one time with<strong>in</strong> a specified grade range were only counted<br />
one time <strong>in</strong> the percentage calculations. Data weighted by W1PARENT. Race categories exclude persons of Hispanic ethnicity.<br />
SOURCE: U.S. Department of <strong>Education</strong>, National Center for <strong>Education</strong> Statistics, High School Longitud<strong>in</strong>al <strong>Study</strong> of 2009, Base-Year Restricted-Use File.<br />
58 <strong>Higher</strong> <strong>Education</strong>: <strong>Gaps</strong> <strong>in</strong> <strong>Access</strong> <strong>and</strong> <strong>Persistence</strong> <strong>Study</strong>
11<br />
This page <strong>in</strong>tentionally left blank.<br />
Behaviors <strong>and</strong> Activities<br />
3<br />
Student Behaviors <strong>and</strong> Afterschool Activities 59
60 <strong>Higher</strong> <strong>Education</strong>: <strong>Gaps</strong> <strong>in</strong> <strong>Access</strong> <strong>and</strong> <strong>Persistence</strong> <strong>Study</strong><br />
Table 11-2. Percentage of 9th-grade students who had ever experienced various discipl<strong>in</strong>e or attendance issues, by sex <strong>and</strong> race/ethnicity: 2009<br />
Had a lapse <strong>in</strong><br />
school attendance 1<br />
Child ever<br />
Been suspended<br />
or expelled<br />
Parent ever contacted by the school about child’s<br />
Problem behavior at school<br />
Sex <strong>and</strong> race/ethnicity<br />
Total 1–2 times 3–4 times More than 4 times<br />
Total 2 2.7 14.6 27.2 19.8 3.8 3.6<br />
Sex<br />
Male 3.1 19.5 35.1 24.7 5.1 5.3<br />
Female 2.3 9.7 19.1 14.8 2.5 1.8<br />
Race/ethnicity<br />
White 2.7 9.9 20.1 15.2 2.5 2.4<br />
Black 2.3 31.6 46.2 32.1 6.9 7.1<br />
Hispanic 2.6 14.5 33.1 23.9 4.9 4.3<br />
Asian 4.1 ! 5.9 ! 12.9 12.3 0.4 ! ‡<br />
Native Hawaiian/Pacific Isl<strong>and</strong>er ‡ ‡ ‡ ‡ ‡ ‡<br />
American Indian/Alaska Native ‡ 28.4 44.0 23.3 13.5 ! ‡<br />
Two or more races 1.5 22.7 32.3 21.6 5.2 5.4<br />
Race/ethnicity by sex<br />
Male<br />
White 2.8 14.3 27.0 19.9 3.5 3.5<br />
Black 3.1 41.7 58.0 36.1 9.7 12.2<br />
Hispanic 3.6 19.1 42.5 30.1 6.4 6.0<br />
Asian 3.2 ! 10.7 ! 19.9 19.2 ‡ ‡<br />
Native Hawaiian/Pacific Isl<strong>and</strong>er ‡ ‡ ‡ ‡ ‡ ‡<br />
American Indian/Alaska Native ‡ 34.4 51.3 22.5 21.6 ! ‡<br />
Two or more races 1.6 ! 27.0 42.7 27.9 6.4 8.3<br />
Female<br />
White 2.5 5.2 12.6 10.1 1.4 1.1<br />
Black 1.7 ! 23.5 36.6 28.8 4.7 3.0 !<br />
Hispanic 1.5 9.8 23.5 17.6 3.4 ! 2.6 !<br />
Asian 5.0 ! ‡ 5.9 5.4 ! ‡ ‡<br />
Native Hawaiian/Pacific Isl<strong>and</strong>er ‡ ‡ ‡ ‡ ‡ ‡<br />
American Indian/Alaska Native ‡ 21.1 ! 35.2 24.1 ! ‡ ‡<br />
Two or more races 1.4 ! 18.4 22.3 15.6 4.0 2.7 !<br />
See notes at end of table.
Table 11-2.<br />
Sex <strong>and</strong> race/ethnicity<br />
Sex<br />
Percentage of 9th-grade students who had ever experienced various discipl<strong>in</strong>e or attendance issues, by sex <strong>and</strong> race/ethnicity: 2009—Cont<strong>in</strong>ued<br />
Poor attendance at school<br />
Total 1–2 times 3–4 times<br />
Parent ever contacted by the school about child’s<br />
Poor academic performance<br />
More than 4<br />
times Total 1–2 times 3–4 times<br />
More than<br />
4 times<br />
Total 2 18.8 12.8 2.8 3.2 26.7 19.1 4.2 3.4<br />
Male 19.5 13.0 3.1 3.3 33.6 22.9 5.7 5.1<br />
Female 18.2 12.6 2.5 3.1 19.6 15.2 2.6 1.8<br />
Race/ethnicity<br />
White 12.8 8.7 1.7 2.4 23.5 17.1 3.5 2.9<br />
Black 22.2 14.7 4.2 3.3 35.5 24.6 6.9 4.0<br />
Hispanic 31.5 21.6 5.0 4.9 28.7 20.9 3.9 4.0<br />
Asian 9.1 7.6 ‡ 0.6 ! 10.7 7.7 ‡ ‡<br />
Native Hawaiian/Pacific Isl<strong>and</strong>er ‡ ‡ ‡ ‡ ‡ ‡ ‡ ‡<br />
American Indian/Alaska Native 43.0 25.0 ‡ 15.1 ! 50.0 26.2 ‡ 20.4<br />
Two or more races 20.1 13.5 2.7 3.9 33.7 22.8 6.2 4.7<br />
Race/ethnicity by sex<br />
Male<br />
White 13.4 8.7 1.9 2.7 30.3 21.4 5.0 4.0<br />
Black 25.1 15.1 5.5 4.4 45.0 27.8 9.6 7.6<br />
Hispanic 31.3 21.5 5.5 4.2 36.7 25.2 5.4 6.1<br />
Asian 10.4 9.2 ‡ ‡ 12.9 11.7 ! ‡ ‡<br />
Native Hawaiian/Pacific Isl<strong>and</strong>er ‡ ‡ ‡ ‡ ‡ ‡ ‡ ‡<br />
American Indian/Alaska Native 39.9 19.4 ! ‡ ‡ 51.2 16.8 ! ‡ 28.3 !<br />
Two or more races 20.9 15.5 2.5 ! 2.9 38.9 24.1 8.1 ! 6.7<br />
Student Behaviors <strong>and</strong> Afterschool Activities 61<br />
Female<br />
White 12.2 8.6 1.5 2.0 16.1 12.5 1.9 1.7<br />
Black 19.9 14.3 3.2 ! 2.5 ! 27.8 22.0 ‡ 1.1 !<br />
Hispanic 31.7 21.6 4.4 5.6 20.5 16.4 2.4 ! 1.8 !<br />
Asian 7.9 6.1 ! ‡ 1.1 ! 8.6 ! 3.7 ! ‡ ‡<br />
Native Hawaiian/Pacific Isl<strong>and</strong>er ‡ ‡ ‡ ‡ ‡ ‡ ‡ ‡<br />
American Indian/Alaska Native 46.8 31.9 ! ‡ ‡ 48.6 37.5 ! ‡ ‡<br />
Two or more races 19.3 11.7 2.9 ! 4.8 28.7 21.5 4.4 2.7 !<br />
! Interpret data with caution. The coefficient of variation (CV) for this estimate is 30 percent or greater.<br />
‡ Report<strong>in</strong>g st<strong>and</strong>ards not met. There are either too few cases or the coefficient of variation (CV) is 50 percent or greater.<br />
1<br />
Lapses <strong>in</strong> school attendance <strong>in</strong>clude times when the child stopped go<strong>in</strong>g to school for a period of a month or more other than for illness, <strong>in</strong>jury, or vacation.<br />
2<br />
Totals <strong>in</strong>clude other racial/ethnic groups not shown separately <strong>in</strong> the table.<br />
NOTE: Data are based on parent responses. Detail may not sum to totals because of round<strong>in</strong>g. Data weighted by W1PARENT. Race categories exclude persons of Hispanic ethnicity.<br />
SOURCE: U.S. Department of <strong>Education</strong>, National Center for <strong>Education</strong> Statistics, High School Longitud<strong>in</strong>al <strong>Study</strong> of 2009, Base-Year Restricted-Use File.<br />
3<br />
Behaviors <strong>and</strong> Activities<br />
11
Indicator 12<br />
Safety at School<br />
In 2009, a higher percentage of male than female students reported be<strong>in</strong>g<br />
threatened or <strong>in</strong>jured with a weapon on school property <strong>in</strong> the past 12 months (10<br />
vs. 5 percent). This pattern between males <strong>and</strong> females was also observed among<br />
White, Black, Hispanic, <strong>and</strong> Asian students as well as students of two or more races.<br />
In 2009, some 8 percent of students <strong>in</strong> grades 9 through<br />
12 reported that they had been threatened or <strong>in</strong>jured with<br />
a weapon on school property, 11 percent reported that<br />
they had engaged <strong>in</strong> a physical fight on school property,<br />
<strong>and</strong> 23 percent reported that drugs were available to<br />
them on school property <strong>in</strong> the past 12 months. Drug<br />
availability <strong>in</strong>cludes be<strong>in</strong>g offered, sold, or given an<br />
illegal drug. Six percent of students reported carry<strong>in</strong>g a<br />
weapon on school property on one or more of the past 30<br />
days. Weapons <strong>in</strong>clude items such as guns, knives, <strong>and</strong><br />
clubs. Overall, higher percentages of male than female<br />
students reported hav<strong>in</strong>g each of these experiences.<br />
<strong>Higher</strong> percentages of American Indian/Alaska Native<br />
students reported be<strong>in</strong>g threatened or <strong>in</strong>jured with a<br />
weapon <strong>in</strong> 2009 (17 percent) than did their peers of all<br />
other races/ethnicities (between 5 <strong>and</strong> 9 percent), except<br />
Native Hawaiian/Pacific Isl<strong>and</strong>ers (13 percent) for whom<br />
this apparent difference was not measurable. In addition,<br />
the percentage of students who reported be<strong>in</strong>g threatened<br />
or <strong>in</strong>jured with a weapon was higher for Blacks <strong>and</strong><br />
Hispanics (9 percent each) than for Whites (6 percent)<br />
<strong>and</strong> Asians (5 percent). A higher percentage of male than<br />
female students reported be<strong>in</strong>g threatened or <strong>in</strong>jured<br />
with a weapon both overall <strong>and</strong> among White, Black,<br />
Hispanic, <strong>and</strong> Asian students, as well as students of<br />
two or more races. For example, 12 percent of Hispanic<br />
males reported hav<strong>in</strong>g this experience, compared with<br />
6 percent of their female peers. Among both males <strong>and</strong><br />
females, differences <strong>in</strong> the percentage of students who<br />
were threatened or <strong>in</strong>jured with a weapon were also found<br />
by race/ethnicity. For <strong>in</strong>stance, among male students, a<br />
lower percentage of Whites were threatened or <strong>in</strong>jured<br />
with a weapon (8 percent) than were Blacks (11 percent),<br />
Hispanics (12 percent), <strong>and</strong> persons of two or more races<br />
(14 percent).<br />
In 2009, the percentage of students who reported<br />
carry<strong>in</strong>g a weapon on school property was lower for Asian<br />
students (4 percent) than for White (6 percent), Hispanic<br />
(6 percent), <strong>and</strong> Native Hawaiian/Pacific Isl<strong>and</strong>er students<br />
(10 percent). The percentages for Black students <strong>and</strong><br />
students of two or more races were 5 <strong>and</strong> 6 percent,<br />
respectively. <strong>Higher</strong> percentages of male students overall<br />
as well as White, Hispanic, <strong>and</strong> Asian male students<br />
carried a weapon on school property than their female<br />
peers. No measurable differences <strong>in</strong> the percentages of<br />
students carry<strong>in</strong>g a weapon on school property were<br />
Figure 12-1.<br />
Percentage of students <strong>in</strong> grades 9 through 12 who reported that they were threatened or <strong>in</strong>jured with<br />
a weapon on school property dur<strong>in</strong>g the past 12 months, by race/ethnicity <strong>and</strong> sex: 2009<br />
Percent<br />
60<br />
50<br />
40<br />
30<br />
20<br />
10<br />
0<br />
14<br />
11<br />
12<br />
10<br />
8<br />
7<br />
9<br />
5<br />
5<br />
6<br />
5<br />
2<br />
Total 1 White Black Hispanic Asian Two or more races<br />
Race/ethnicity<br />
Male<br />
Female<br />
1<br />
Total <strong>in</strong>cludes other racial/ethnic groups not shown separately <strong>in</strong> the figure.<br />
NOTE: Weapons <strong>in</strong>clude items such as guns, knives, <strong>and</strong> clubs. Report<strong>in</strong>g st<strong>and</strong>ards for Native Hawaiian/Pacific Isl<strong>and</strong>er <strong>and</strong> American Indian/Alaska Native<br />
males <strong>and</strong> females were not met; therefore, data for these groups are not shown <strong>in</strong> the figure. Race categories exclude persons of Hispanic ethnicity.<br />
SOURCE: Centers for Disease Control <strong>and</strong> Prevention (CDC), National Center for Chronic Disease Prevention <strong>and</strong> Health Promotion, Youth Risk Behavior<br />
Surveillance System (YRBSS), 2009.<br />
62 <strong>Higher</strong> <strong>Education</strong>: <strong>Gaps</strong> <strong>in</strong> <strong>Access</strong> <strong>and</strong> <strong>Persistence</strong> <strong>Study</strong>
Figure 12-2.<br />
Percent<br />
60<br />
Percentage of students <strong>in</strong> grades 9 through 12 who reported that drugs were made available to them on<br />
school property dur<strong>in</strong>g the past 12 months, by race/ethnicity <strong>and</strong> sex: 2009<br />
12<br />
50<br />
40<br />
30<br />
20<br />
26<br />
19<br />
23<br />
16<br />
26<br />
19<br />
35<br />
27<br />
22<br />
15<br />
32<br />
23<br />
10<br />
0<br />
Total 1 White Black Hispanic Asian Two or more races<br />
Race/ethnicity<br />
Male<br />
Female<br />
1<br />
Total <strong>in</strong>cludes other racial/ethnic groups not shown separately <strong>in</strong> the figure.<br />
NOTE: Report<strong>in</strong>g st<strong>and</strong>ards for Native Hawaiian/Pacific Isl<strong>and</strong>er <strong>and</strong> American Indian/Alaska Native males <strong>and</strong> females were not met; therefore, data for<br />
these groups are not shown <strong>in</strong> the figure. Race categories exclude persons of Hispanic ethnicity.<br />
SOURCE: Centers for Disease Control <strong>and</strong> Prevention (CDC), National Center for Chronic Disease Prevention <strong>and</strong> Health Promotion, Youth Risk Behavior<br />
Surveillance System (YRBSS), 2009.<br />
found among males by race/ethnicity: between 6 <strong>and</strong> 8<br />
percent of males reported carry<strong>in</strong>g a weapon on school<br />
property. Among female students, a lower percentage of<br />
Asians (1 percent) than Whites (2 percent), Blacks <strong>and</strong><br />
Hispanics (4 percent each), <strong>and</strong> those of two or more<br />
races (5 percent) reported carry<strong>in</strong>g a weapon on school<br />
property; <strong>in</strong> addition, the percentage was lower for White<br />
females than for Hispanic females.<br />
Student reports of engag<strong>in</strong>g <strong>in</strong> a physical fight varied by<br />
race/ethnicity <strong>in</strong> 2009. <strong>Higher</strong> percentages of American<br />
Indian/Alaska Native (21 percent), Black (17 percent),<br />
Native Hawaiian/Pacific Isl<strong>and</strong>er (15 percent), <strong>and</strong><br />
Hispanic students (14 percent) reported engag<strong>in</strong>g <strong>in</strong><br />
a fight than their White <strong>and</strong> Asian peers did (9 <strong>and</strong> 8<br />
percent, respectively). The percentage was also higher<br />
for Black students than for Hispanic students. A higher<br />
percentage of male than female students reported<br />
engag<strong>in</strong>g <strong>in</strong> a physical fight both overall <strong>and</strong> among<br />
White, Black, Hispanic, <strong>and</strong> Asian students, as well as<br />
students of two or more races. For example, 22 percent<br />
of Black males versus 12 percent of Black females reported<br />
engag<strong>in</strong>g <strong>in</strong> a physical fight. <strong>Higher</strong> percentages of<br />
Black <strong>and</strong> Hispanic males (18 percent each) engaged <strong>in</strong><br />
a physical fight than White (12 percent) <strong>and</strong> Asian<br />
(11 percent) males. Some of these patterns by race/<br />
ethnicity were also observed among female students.<br />
In 2009, higher percentages of American Indian/Alaska<br />
Native <strong>and</strong> Hispanic students reported that drugs were<br />
made available to them (34 <strong>and</strong> 31 percent, respectively)<br />
than White (20 percent), Black (22 percent), <strong>and</strong> Asian<br />
students (18 percent) did. Reports of drug availability<br />
were also higher for males than females overall as well<br />
as among Whites, Blacks, <strong>and</strong> Hispanics. For <strong>in</strong>stance,<br />
35 percent of Hispanic males reported that drugs were<br />
made available to them, compared with 27 percent of<br />
Hispanic females. <strong>Higher</strong> percentages of Hispanic males<br />
<strong>and</strong> females <strong>and</strong> males <strong>and</strong> females of two or more races<br />
reported that drugs were made available to them than did<br />
their White <strong>and</strong> Asian counterparts. In addition, for both<br />
males <strong>and</strong> females, a higher percentage of Hispanic than<br />
Black students reported drug availability.<br />
Behaviors <strong>and</strong> Activities<br />
3<br />
Student Behaviors <strong>and</strong> Afterschool Activities 63
Table 12-1. Percentage of students <strong>in</strong> grades 9 through 12 who reported that they were threatened or <strong>in</strong>jured with a<br />
weapon on school property, carried a weapon on school property, engaged <strong>in</strong> a physical fight on school<br />
property, or reported that drugs were made available to them on school property, by sex <strong>and</strong> race/<br />
ethnicity: 2009<br />
Were threatened<br />
Sex <strong>and</strong> race/ethnicity<br />
or <strong>in</strong>jured with a<br />
weapon on school<br />
property 1<br />
Carried<br />
a weapon on<br />
school property 2<br />
Engaged <strong>in</strong> a<br />
physical fight on<br />
school property 1<br />
Drugs were<br />
available on<br />
school property 1<br />
Total 7.7 5.6 11.1 22.7<br />
Sex<br />
Male 9.6 8.1 15.1 25.9<br />
Female 5.5 2.9 6.7 19.3<br />
Race/ethnicity<br />
White 6.5 5.6 8.6 19.8<br />
Black 9.4 5.3 17.4 22.2<br />
Hispanic 9.1 5.8 13.6 31.2<br />
Asian 5.5 3.6 7.7 18.3<br />
Native Hawaiian/Pacific Isl<strong>and</strong>er 12.5 9.8 14.8 27.6<br />
American Indian/Alaska Native 16.5 4.2 20.7 34.0<br />
Two or more races 9.2 5.8 12.4 26.9<br />
Race/ethnicity by sex<br />
Male<br />
White 7.8 8.3 12.4 22.7<br />
Black 11.3 6.7 22.2 25.7<br />
Hispanic 12.0 7.9 17.7 35.1<br />
Asian 9.5 6.3 11.4 21.5<br />
Native Hawaiian/Pacific Isl<strong>and</strong>er ‡ ‡ ‡ ‡<br />
American Indian/Alaska Native ‡ ‡ ‡ ‡<br />
Two or more races 14.0 7.3 18.3 31.7<br />
Female<br />
White 4.9 2.4 4.3 16.5<br />
Black 7.4 4.0 12.5 18.8<br />
Hispanic 6.3 3.7 9.3 27.1<br />
Asian 1.6 0.9 4.1 15.1<br />
Native Hawaiian/Pacific Isl<strong>and</strong>er ‡ ‡ ‡ ‡<br />
American Indian/Alaska Native ‡ ‡ ‡ ‡<br />
Two or more races 5.2 4.7 7.5 23.0<br />
‡ Report<strong>in</strong>g st<strong>and</strong>ards not met (too few cases).<br />
1<br />
In the past 12 months.<br />
2<br />
On one or more of the past 30 days.<br />
NOTE: Weapons <strong>in</strong>clude items such as guns, knives, <strong>and</strong> clubs. Drug availability <strong>in</strong>cludes be<strong>in</strong>g offered, sold, or given an illegal drug. Race categories<br />
exclude persons of Hispanic ethnicity.<br />
SOURCE: Centers for Disease Control <strong>and</strong> Prevention (CDC), National Center for Chronic Disease Prevention <strong>and</strong> Health Promotion, Youth Risk Behavior<br />
Surveillance System (YRBSS), 2009.<br />
64 <strong>Higher</strong> <strong>Education</strong>: <strong>Gaps</strong> <strong>in</strong> <strong>Access</strong> <strong>and</strong> <strong>Persistence</strong> <strong>Study</strong>
12<br />
This page <strong>in</strong>tentionally left blank.<br />
Behaviors <strong>and</strong> Activities<br />
3<br />
Student Behaviors <strong>and</strong> Afterschool Activities 65
Indicator 13<br />
Alcohol <strong>and</strong> Other Drug Use<br />
In 2009, there were no measurable differences <strong>in</strong> the percentages of male <strong>and</strong><br />
female students <strong>in</strong> grades 9 through 12 who reported the use of alcohol, either<br />
overall or among the various racial/ethnic groups. In contrast, among Whites,<br />
Blacks, Hispanics, <strong>and</strong> Asians, higher percentages of males than females reported<br />
us<strong>in</strong>g marijuana.<br />
In 2009, some 19 percent of students <strong>in</strong> grades 9 through<br />
12 reported hav<strong>in</strong>g smoked a cigarette, 42 percent<br />
reported hav<strong>in</strong>g drank alcohol, <strong>and</strong> 21 percent reported<br />
hav<strong>in</strong>g smoked marijuana on one or more of the past<br />
30 days. Six percent of students reported hav<strong>in</strong>g ever<br />
used coca<strong>in</strong>e, 12 percent reported hav<strong>in</strong>g ever used<br />
<strong>in</strong>halants, <strong>and</strong> 4 percent reported hav<strong>in</strong>g ever used<br />
methamphetam<strong>in</strong>es. Overall, higher percentages of<br />
males than females reported hav<strong>in</strong>g smoked marijuana<br />
<strong>in</strong> the past month, ever used coca<strong>in</strong>e, <strong>and</strong> ever used<br />
methamphetam<strong>in</strong>es <strong>in</strong> 2009; <strong>in</strong> contrast, a higher<br />
percentage of females than males reported hav<strong>in</strong>g ever<br />
used <strong>in</strong>halants. Inhalant use <strong>in</strong>cludes sniff<strong>in</strong>g glue,<br />
breath<strong>in</strong>g the contents of aerosol spray cans, or <strong>in</strong>hal<strong>in</strong>g<br />
any pa<strong>in</strong>ts or sprays to get high.<br />
A lower percentage of Asian students drank alcohol<br />
than did their peers <strong>in</strong> other racial/ethnic groups <strong>in</strong><br />
2009 (18 percent vs. 33 to 45 percent). In addition, a<br />
lower percentage of Black students (33 percent) drank<br />
alcohol than did their peers who were White (45 percent),<br />
Hispanic (43 percent), <strong>and</strong> of two or more races (44<br />
percent). No measurable differences <strong>in</strong> the percentage<br />
of students who drank alcohol were found by sex, either<br />
overall or between males <strong>and</strong> females of the various racial/<br />
ethnic groups. For both males <strong>and</strong> females, however,<br />
higher percentages of White <strong>and</strong> Hispanic students <strong>and</strong><br />
students of two or more races drank alcohol than did<br />
their Black <strong>and</strong> Asian peers. The percentages were also<br />
higher for Black males <strong>and</strong> females than for Asian males<br />
<strong>and</strong> females. For <strong>in</strong>stance, 19 percent of Asian males <strong>and</strong><br />
31 percent of Black males reported dr<strong>in</strong>k<strong>in</strong>g alcohol,<br />
compared with 41 percent of males of two or more races,<br />
42 percent of Hispanic males, <strong>and</strong> 44 percent of White<br />
males.<br />
In 2009, the percentage of students who used marijuana<br />
was lower for Asian students than for their counterparts<br />
of other races/ethnicities (7 percent vs. 21 to 32 percent).<br />
The percentage was also lower for White students than<br />
Figure 13-1.<br />
Percentage of students <strong>in</strong> grades 9 through 12 who reported use of alcohol on one or more of the past<br />
30 days, by race/ethnicity <strong>and</strong> sex: 2009<br />
Percent<br />
60<br />
50<br />
40<br />
30<br />
41<br />
43 44<br />
46<br />
31<br />
36<br />
42<br />
44<br />
41<br />
47<br />
20<br />
19<br />
17<br />
10<br />
0<br />
Total 1 White Black Hispanic Asian Two or more races<br />
Race/ethnicity<br />
Male<br />
Female<br />
1<br />
Total <strong>in</strong>cludes other racial/ethnic groups not shown separately <strong>in</strong> the figure.<br />
NOTE: Report<strong>in</strong>g st<strong>and</strong>ards for Native Hawaiian/Pacific Isl<strong>and</strong>er <strong>and</strong> American Indian/Alaska Native males <strong>and</strong> females were not met; therefore, data for<br />
these groups are not shown <strong>in</strong> the figure. Race categories exclude persons of Hispanic ethnicity.<br />
SOURCE: U.S. Department of Health <strong>and</strong> Human Services, Centers for Disease Control <strong>and</strong> Prevention, Youth Risk Behavior Surveillance System (YRBSS),<br />
“Youth Risk Behavior Survey” (YRBS), 2009.<br />
66 <strong>Higher</strong> <strong>Education</strong>: <strong>Gaps</strong> <strong>in</strong> <strong>Access</strong> <strong>and</strong> <strong>Persistence</strong> <strong>Study</strong>
Figure 13-2.<br />
Percent<br />
60<br />
Percentage of students <strong>in</strong> grades 9 through 12 who reported use of marijuana on one or more of the past<br />
30 days, by race/ethnicity <strong>and</strong> sex: 2009<br />
13<br />
50<br />
40<br />
30<br />
20<br />
23<br />
18<br />
23<br />
18<br />
26<br />
19<br />
25<br />
18<br />
20<br />
23<br />
10<br />
11<br />
4<br />
0<br />
Total 1 White Black Hispanic Asian Two or more races<br />
Race/ethnicity<br />
Male<br />
Female<br />
1<br />
Total <strong>in</strong>cludes other racial/ethnic groups not shown separately <strong>in</strong> the figure.<br />
NOTE: Report<strong>in</strong>g st<strong>and</strong>ards for Native Hawaiian/Pacific Isl<strong>and</strong>er <strong>and</strong> American Indian/Alaska Native males <strong>and</strong> females were not met; therefore, data for<br />
these groups are not shown <strong>in</strong> the figure. Race categories exclude persons of Hispanic ethnicity.<br />
SOURCE: U.S. Department of Health <strong>and</strong> Human Services, Centers for Disease Control <strong>and</strong> Prevention, Youth Risk Behavior Surveillance System (YRBSS), “Youth<br />
Risk Behavior Survey” (YRBS), 2009.<br />
for American Indian/Alaska Native students (21 vs. 32<br />
percent). Differences by sex were seen among White,<br />
Black, Hispanic, <strong>and</strong> Asian students. For example, 26<br />
percent of Black males reported marijuana use, compared<br />
with 19 percent of Black females. For both male <strong>and</strong><br />
female students, reported marijuana use was less prevalent<br />
for Asian students than it was for their White, Black, <strong>and</strong><br />
Hispanic peers <strong>and</strong> for their peers of two or more races.<br />
Among males, for example, 11 percent of Asians reported<br />
smok<strong>in</strong>g marijuana, compared with 20 percent of persons<br />
of two or more races, 23 percent of Whites, 25 percent of<br />
Hispanics, <strong>and</strong> 26 percent of Blacks.<br />
Behaviors <strong>and</strong> Activities<br />
3<br />
Student Behaviors <strong>and</strong> Afterschool Activities 67
Table 13-1.<br />
Sex <strong>and</strong> race/ethnicity<br />
Sex<br />
Percentage of students <strong>in</strong> grades 9 through 12 who reported use of alcohol <strong>and</strong> other drugs, by type of<br />
drug, sex, <strong>and</strong> race/ethnicity: 2009<br />
Used on one or more of the past 30 days<br />
Ever used<br />
Alcohol Marijuana Cigarettes Coca<strong>in</strong>e Inhalants 1 am<strong>in</strong>es 2<br />
Methamphet-<br />
Total 41.8 20.8 19.5 6.4 11.7 4.1<br />
Male 40.8 23.4 19.8 7.3 10.6 4.7<br />
Female 42.9 17.9 19.1 5.3 12.9 3.3<br />
Race/ethnicity<br />
White 44.7 20.7 22.5 6.3 11.5 3.8<br />
Black 33.4 22.2 9.5 2.9 8.2 2.7<br />
Hispanic 42.9 21.6 18.0 9.4 14.0 5.7<br />
Asian 18.3 7.5 7.5 3.9 9.7 3.1<br />
Native Hawaiian/Pacific Isl<strong>and</strong>er 34.8 24.8 24.8 8.5 12.9 7.7<br />
American Indian/Alaska Native 42.8 31.6 37.1 11.0 21.5 11.0<br />
Two or more races 44.3 21.7 19.8 6.0 15.1 4.6<br />
Race/ethnicity by sex<br />
Male<br />
White 43.7 23.0 22.3 7.1 10.4 4.2<br />
Black 31.2 25.6 10.7 4.3 7.1 4.5<br />
Hispanic 42.4 25.0 19.4 10.1 12.8 6.1<br />
Asian 19.4 10.6 8.9 5.2 10.8 3.2 !<br />
Native Hawaiian/Pacific Isl<strong>and</strong>er ‡ ‡ ‡ ‡ ‡ ‡<br />
American Indian/Alaska Native ‡ ‡ ‡ ‡ ‡ ‡<br />
Two or more races 40.6 19.7 16.6 8.1 12.5 5.3<br />
Female<br />
White 45.9 18.0 22.8 5.4 12.8 3.2<br />
Black 35.6 18.7 8.4 ‡ 9.4 1.0 !<br />
Hispanic 43.5 18.2 16.7 8.7 15.3 5.2<br />
Asian 17.3 4.5 ! 6.2 2.7 ! 8.7 3.1 !<br />
Native Hawaiian/Pacific Isl<strong>and</strong>er ‡ ‡ ‡ ‡ ‡ ‡<br />
American Indian/Alaska Native ‡ ‡ ‡ ‡ ‡ ‡<br />
Two or more races 47.3 23.4 22.5 4.3 ! 17.4 4.0 !<br />
! Interpret with caution. The coefficient of variation (CV) for this estimate is 30 percent or greater.<br />
‡ Report<strong>in</strong>g st<strong>and</strong>ards not met (too few cases).<br />
1<br />
Includes sniff<strong>in</strong>g glue, breath<strong>in</strong>g the contents of aerosol spray cans, or <strong>in</strong>hal<strong>in</strong>g any pa<strong>in</strong>ts or sprays to get high.<br />
2<br />
Also called “speed,” “crystal,” “crank,” or “ice.”<br />
NOTE: Race categories exclude persons of Hispanic ethnicity.<br />
SOURCE: U.S. Department of Health <strong>and</strong> Human Services, Centers for Disease Control <strong>and</strong> Prevention, Youth Risk Behavior Surveillance System (YRBSS),<br />
“Youth Risk Behavior Survey” (YRBS), 2009.<br />
68 <strong>Higher</strong> <strong>Education</strong>: <strong>Gaps</strong> <strong>in</strong> <strong>Access</strong> <strong>and</strong> <strong>Persistence</strong> <strong>Study</strong>
13<br />
This page <strong>in</strong>tentionally left blank.<br />
Behaviors <strong>and</strong> Activities<br />
3<br />
Student Behaviors <strong>and</strong> Afterschool Activities 69
Indicator 14<br />
Homework<br />
Most high school students (91 percent of males <strong>and</strong> 95 percent of females) did<br />
some homework outside of school <strong>in</strong> 2007. The percentage of high school students<br />
whose parents checked for homework completion was higher for males (68<br />
percent) than for females (61 percent).<br />
In 2007, accord<strong>in</strong>g to parent reports, 93 percent of<br />
high school students (<strong>in</strong> grades 9 through 12) did some<br />
homework outside of school. Among these students, the<br />
frequency of do<strong>in</strong>g homework outside of school varied:<br />
5 percent did homework <strong>in</strong>frequently (less than one day<br />
per week), 15 percent did homework 1 to 2 days per week,<br />
38 percent did homework 3 to 4 days per week, <strong>and</strong> 42<br />
percent did homework very frequently (5 or more days<br />
per week). In addition, the parents of 65 percent of high<br />
school students checked to ensure that their homework<br />
was completed.<br />
Each week, high school students who did homework<br />
outside of school <strong>in</strong> 2007 did an average of 7 hours of<br />
homework outside of school. On average, Asian students<br />
spent more time do<strong>in</strong>g homework each week (10 hours)<br />
than did their White, Black, <strong>and</strong> Hispanic peers <strong>and</strong> their<br />
peers of two or more races (between 6 <strong>and</strong> 7 hours); this<br />
racial/ethnic pattern also held among female students.<br />
Overall, female students did more hours of homework<br />
each week, on average, than male students (8 vs. 6 hours).<br />
The same pattern between males <strong>and</strong> females was<br />
observed with<strong>in</strong> the White, Black, Hispanic, <strong>and</strong> Asian<br />
racial/ethnic groups. For example, Black females did<br />
7 hours of homework outside of school each week, on<br />
average, compared with an average of 5 hours for Black<br />
males. Among male students, the average number of hours<br />
of homework done each week was greater for Asians (8<br />
hours) than it was for Blacks (5 hours) <strong>and</strong> Hispanics (6<br />
hours); the percentages for White students <strong>and</strong> students of<br />
two or more races were 6 <strong>and</strong> 7 percent, respectively.<br />
The percentage of students whose parents checked for<br />
homework completion was higher among Blacks (83<br />
percent) <strong>and</strong> Hispanics (76 percent) than Whites (57<br />
percent) <strong>and</strong> Asians (59 percent). In addition, check<strong>in</strong>g<br />
for homework completion was more prevalent among the<br />
parents of Black students than the parents of students<br />
of two or more races (64 percent). Overall, a higher<br />
percentage of parents of male students checked for<br />
homework completion (68 percent) than did the parents<br />
of female students (61 percent); this f<strong>in</strong>d<strong>in</strong>g also held for<br />
White males <strong>and</strong> females. Among males, check<strong>in</strong>g for<br />
homework completion was more prevalent among the<br />
Figure 14-1.<br />
Average hours per week spent on homework for high school students (grades 9 through 12) who did<br />
homework outside of school, by race/ethnicity <strong>and</strong> sex: 2007<br />
Average hours<br />
60<br />
50<br />
40<br />
30<br />
20<br />
10<br />
6<br />
8<br />
6<br />
7<br />
5<br />
7<br />
6<br />
7 8<br />
13<br />
7 8<br />
0<br />
Total 1 White Black Hispanic Asian Two or more races<br />
Race/ethnicity<br />
Male<br />
Female<br />
1<br />
Total <strong>in</strong>cludes other racial/ethnic groups not shown separately <strong>in</strong> the figure.<br />
NOTE: Data based on responses of the parent most knowledgeable about the student’s education. Analysis excludes homeschooled students. Report<strong>in</strong>g<br />
st<strong>and</strong>ards for Native Hawaiians/Pacific Isl<strong>and</strong>ers <strong>and</strong> American Indians/Alaska Natives were not met; therefore, data for these groups are not shown <strong>in</strong> the<br />
figure. Race categories exclude persons of Hispanic ethnicity.<br />
SOURCE: U.S. Department of <strong>Education</strong>, National Center for <strong>Education</strong> Statistics, Parent <strong>and</strong> Family Involvement <strong>in</strong> <strong>Education</strong> Survey of the National Household<br />
<strong>Education</strong> Surveys Program (NHES), 2007.<br />
70 <strong>Higher</strong> <strong>Education</strong>: <strong>Gaps</strong> <strong>in</strong> <strong>Access</strong> <strong>and</strong> <strong>Persistence</strong> <strong>Study</strong>
Figure 14-2.<br />
Percent<br />
100<br />
Among high school students (grades 9 through 12) who did homework outside of school, percentage<br />
whose parents checked that homework was completed, by race/ethnicity <strong>and</strong> sex: 2007<br />
14<br />
80<br />
60<br />
68<br />
61 61<br />
53<br />
86<br />
79<br />
74<br />
77<br />
58<br />
61<br />
66<br />
63<br />
40<br />
20<br />
0<br />
Total 1 White Black Hispanic Asian Two or more races<br />
Race/ethnicity<br />
Male<br />
Female<br />
1<br />
Total <strong>in</strong>cludes other racial/ethnic groups not shown separately <strong>in</strong> the figure.<br />
NOTE: Data based on responses of the parent most knowledgeable about the student’s education. Analysis excludes homeschooled students. Report<strong>in</strong>g<br />
st<strong>and</strong>ards for Native Hawaiian/Pacific Isl<strong>and</strong>er students <strong>and</strong> American Indian/Alaska Native students were not met; therefore, data for these groups are not<br />
shown <strong>in</strong> the figure. Race categories exclude persons of Hispanic ethnicity.<br />
SOURCE: U.S. Department of <strong>Education</strong>, National Center for <strong>Education</strong> Statistics, Parent <strong>and</strong> Family Involvement <strong>in</strong> <strong>Education</strong> Survey of the National Household<br />
<strong>Education</strong> Surveys Program (NHES), 2007.<br />
parents of Blacks (86 percent) than among the parents of<br />
Whites (61 percent), Hispanics (74 percent), <strong>and</strong> Asians<br />
(58 percent) <strong>and</strong> the parents of males of two or more races<br />
(66 percent).<br />
Technical Notes<br />
The analysis excludes homeschooled students. The term<br />
parent refers to one or more parents or other household<br />
adults. Data are based on the responses of the parent most<br />
knowledgeable about the student’s education.<br />
Behaviors <strong>and</strong> Activities<br />
3<br />
Student Behaviors <strong>and</strong> Afterschool Activities 71
72 <strong>Higher</strong> <strong>Education</strong>: <strong>Gaps</strong> <strong>in</strong> <strong>Access</strong> <strong>and</strong> <strong>Persistence</strong> <strong>Study</strong><br />
Table 14-1.<br />
Sex <strong>and</strong> race/ethnicity<br />
Percentage of high school students (grades 9 through 12) who did homework outside of school, average hours per week spent on homework, frequency<br />
of do<strong>in</strong>g homework, <strong>and</strong> percentage of students whose parents checked that homework was done, by sex <strong>and</strong> race/ethnicity: 2007<br />
Percent of<br />
students who did<br />
homework<br />
outside of school<br />
Average hours<br />
per week spent<br />
on homework<br />
Less than<br />
once per<br />
week<br />
Students who did homework outside of school<br />
Frequency of do<strong>in</strong>g homework<br />
1 to 2<br />
days per<br />
week<br />
3 to 4<br />
days per<br />
week<br />
5 or more<br />
days per<br />
week<br />
Percent of<br />
students whose<br />
parents 1 checked<br />
that homework<br />
was done<br />
Total 2 93.0 6.8 5.4 14.8 38.0 41.9 64.6<br />
Sex<br />
Male 91.2 6.0 7.4 18.4 38.2 36.0 67.8<br />
Female 94.9 7.5 3.3 11.2 37.7 47.8 61.5<br />
Race/ethnicity<br />
White 94.5 6.8 4.2 12.9 38.6 44.3 57.2<br />
Black 91.8 6.3 ‡ 20.1 41.0 29.7 83.1<br />
Hispanic 90.7 6.4 5.9 17.7 36.6 39.8 75.5<br />
Asian 93.6 10.3 # 13.8 ! 18.5 ! 67.7 59.0<br />
Native Hawaiian/Pacific Isl<strong>and</strong>er ‡ ‡ ‡ ‡ ‡ ‡ ‡<br />
American Indian/Alaska Native ‡ ‡ ‡ ‡ ‡ ‡ ‡<br />
Two or more races 86.7 7.2 ‡ 9.9 34.1 50.2 64.4<br />
Race/ethnicity by sex<br />
Male<br />
White 92.3 6.2 6.1 16.9 38.6 38.3 61.3<br />
Black 91.7 5.4 ‡ 21.1 41.9 24.1 85.8<br />
Hispanic 89.7 5.6 7.2 21.6 37.1 34.1 74.2<br />
Asian 89.0 8.0 # ‡ 30.1 ! 53.8 57.6<br />
Native Hawaiian/Pacific Isl<strong>and</strong>er ‡ ‡ ‡ ‡ ‡ ‡ ‡<br />
American Indian/Alaska Native ‡ ‡ ‡ ‡ ‡ ‡ ‡<br />
Two or more races 86.1 6.5 ‡ 10.6 ! 31.7 47.4 65.8<br />
Female<br />
White 96.7 7.4 2.5 9.3 38.6 49.7 53.4<br />
Black 91.9 7.5 ‡ 18.8 39.7 37.1 79.4<br />
Hispanic 91.7 7.2 4.5 ! 13.8 36.1 45.6 77.0<br />
Asian 100.0 13.2 # 10.8 ! ‡ 85.2 60.8<br />
Native Hawaiian/Pacific Isl<strong>and</strong>er ‡ ‡ ‡ ‡ ‡ ‡ ‡<br />
American Indian/Alaska Native ‡ ‡ ‡ ‡ ‡ ‡ ‡<br />
Two or more races 87.5 8.0 # 8.9 ! 37.2 53.9 62.6<br />
# Rounds to zero.<br />
! Interpret with caution. The coefficient of variation (CV) for this estimate is 30 percent or greater.<br />
‡ Report<strong>in</strong>g st<strong>and</strong>ards not met. There are either too few cases or the coefficient of variation (CV) for this estimate is 50 percent or greater.<br />
1<br />
Refers to one or more parent or other household adult.<br />
2<br />
Total <strong>in</strong>cludes other racial/ethnic groups not shown separately <strong>in</strong> the table.<br />
NOTE: Data based on responses of the parent most knowledgeable about the student’s education. Analysis excludes homeschooled students. Report<strong>in</strong>g st<strong>and</strong>ards for Native Hawaiian/Pacific Isl<strong>and</strong>er students<br />
<strong>and</strong> American Indian/Alaska Native students were not met; therefore, data for these groups are not shown <strong>in</strong> the table. Detail may not sum to totals because of round<strong>in</strong>g. Race categories exclude persons of<br />
Hispanic ethnicity.<br />
SOURCE: U.S. Department of <strong>Education</strong>, National Center for <strong>Education</strong> Statistics, Parent <strong>and</strong> Family Involvement <strong>in</strong> <strong>Education</strong> Survey of the National Household <strong>Education</strong> Surveys Program (NHES), 2007.
14<br />
This page <strong>in</strong>tentionally left blank.<br />
Behaviors <strong>and</strong> Activities<br />
3<br />
Student Behaviors <strong>and</strong> Afterschool Activities 73
Indicator 15<br />
Part-Time Work<br />
The percentages of White male <strong>and</strong> female high school students who were<br />
employed <strong>in</strong> 2010 were higher than the percentages of male <strong>and</strong> female high<br />
school students of other races/ethnicities who were employed, <strong>in</strong>clud<strong>in</strong>g Blacks,<br />
Hispanics, <strong>and</strong> American Indians/Alaska Natives. Among high school students<br />
who worked, however, the percentages of Black <strong>and</strong> Hispanic males who worked<br />
more than 20 hours per week were higher than the percentage of White males<br />
who did so.<br />
In 2010, about 17 percent of high school students ages<br />
16 <strong>and</strong> older were employed. A higher percentage of<br />
female than male students were employed, both overall<br />
<strong>and</strong> among White <strong>and</strong> American Indian/Alaska Native<br />
students. For example, among American Indians/<br />
Alaska Natives, 9 percent of females versus 2 percent of<br />
males were employed. In terms of overall racial/ethnic<br />
differences, higher percentages of White students <strong>and</strong><br />
students of two or more races were employed than their<br />
peers <strong>in</strong> the other racial/ethnic groups. The employment<br />
percentages were as follows: Whites (22 percent), persons<br />
of two or more races (17 percent), Hispanics (12 percent),<br />
Blacks (11 percent), Asians (8 percent), <strong>and</strong> American<br />
Indians/Alaska Natives (5 percent). Employment<br />
percentages were also higher for Blacks <strong>and</strong> Hispanics<br />
than for Asians <strong>and</strong> American Indians/Alaska Natives.<br />
Racial/ethnic patterns for male students were generally<br />
similar to the overall racial/ethnic pattern. Among<br />
females, a higher percentage of White students than of<br />
Black, Hispanic, Asian, <strong>and</strong> American Indian/Alaska<br />
Native students were employed. The percentages of<br />
females who were employed were also higher for Black<br />
<strong>and</strong> Hispanic students <strong>and</strong> students of two or more races<br />
than for Asian students.<br />
The number of hours that students who were employed<br />
<strong>in</strong> 2010 worked each week varied: 29 percent worked less<br />
than 10 hours, 55 percent worked 10–20 hours, <strong>and</strong> 16<br />
percent worked more than 20 hours. A higher percentage<br />
of employed males than employed females worked more<br />
than 20 hours per week, both overall <strong>and</strong> among Blacks<br />
(33 vs. 19 percent). In terms of overall differences by race/<br />
ethnicity <strong>in</strong> the percentages of employed students who<br />
worked more than 20 hours per week, the percentages of<br />
Black <strong>and</strong> Hispanic students work<strong>in</strong>g at this level (26 <strong>and</strong><br />
21 percent, respectively) were higher than the percentages<br />
of White students <strong>and</strong> students of two or more races<br />
work<strong>in</strong>g at this level (14 <strong>and</strong> 13 percent, respectively). In<br />
addition, the percentage of Black students work<strong>in</strong>g at this<br />
level was higher than the percentage of Hispanic students<br />
Figure 15-1. Percentage of employed high school students ages 16 <strong>and</strong> older, by race/ethnicity <strong>and</strong> sex: 2010<br />
Percent<br />
60<br />
50<br />
40<br />
30<br />
20<br />
10<br />
0<br />
16<br />
18<br />
20<br />
23<br />
11<br />
12 12 12<br />
Total White Black Hispanic Asian American Indian/<br />
Alaska Native<br />
Race/ethnicity<br />
10<br />
7<br />
2<br />
9<br />
21<br />
12<br />
Two or<br />
more races<br />
Male<br />
Female<br />
NOTE: High school students <strong>in</strong>clude those <strong>in</strong> grades 9 through 12. Employment status refers to the full calendar week prior to the week when the respondent<br />
answered the questions. Estimates <strong>in</strong>clude those who worked zero hours <strong>in</strong> the previous week. Report<strong>in</strong>g st<strong>and</strong>ards were not met for Native Hawaiians/Pacific<br />
Isl<strong>and</strong>ers; therefore, data for this racial group is not shown <strong>in</strong> the figure. Race categories exclude persons of Hispanic ethnicity.<br />
SOURCE: U.S. Department of Commerce, Census Bureau, Current Population Survey (CPS), Annual Social <strong>and</strong> Economic Supplement, 2010.<br />
74 <strong>Higher</strong> <strong>Education</strong>: <strong>Gaps</strong> <strong>in</strong> <strong>Access</strong> <strong>and</strong> <strong>Persistence</strong> <strong>Study</strong>
Figure 15-2.<br />
Percent<br />
60<br />
Percentage of employed high school students ages 16 <strong>and</strong> older who worked more than 20 hours per<br />
week, by race/ethnicity <strong>and</strong> sex: 2010<br />
15<br />
50<br />
40<br />
30<br />
33<br />
20<br />
18<br />
15 15<br />
13<br />
19<br />
21<br />
20<br />
10<br />
0<br />
Total 1 White Black Hispanic<br />
Race/ethnicity<br />
Male<br />
Female<br />
1<br />
Total <strong>in</strong>cludes other racial/ethnic groups not shown separately <strong>in</strong> the figure.<br />
NOTE: High school students <strong>in</strong>clude those <strong>in</strong> grades 9 through 12. Employment status refers to the full calendar week prior to the week when the respondent<br />
answered the questions. Report<strong>in</strong>g st<strong>and</strong>ards were not met for Asian males <strong>and</strong> females, Native Hawaiian/Pacific Isl<strong>and</strong>er males <strong>and</strong> females, American<br />
Indian/Alaska Native males <strong>and</strong> females, <strong>and</strong> males <strong>and</strong> females of two or more races; therefore, data for these racial groups are not shown <strong>in</strong> the figure.<br />
Race categories exclude persons of Hispanic ethnicity.<br />
SOURCE: U.S. Department of Commerce, Census Bureau, Current Population Survey (CPS), Annual Social <strong>and</strong> Economic Supplement, 2010.<br />
do<strong>in</strong>g so. Among males, the percentages of employed<br />
students who worked more than 20 hours per week were<br />
higher for Blacks <strong>and</strong> Hispanics than for Whites <strong>and</strong> were<br />
higher for Blacks than for Hispanics. Among employed<br />
female students, the percentage work<strong>in</strong>g at this level was<br />
higher for Hispanics than for Whites.<br />
Technical Notes<br />
High school students <strong>in</strong>clude those <strong>in</strong> grades 9 through<br />
12. Employment status refers to the full calendar week<br />
prior to the week when the respondent answered the<br />
questions. Estimates for those employed <strong>in</strong>clude those<br />
who worked zero hours <strong>in</strong> the previous week.<br />
Behaviors <strong>and</strong> Activities<br />
3<br />
Student Behaviors <strong>and</strong> Afterschool Activities 75
Table 15-1.<br />
Sex <strong>and</strong> race/ethnicity<br />
Sex<br />
Percentage of high school students ages 16 <strong>and</strong> older who were employed <strong>and</strong> the percentage<br />
distribution of hours worked per week, by sex <strong>and</strong> race/ethnicity: 2010<br />
Percent<br />
employed<br />
Percent distribution of hours worked per week<br />
Less than<br />
10 hours<br />
10–20<br />
hours<br />
More than<br />
20 hours<br />
Total 17.2 29.0 54.6 16.4<br />
Male 16.4 28.8 53.7 17.5<br />
Female 18.1 29.2 55.5 15.3<br />
Race/ethnicity<br />
White 21.5 31.7 54.0 14.2<br />
Black 11.2 20.6 53.4 26.0<br />
Hispanic 11.7 18.5 61.0 20.5<br />
Asian 8.4 39.7 39.6 20.8<br />
Native Hawaiian/Pacific Isl<strong>and</strong>er ‡ ‡ ‡ ‡<br />
American Indian/Alaska Native 4.7 ‡ ‡ ‡<br />
Two or more races 17.0 28.1 59.2 12.7<br />
Race/ethnicity by sex<br />
Male<br />
White 20.0 31.8 53.1 15.1<br />
Black 10.7 18.3 48.3 33.4<br />
Hispanic 11.5 18.4 60.3 21.3<br />
Asian 9.6 ‡ ‡ ‡<br />
Native Hawaiian/Pacific Isl<strong>and</strong>er ‡ ‡ ‡ ‡<br />
American Indian/Alaska Native 1.7 ‡ ‡ ‡<br />
Two or more races 20.7 ‡ ‡ ‡<br />
Female<br />
White 23.2 31.6 55.0 13.4<br />
Black 11.7 22.8 58.2 19.0<br />
Hispanic 11.9 18.6 61.6 19.7<br />
Asian 7.2 ‡ ‡ ‡<br />
Native Hawaiian/Pacific Isl<strong>and</strong>er ‡ ‡ ‡ ‡<br />
American Indian/Alaska Native 8.6 ‡ ‡ ‡<br />
Two or more races 11.7 ‡ ‡ ‡<br />
‡ Report<strong>in</strong>g st<strong>and</strong>ards not met (too few cases).<br />
NOTE: High school students <strong>in</strong>clude those <strong>in</strong> grades 9 through 12. Employment status refers to the full calendar week prior to the week when the<br />
respondent answered the questions. Estimates <strong>in</strong>clude those who worked zero hours <strong>in</strong> the previous week. Detail may not sum to totals because of<br />
round<strong>in</strong>g. Race categories exclude persons of Hispanic ethnicity.<br />
SOURCE: U.S. Department of Commerce, Census Bureau, Current Population Survey (CPS), Annual Social <strong>and</strong> Economic Supplement, 2010.<br />
76 <strong>Higher</strong> <strong>Education</strong>: <strong>Gaps</strong> <strong>in</strong> <strong>Access</strong> <strong>and</strong> <strong>Persistence</strong> <strong>Study</strong>
15<br />
This page <strong>in</strong>tentionally left blank.<br />
Behaviors <strong>and</strong> Activities<br />
3<br />
Student Behaviors <strong>and</strong> Afterschool Activities 77
Indicator 16<br />
School-Sponsored <strong>and</strong> Non-School-Sponsored<br />
Activities<br />
As of 2009, thirteen percent of 9th-grade students had participated <strong>in</strong> at least<br />
one math- or science-related school-sponsored activity <strong>in</strong> the previous year. No<br />
measurable differences <strong>in</strong> the percentage of students who participated were found<br />
between males <strong>and</strong> females, either overall or by race/ethnicity.<br />
As of 2009, thirteen percent of 9th-grade students had<br />
participated <strong>in</strong> at least one math- or science-related<br />
school-sponsored activity <strong>in</strong> the previous year, <strong>and</strong> 4<br />
percent had participated <strong>in</strong> more than one of these<br />
activities. Specifically, 10 percent of students reported<br />
participation <strong>in</strong> a math-related school-sponsored activity,<br />
<strong>and</strong> 6 percent reported participation <strong>in</strong> a science-related<br />
school-sponsored activity. No measurable differences <strong>in</strong><br />
the percentage of students who participated <strong>in</strong> at least one<br />
activity were found between males <strong>and</strong> females, either<br />
overall or by race/ethnicity. A higher percentage of Asian<br />
9th-grade students participated <strong>in</strong> at least one math- or<br />
science-related school-sponsored activity (22 percent) than<br />
did their White, Black, Hispanic, <strong>and</strong> American Indian/<br />
Alaska Native peers or their peers of two or more races<br />
(between 12 <strong>and</strong> 15 percent). This overall racial/ethnic<br />
pattern was also observed among males <strong>and</strong> females.<br />
As of 2009, eighty-six percent of 9th-grade students had<br />
participated <strong>in</strong> at least one non-school-sponsored activity<br />
<strong>in</strong> the previous year, <strong>and</strong> 62 percent had participated <strong>in</strong><br />
more than one. These non-school-sponsored activities<br />
<strong>in</strong>cluded the perform<strong>in</strong>g arts, namely music, art, dance,<br />
or theater (35 percent); organized sports (55 percent);<br />
religious youth group or religious <strong>in</strong>struction (51 percent);<br />
scout<strong>in</strong>g or other youth organization (23 percent);<br />
academic <strong>in</strong>struction (18 percent); math or science camp<br />
(4 percent); <strong>and</strong> other camps (24 percent). No measurable<br />
differences <strong>in</strong> the percentage of students who participated<br />
<strong>in</strong> at least one activity were found between males <strong>and</strong><br />
females, either overall or by race/ethnicity. A higher<br />
percentage of White 9th-grade students participated<br />
<strong>in</strong> at least one non-school-sponsored activity than did<br />
their Black, Hispanic, Asian, <strong>and</strong> American Indian/<br />
Alaska Native peers (90 percent vs. between 77 <strong>and</strong> 85<br />
percent). The percentage of students of two or more races<br />
who participated <strong>in</strong> at least one non-school-sponsored<br />
activity (87 percent) was not measurably different from<br />
the percentage of Whites do<strong>in</strong>g so. Differences by race/<br />
ethnicity <strong>in</strong> the percentage of students who participated<br />
<strong>in</strong> non-school-sponsored activities were also found<br />
among male <strong>and</strong> female students. Among males, higher<br />
Figure 16-1.<br />
Percentage of 9th-grade students participat<strong>in</strong>g <strong>in</strong> at least one math- or science-related school-sponsored<br />
activity, by race/ethnicity <strong>and</strong> sex: 2009<br />
Percent<br />
100<br />
80<br />
60<br />
40<br />
20<br />
13 14 11 13<br />
15 15<br />
12<br />
15<br />
23 22<br />
13<br />
15<br />
0<br />
Total 1 White Black Hispanic Asian Two or more races<br />
Race/ethnicity<br />
Male<br />
Female<br />
1<br />
Total <strong>in</strong>cludes other racial/ethnic groups not shown separately <strong>in</strong> the figure.<br />
NOTE: Data are based on student responses. Student reports about school-sponsored activities refer to the period “s<strong>in</strong>ce the beg<strong>in</strong>n<strong>in</strong>g of the last school<br />
year,” which for most of these students was 8th grade, or the fall of 2008. Report<strong>in</strong>g st<strong>and</strong>ards for Native Hawaiian/Pacific Isl<strong>and</strong>er <strong>and</strong> American Indian/<br />
Alaska Native males <strong>and</strong> females were not met; therefore, data for these racial groups are not shown <strong>in</strong> the figure. Data weighted by W1STUDENT. Race<br />
categories exclude persons of Hispanic ethnicity.<br />
SOURCE: U.S. Department of <strong>Education</strong>, National Center for <strong>Education</strong> Statistics, High School Longitud<strong>in</strong>al <strong>Study</strong> of 2009, Base-Year Public-Use Data File.<br />
78 <strong>Higher</strong> <strong>Education</strong>: <strong>Gaps</strong> <strong>in</strong> <strong>Access</strong> <strong>and</strong> <strong>Persistence</strong> <strong>Study</strong>
Figure 16-2.<br />
Percent<br />
Percentage of 9th-grade students participat<strong>in</strong>g <strong>in</strong> at least one non-school-sponsored activity, by race/<br />
ethnicity <strong>and</strong> sex: 2009<br />
16<br />
100<br />
80<br />
86 85<br />
89 90<br />
87<br />
83<br />
78 75 79<br />
85<br />
78 80<br />
89<br />
85<br />
60<br />
40<br />
20<br />
0<br />
Total 1 White Black Hispanic Asian American Indian/<br />
Alaska Native<br />
Two or more races<br />
Race/ethnicity<br />
Male<br />
Female<br />
1<br />
Total <strong>in</strong>cludes other racial/ethnic groups not shown separately <strong>in</strong> the figure.<br />
NOTE: Data are based on parent responses. Parent reports about non-school-sponsored activities refer to the last 12 months. Report<strong>in</strong>g st<strong>and</strong>ards for Native<br />
Hawaiian/Pacific Isl<strong>and</strong>er males <strong>and</strong> females were not met; therefore, data for these groups are not shown <strong>in</strong> the figure. Data weighted by W1PARENT. Race<br />
categories exclude persons of Hispanic ethnicity.<br />
SOURCE: U.S. Department of <strong>Education</strong>, National Center for <strong>Education</strong> Statistics, High School Longitud<strong>in</strong>al <strong>Study</strong> of 2009, Base-Year Public-Use Data File.<br />
percentages of Whites <strong>and</strong> persons of two or more races<br />
(89 percent each) participated <strong>in</strong> these activities than<br />
did their Hispanic (78 percent) <strong>and</strong> Asian (79 percent)<br />
peers; the percentage who participated was also higher for<br />
Blacks (87 percent) than for Hispanics. Among females, a<br />
higher percentage of Whites (90 percent) than Blacks (83<br />
percent), Hispanics (75 percent), <strong>and</strong> persons of two or<br />
more races (85 percent) participated <strong>in</strong> these activities; the<br />
percentages who participated were also higher for Blacks,<br />
Asians (85 percent), <strong>and</strong> persons of two or more races<br />
than for Hispanics.<br />
Technical Notes<br />
School-sponsored activities are def<strong>in</strong>ed as activities that<br />
are provided by the school. Data on school-sponsored<br />
activities are based on student responses; data on<br />
non-school-sponsored activities are based on parent<br />
responses. Student reports about school-sponsored<br />
activities refer to the period “s<strong>in</strong>ce the beg<strong>in</strong>n<strong>in</strong>g of<br />
the last school year,” which for most of these students<br />
was 8th grade, or the fall of 2008. Parent reports about<br />
non-school-sponsored activities refer to the last<br />
12 months.<br />
Behaviors <strong>and</strong> Activities<br />
3<br />
Student Behaviors <strong>and</strong> Afterschool Activities 79
Table 16-1.<br />
Percentage of 9th-grade students participat<strong>in</strong>g <strong>in</strong> math- <strong>and</strong> science-related school-sponsored activities,<br />
by sex <strong>and</strong> race/ethnicity: 2009<br />
Activity<br />
Sex <strong>and</strong> race/ethnicity Math-related 1 Science-related 1 these activities<br />
At least one of<br />
Sex<br />
Number of math- or science-related activities<br />
More than one of<br />
these activities<br />
None of these<br />
activities<br />
Total 2 9.8 6.4 13.4 4.1 86.6<br />
Male 8.9 6.3 12.6 4.0 87.4<br />
Female 10.7 6.5 14.2 4.2 85.8<br />
Race/ethnicity<br />
White 8.3 6.4 12.2 3.7 87.8<br />
Black 12.5 5.4 15.3 3.9 84.7<br />
Hispanic 10.5 5.5 13.4 3.9 86.6<br />
Asian 17.3 13.0 22.3 10.7 77.7<br />
Native Hawaiian/Pacific Isl<strong>and</strong>er ‡ ‡ ‡ ‡ ‡<br />
American Indian/Alaska Native 9.1 ! ‡ 12.8 ! ‡ 87.2<br />
Two or more races 10.5 7.6 14.2 5.3 85.8<br />
Race/ethnicity by sex<br />
Male<br />
White 7.6 6.1 11.5 3.6 88.5<br />
Black 12.2 5.8 15.4 3.8 84.6<br />
Hispanic 9.2 5.5 12.1 3.8 87.9<br />
Asian 18.4 11.5 22.8 10.5 77.2<br />
Native Hawaiian/Pacific Isl<strong>and</strong>er ‡ ‡ ‡ ‡ ‡<br />
American Indian/Alaska Native 10.9 ! ‡ ‡ ‡ 88.0<br />
Two or more races 8.3 9.0 13.4 5.5 86.6<br />
Female<br />
White 9.0 6.7 13.0 3.8 87.0<br />
Black 12.8 5.0 15.2 4.0 84.8<br />
Hispanic 11.9 5.5 14.6 4.0 85.4<br />
Asian 16.1 14.6 21.8 11.0 78.2<br />
Native Hawaiian/Pacific Isl<strong>and</strong>er ‡ ‡ ‡ ‡ ‡<br />
American Indian/Alaska Native ‡ ‡ ‡ ‡ 86.3<br />
Two or more races 12.7 6.3 15.0 5.1 85.0<br />
! Interpret data with caution. The coefficient of variation (CV) for this estimate is 30 percent or greater.<br />
‡ Report<strong>in</strong>g st<strong>and</strong>ards not met. There are either too few cases or the coefficient of variation (CV) is 50 percent or greater.<br />
1<br />
Includes clubs, competitions, <strong>and</strong> camps.<br />
2<br />
Total <strong>in</strong>cludes other racial/ethnic groups not shown separately <strong>in</strong> the table.<br />
NOTE: Data are based on student responses. Student reports about school-sponsored activities refer to the period “s<strong>in</strong>ce the beg<strong>in</strong>n<strong>in</strong>g of the last<br />
school year,” which for most of these students was 8th grade, or the fall of 2008. Data weighted by W1STUDENT. Race categories exclude persons of<br />
Hispanic ethnicity.<br />
SOURCE: U.S. Department of <strong>Education</strong>, National Center for <strong>Education</strong> Statistics, High School Longitud<strong>in</strong>al <strong>Study</strong> of 2009, Base-Year Public-Use Data File.<br />
80 <strong>Higher</strong> <strong>Education</strong>: <strong>Gaps</strong> <strong>in</strong> <strong>Access</strong> <strong>and</strong> <strong>Persistence</strong> <strong>Study</strong>
Table 16-2. Percentage of 9th-grade students participat<strong>in</strong>g <strong>in</strong> various non-school-sponsored activities, by sex <strong>and</strong> race/ethnicity: 2009<br />
Sex <strong>and</strong> race/ethnicity<br />
Sex<br />
Perform<strong>in</strong>g<br />
arts 1<br />
Organized<br />
sports<br />
Religious<br />
youth<br />
group or<br />
<strong>in</strong>struction<br />
Activity<br />
Scout<strong>in</strong>g or<br />
other youth<br />
organization<br />
Academic<br />
<strong>in</strong>struction 2<br />
Math or<br />
science<br />
camp<br />
Another<br />
camp<br />
Number of non-school-sponsored<br />
activities<br />
At least one<br />
of these<br />
activities<br />
More than<br />
one of these<br />
activities<br />
Total 3 34.6 54.9 51.4 22.8 17.7 4.1 23.8 85.7 61.9 14.3<br />
Male 27.9 59.8 49.5 21.6 17.5 4.1 23.2 86.1 60.3 13.9<br />
Female 41.3 50.0 53.4 24.1 17.9 4.0 24.4 85.4 63.4 14.6<br />
Race/ethnicity<br />
White 36.8 60.5 56.7 24.0 13.2 2.7 30.6 89.7 67.8 10.3<br />
Black 33.8 49.1 52.3 26.3 32.8 7.4 14.8 84.9 61.9 15.1<br />
Hispanic 27.5 46.9 39.1 16.6 18.6 3.6 14.5 76.9 48.1 23.1<br />
Asian 44.4 38.5 38.8 25.8 31.1 15.0 16.2 82.1 57.3 17.9<br />
None of<br />
these<br />
activities<br />
Native Hawaiian/Pacific Isl<strong>and</strong>er ‡ ‡ ‡ ‡ ‡ ‡ ‡ ‡ ‡ ‡<br />
American Indian/Alaska Native 20.0 ! 48.8 42.3 31.6 16.8 ‡ 19.1 ! 78.9 52.2 21.1<br />
Two or more races 36.4 55.8 53.6 24.9 15.4 3.4 21.2 86.8 62.6 13.2<br />
Race/ethnicity by sex<br />
Male<br />
White 29.1 63.3 54.5 23.2 14.2 2.8 29.6 89.0 65.0 11.0<br />
Black 27.4 58.2 49.0 21.0 31.1 7.5 14.6 87.3 60.7 12.7<br />
Hispanic 22.4 54.4 37.1 15.3 16.9 2.9 ! 13.1 78.4 47.1 21.6<br />
Asian 36.9 42.9 32.8 26.1 31.0 18.4 20.3 78.9 57.1 21.1<br />
Native Hawaiian/Pacific Isl<strong>and</strong>er ‡ ‡ ‡ ‡ ‡ ‡ ‡ ‡ ‡ ‡<br />
American Indian/Alaska Native 18.8 ! 49.9 38.2 31.3 ‡ ‡ ‡ 78.4 49.1 21.6 !<br />
Two or more races 29.9 59.2 56.9 26.2 16.0 3.4 ! 20.4 88.6 65.1 11.4<br />
Student Behaviors <strong>and</strong> Afterschool Activities 81<br />
Female<br />
White 44.9 57.5 59.0 24.8 12.1 2.7 31.7 90.4 70.7 9.6<br />
Black 39.0 41.8 55.0 30.5 34.2 7.3 14.9 83.0 62.8 17.0<br />
Hispanic 32.9 39.0 41.1 17.9 20.3 4.4 16.0 75.4 49.0 24.6<br />
Asian 51.8 34.2 44.8 25.6 31.2 11.7 12.2 85.3 57.6 14.7<br />
Native Hawaiian/Pacific Isl<strong>and</strong>er ‡ ‡ ‡ ‡ ‡ ‡ ‡ ‡ ‡ ‡<br />
American Indian/Alaska Native 21.4 ! 47.4 47.0 32.0 ‡ ‡ ‡ 79.5 55.7 20.5 !<br />
Two or more races 42.4 52.5 50.4 23.7 14.8 3.4 ! 22.0 85.1 60.2 14.9<br />
! Interpret data with caution. The coefficient of variation (CV) for this estimate is 30 percent or greater.<br />
‡ Report<strong>in</strong>g st<strong>and</strong>ards not met. There are either too few cases or the coefficient of variation (CV) is 50 percent or greater.<br />
1<br />
Includes music, dance, art, or theater.<br />
2<br />
Includes academic <strong>in</strong>struction outside of school such as from a Saturday academy, learn<strong>in</strong>g center, personal tutor, or summer school program.<br />
3<br />
Total <strong>in</strong>cludes other racial/ethnic groups not shown separately <strong>in</strong> the table.<br />
NOTE: Data are based on parent responses. Parent reports about non-school-sponsored activities refer to the last 12 months. Data weighted by W1PARENT. Race categories exclude persons of Hispanic ethnicity.<br />
SOURCE: U.S. Department of <strong>Education</strong>, National Center for <strong>Education</strong> Statistics, High School Longitud<strong>in</strong>al <strong>Study</strong> of 2009, Base-Year Public-Use Data File.<br />
3<br />
Behaviors <strong>and</strong> Activities<br />
16
Chapter 4<br />
Academic Preparation <strong>and</strong> Achievement<br />
17. Read<strong>in</strong>g Achievement..........................................................................................................84<br />
18. Mathematics Achievement.................................................................................................90<br />
19. Science Achievement..........................................................................................................96<br />
20. Eighth-Grade Algebra........................................................................................................100<br />
21. N<strong>in</strong>th-Grade Mathematics.................................................................................................104<br />
22. Mathematics <strong>and</strong> Science Coursetak<strong>in</strong>g <strong>in</strong> High School................................................108<br />
23. Advanced Placement Exams............................................................................................114<br />
24. College Entrance Exams....................................................................................................118<br />
25. Graduation Rates...............................................................................................................124<br />
26. Status Dropout Rates..........................................................................................................128<br />
82 <strong>Higher</strong> <strong>Education</strong>: <strong>Gaps</strong> <strong>in</strong> <strong>Access</strong> <strong>and</strong> <strong>Persistence</strong> <strong>Study</strong>
Chapter 4 presents data on the academic preparation <strong>and</strong> achievement of males <strong>and</strong> females with<strong>in</strong> <strong>and</strong> across racial/<br />
ethnic groups <strong>in</strong> areas of study that have been shown to be critical to postsecondary access, persistence, <strong>and</strong> atta<strong>in</strong>ment.<br />
Academic preparation for college, <strong>in</strong> terms of coursetak<strong>in</strong>g <strong>and</strong> achievement <strong>in</strong> courses such as mathematics <strong>and</strong><br />
science, has been the subject of much research over the last 20 years. Studies have shown the importance of advanced<br />
mathematics <strong>and</strong> science coursetak<strong>in</strong>g <strong>in</strong> students’ successful postsecondary matriculation <strong>and</strong> degree atta<strong>in</strong>ment<br />
(Chen 2009; NCES 2003). Adelman (2006) showed that after controll<strong>in</strong>g for factors such as high school coursetak<strong>in</strong>g<br />
among National <strong>Education</strong> Longitud<strong>in</strong>al <strong>Study</strong> (NELS) sample members, gender <strong>and</strong> race were not associated with the<br />
completion of a 4-year college degree. Additionally, some 95 percent of students who had completed rigorous course<br />
sequences earned a bachelor’s degree with<strong>in</strong> 8 years of high school graduation. For example, earn<strong>in</strong>g credits beyond<br />
algebra II <strong>in</strong> high school was associated with a higher likelihood of completion of a bachelor’s degree.<br />
Algebra is known as a “gateway” course for the sequence of mathematics <strong>and</strong> science courses that prepares students<br />
for success <strong>in</strong> later school<strong>in</strong>g (Matthews <strong>and</strong> Farmer 2008; Walston <strong>and</strong> McCarroll 2010). Mathematics courses are<br />
typically organized sequentially, with enrollment <strong>in</strong> more advanced courses dependent upon completion of prerequisite<br />
courses. The earlier a student proceeds through algebra, then courses such as geometry <strong>and</strong> algebra II, the more<br />
opportunities he or she has for reach<strong>in</strong>g higher level mathematics courses (e.g., trigonometry, precalculus, <strong>and</strong> calculus)<br />
<strong>in</strong> high school. Completion of higher level mathematics courses is related to a higher likelihood of enter<strong>in</strong>g a 4-year<br />
college or university (Schneider, Swanson, <strong>and</strong> Riegle-Crumb 1998; Walston <strong>and</strong> McCarroll 2010). Recent research has<br />
related completion of advanced mathematics courses <strong>in</strong> high school with enter<strong>in</strong>g <strong>in</strong>to science, technology, eng<strong>in</strong>eer<strong>in</strong>g,<br />
<strong>and</strong> mathematics majors <strong>in</strong> college (Chen 2009; Walston <strong>and</strong> McCarroll 2010). Algebra may be <strong>in</strong>tegral to prepar<strong>in</strong>g<br />
students for success <strong>in</strong> college <strong>and</strong> the labor force, <strong>in</strong>clud<strong>in</strong>g careers <strong>in</strong> competitive mathematics- <strong>and</strong> science-related<br />
discipl<strong>in</strong>es. The National Mathematics Advisory Panel (2008) noted that complet<strong>in</strong>g algebra II coursework dur<strong>in</strong>g high<br />
school correlates positively with college graduation <strong>and</strong> employment <strong>in</strong>come. While there may be differ<strong>in</strong>g op<strong>in</strong>ions<br />
among researchers <strong>and</strong> practitioners, the panel suggested that elementary <strong>and</strong> middle school mathematics curricula<br />
should put more students on a path to enroll <strong>in</strong> algebra by the 8th grade. Look<strong>in</strong>g at <strong>in</strong>ternational data, Schmidt (2004)<br />
reported that algebra concepts are commonly taught <strong>in</strong> the 8th grade <strong>in</strong> many other countries <strong>and</strong> suggested that U.S.<br />
students would benefit from <strong>in</strong>creased opportunities for algebra <strong>in</strong>struction <strong>in</strong> the 8th grade.<br />
In a report by Horn <strong>and</strong> Kojaku (2001), a consistent advantage <strong>in</strong> college persistence was demonstrated for students<br />
who completed rigorous high school curricula, <strong>and</strong> to a lesser extent for those complet<strong>in</strong>g mid-level curricula, over their<br />
peers complet<strong>in</strong>g core curricula or lower. The highest threshold, or most rigorous curriculum, identified <strong>in</strong> the study<br />
<strong>in</strong>cluded 4 years of English, 3 years of a foreign language, 3 years of social studies, 4 years of mathematics (<strong>in</strong>clud<strong>in</strong>g<br />
precalculus or higher), 3 years of science (<strong>in</strong>clud<strong>in</strong>g biology, chemistry, <strong>and</strong> physics), <strong>and</strong> tak<strong>in</strong>g at least one Advanced<br />
Placement (AP) course or test. Even when all family background characteristics, <strong>in</strong>dicators of socioeconomic status, <strong>and</strong><br />
selectivity of first postsecondary <strong>in</strong>stitution attended were taken <strong>in</strong>to consideration, the association between complet<strong>in</strong>g<br />
a rigorous high school academic curriculum <strong>and</strong> higher levels of college persistence rema<strong>in</strong>ed. In addition, studies have<br />
shown student performance on college entrance exams such as the SAT to be a statistically significant predictor of<br />
college persistence (Camara 2005; Titus 2004).<br />
Academic Preparation <strong>and</strong> Achievement 83
Indicator 17<br />
Read<strong>in</strong>g Achievement<br />
Among 4th-graders <strong>and</strong> 8th-graders <strong>in</strong> 2011, <strong>and</strong> among 12th-graders <strong>in</strong> 2009,<br />
higher percentages of females than males scored at or above Proficient on the<br />
National Assessment of <strong>Education</strong>al Progress (NAEP) <strong>in</strong> read<strong>in</strong>g. This pattern was<br />
found for White, Black, <strong>and</strong> Hispanic students <strong>in</strong> all three grades <strong>and</strong> for Asian<br />
students <strong>in</strong> the 4th <strong>and</strong> 8th grades.<br />
In 2011, some 34 percent of both 4th- <strong>and</strong> 8th-grade<br />
students scored at or above the Proficient level on the<br />
National Assessment of <strong>Education</strong>al Progress (NAEP)<br />
read<strong>in</strong>g assessment. In 2009, the most recent year for<br />
which 12th-grade NAEP data were available, 38 percent<br />
of 12th-grade students scored at or above Proficient <strong>in</strong><br />
read<strong>in</strong>g.<br />
At the 4th- <strong>and</strong> 8th-grade levels <strong>in</strong> 2011, higher<br />
percentages of females than males scored at or above<br />
Proficient <strong>in</strong> read<strong>in</strong>g. This pattern by sex was found for<br />
all racial/ethnic groups except for Native Hawaiians/<br />
Pacific Isl<strong>and</strong>ers <strong>in</strong> the 4th grade <strong>and</strong> except for Native<br />
Hawaiians/Pacific Isl<strong>and</strong>ers <strong>and</strong> American Indians/<br />
Alaska Natives <strong>in</strong> the 8th grade. For example, among<br />
4th-graders, 20 percent of Black females scored at or<br />
above Proficient, compared with 13 percent of Black<br />
males; 20 percent of Hispanic females scored at this<br />
level, compared with 17 percent of Hispanic males;<br />
<strong>and</strong> 21 percent of American Indian/Alaska Native<br />
females scored at this level, compared with 15 percent of<br />
American Indian/Alaska Native males.<br />
At the 4th-grade level, higher percentages of Asian<br />
(50 percent) <strong>and</strong> White students (44 percent) scored at or<br />
above Proficient on the read<strong>in</strong>g assessment than students<br />
of other racial/ethnic groups <strong>in</strong> 2011. The percentage<br />
of Native Hawaiian/Pacific Isl<strong>and</strong>er 4th-graders (28<br />
percent) scor<strong>in</strong>g at or above Proficient was higher than the<br />
percentages for Hispanic (18 percent), American Indian/<br />
Alaska Native (18 percent), <strong>and</strong> Black 4th-graders (17<br />
percent). These same differences between racial/ethnic<br />
groups were also found among males <strong>and</strong> among females<br />
<strong>in</strong> the 4th grade, with the exception that no measurable<br />
differences were detected between the percentages of<br />
White females (47 percent) <strong>and</strong> females of two or more<br />
races (44 percent) scor<strong>in</strong>g at or above Proficient.<br />
Similarly, <strong>in</strong> the 8th grade, higher percentages of Asian<br />
(49 percent) <strong>and</strong> White students (43 percent) than<br />
Figure 17-1.<br />
Percentage of students scor<strong>in</strong>g at or above the Proficient level of the National Assessment of <strong>Education</strong>al<br />
Progress (NAEP) read<strong>in</strong>g assessments, by grade, race/ethnicity, <strong>and</strong> sex: 2011<br />
Percent Grade 4 Grade 8<br />
100<br />
80<br />
60<br />
40<br />
20<br />
31<br />
37<br />
40<br />
47<br />
13<br />
20<br />
17 20 47 53 27 30 15<br />
21<br />
34<br />
44<br />
29<br />
38 37<br />
49<br />
11<br />
19<br />
16<br />
22<br />
44<br />
54<br />
19<br />
29<br />
19<br />
24<br />
31<br />
45 44<br />
0<br />
Total 1 White Black Hispanic Asian Native American<br />
Hawaiian/ Indian/<br />
Pacific<br />
Isl<strong>and</strong>er<br />
Alaska<br />
Native<br />
Two or<br />
more<br />
races<br />
Total 1 White Black Hispanic Asian Native American Two or<br />
Hawaiian/ Indian/ more<br />
Pacific<br />
Isl<strong>and</strong>er<br />
Alaska<br />
Native<br />
races<br />
Race/ethnicity<br />
Male<br />
Female<br />
1<br />
Total <strong>in</strong>cludes other racial/ethnic groups not shown separately <strong>in</strong> the figure.<br />
NOTE: NAEP achievement levels def<strong>in</strong>e what students should know <strong>and</strong> be able to do. Proficient represents solid academic performance. Students reach<strong>in</strong>g<br />
this level have demonstrated competency over challeng<strong>in</strong>g subject matter. NAEP reports data on student race/ethnicity based on <strong>in</strong>formation obta<strong>in</strong>ed<br />
from school rosters. Race categories exclude persons of Hispanic ethnicity.<br />
SOURCE: U.S. Department of <strong>Education</strong>, National Center for <strong>Education</strong> Statistics, National Assessment of <strong>Education</strong>al Progress (NAEP), 2011 Read<strong>in</strong>g<br />
Assessment, NAEP Data Explorer.<br />
84 <strong>Higher</strong> <strong>Education</strong>: <strong>Gaps</strong> <strong>in</strong> <strong>Access</strong> <strong>and</strong> <strong>Persistence</strong> <strong>Study</strong>
students of other racial/ethnic groups scored at or above<br />
Proficient <strong>in</strong> 2011. Additionally, the percentages of<br />
8th-grade Native Hawaiians/Pacific Isl<strong>and</strong>ers (24 percent),<br />
American Indians/Alaska Natives (22 percent), <strong>and</strong><br />
Hispanics (19 percent) were not measurably different from<br />
each other but were higher than the percentage for Blacks<br />
(15 percent). These same differences between racial/ethnic<br />
groups were also found among males <strong>and</strong> among females<br />
<strong>in</strong> the 8th grade, with the exception that the percentage<br />
for Native Hawaiian/Pacific Isl<strong>and</strong>er females (29 percent)<br />
did not measurably differ from the percentages for<br />
American Indian/Alaska Native (24 percent), Hispanic<br />
(22 percent), or Black females (19 percent).<br />
At the 4th- <strong>and</strong> 8th-grade levels, the overall percentages<br />
of students scor<strong>in</strong>g at or above Proficient <strong>in</strong> read<strong>in</strong>g <strong>in</strong><br />
2011 were not measurably different from the percentages<br />
<strong>in</strong> 2009. However, among 8th-grade students, higher<br />
percentages of Hispanics overall as well as Hispanic males<br />
scored at or above Proficient <strong>in</strong> 2011 than <strong>in</strong> 2009. The<br />
percentage of 8th-grade Black females scor<strong>in</strong>g at or above<br />
Proficient was also higher <strong>in</strong> 2011 than <strong>in</strong> 2009 (19 vs.<br />
17 percent).<br />
As <strong>in</strong> the 4th <strong>and</strong> 8th grades <strong>in</strong> 2011, a higher percentage<br />
of 12th-grade females than males scored at or above<br />
Proficient <strong>in</strong> read<strong>in</strong>g (43 vs. 32 percent) <strong>in</strong> 2009. This<br />
pattern was also found for White, Black, <strong>and</strong> Hispanic<br />
12th-graders. For example, 22 percent of Black females<br />
scored at or above Proficient, compared with 12 percent of<br />
Black males, <strong>and</strong> 26 percent of Hispanic females scored at<br />
this level, compared with 18 percent of Hispanic males.<br />
Variations across racial/ethnic groups were also observed<br />
among 12th-graders. <strong>Higher</strong> percentages of Asian/Pacific<br />
Isl<strong>and</strong>er (49 percent) <strong>and</strong> White 12th-graders (46 percent)<br />
scored at or above Proficient <strong>in</strong> 2009 than any other racial/<br />
ethnic group shown. A higher percentage of American<br />
Indians/Alaska Natives (29 percent) <strong>and</strong> Hispanics<br />
(22 percent) scored at or above Proficient than Blacks<br />
(17 percent). Similar patterns were found for both males<br />
<strong>and</strong> females across racial/ethnic groups. For both males<br />
<strong>and</strong> females, higher percentages of Asians/Pacific Isl<strong>and</strong>ers<br />
<strong>and</strong> Whites scored at or above Proficient than the other<br />
racial/ethnic groups shown. In addition, among males,<br />
a higher percentage of Hispanic (18 percent) than Black<br />
males (12 percent) scored at or above Proficient. Among<br />
females, a higher percentage of American Indian/Alaska<br />
Native (36 percent) than Black females (22 percent)<br />
scored at or above Proficient.<br />
17<br />
Technical Notes<br />
The National Assessment of <strong>Education</strong>al Progress<br />
(NAEP) achievement levels def<strong>in</strong>e what students should<br />
know <strong>and</strong> be able to do. Basic denotes partial mastery<br />
of knowledge <strong>and</strong> skills that are fundamental for<br />
proficient work at a given grade. Proficient represents<br />
solid academic performance. Students reach<strong>in</strong>g this<br />
level have demonstrated competency over challeng<strong>in</strong>g<br />
subject matter. Advanced signifies superior performance.<br />
NAEP reports data on student race/ethnicity based on<br />
<strong>in</strong>formation obta<strong>in</strong>ed from school rosters. This <strong>in</strong>dicator<br />
presents <strong>in</strong>formation on Asians <strong>and</strong> Pacific Isl<strong>and</strong>ers as<br />
a comb<strong>in</strong>ed category for the 2009 f<strong>in</strong>d<strong>in</strong>gs because the<br />
data were collected <strong>in</strong> a manner that does not permit<br />
separate report<strong>in</strong>g prior to 2011. S<strong>in</strong>ce 96 percent of all<br />
Asian/Pacific Isl<strong>and</strong>er 5- to 24-year-olds are Asian, this<br />
comb<strong>in</strong>ed category substantially reflects the situation<br />
for Asians, rather than Pacific Isl<strong>and</strong>ers. For more<br />
<strong>in</strong>formation, please see the <strong>in</strong>troduction to this report.<br />
Preparation <strong>and</strong> Achievement<br />
4<br />
Academic Preparation <strong>and</strong> Achievement 85
86 <strong>Higher</strong> <strong>Education</strong>: <strong>Gaps</strong> <strong>in</strong> <strong>Access</strong> <strong>and</strong> <strong>Persistence</strong> <strong>Study</strong><br />
Table 17-1.<br />
Sex <strong>and</strong> race/ethnicity<br />
Sex<br />
Percentage distribution of students at National Assessment of <strong>Education</strong>al Progress (NAEP) read<strong>in</strong>g achievement levels, by grade, sex, <strong>and</strong> race/<br />
ethnicity: Various years, 2005–11<br />
Below<br />
Basic<br />
At or<br />
above<br />
Basic<br />
4th grade<br />
2007 2009 2011<br />
At or<br />
above<br />
Proficient<br />
At Advanced<br />
Below<br />
Basic<br />
At or<br />
above<br />
Basic<br />
At or<br />
above<br />
Proficient<br />
At Advanced<br />
Below<br />
Basic<br />
At or<br />
above<br />
Basic<br />
At or<br />
above<br />
Proficient<br />
Total 1 33 67 33 8 33 67 33 8 33 67 34 8<br />
Male 36 64 30 7 36 64 30 6 36 64 31 7<br />
Female 30 70 36 9 30 70 36 9 29 71 37 9<br />
Race/ethnicity<br />
White 22 78 43 11 22 78 42 10 22 78 44 11<br />
Black 54 46 14 2 52 48 16 2 51 49 17 2<br />
Hispanic 50 50 17 3 51 49 17 3 49 51 18 3<br />
Asian/Pacific Isl<strong>and</strong>er 23 77 46 15 20 80 49 16 20 80 49 17<br />
Asian — 2 — 2 — 2 — 2 — 2 — 2 — 2 — 2 19 81 50 17<br />
Native Hawaiian/Pacific Isl<strong>and</strong>er — 2 — 2 — 2 — 2 — 2 — 2 — 2 — 2 39 61 28 7<br />
American Indian/Alaska Native 51 49 18 4 50 50 20 4 53 47 18 4<br />
Two or more races — — — — — — — — 27 73 39 11<br />
At Advanced<br />
Race/ethnicity by sex<br />
Male<br />
White 25 75 39 9 25 75 39 9 24 76 40 9<br />
Black 58 42 12 1 58 42 13 1 57 43 13 2<br />
Hispanic 54 46 15 2 54 46 15 2 52 48 17 2<br />
Asian/Pacific Isl<strong>and</strong>er 27 73 41 12 24 76 41 13 23 77 46 15<br />
Asian — 2 — 2 — 2 — 2 — 2 — 2 — 2 — 2 22 78 47 15<br />
Native Hawaiian/Pacific Isl<strong>and</strong>er — 2 — 2 — 2 — 2 — 2 — 2 — 2 — 2 40 60 27 6<br />
American Indian/Alaska Native 54 46 17 3 53 47 19 4 58 42 15 3<br />
Two or more races — — — — — — — — 32 68 34 9<br />
Female<br />
White 19 81 46 12 19 81 46 12 19 81 47 13<br />
Black 49 51 17 2 46 54 18 2 45 55 20 3<br />
Hispanic 47 53 20 4 47 53 19 3 46 54 20 3<br />
Asian/Pacific Isl<strong>and</strong>er 17 82 50 17 17 83 55 19 17 83 52 19<br />
Asian — 2 — 2 — 2 — 2 — 2 — 2 — 2 — 2 16 84 53 19<br />
Native Hawaiian/Pacific Isl<strong>and</strong>er — 2 — 2 — 2 — 2 — 2 — 2 — 2 — 2 37 63 30 8<br />
American Indian/Alaska Native 49 51 20 5 47 53 21 4 47 53 21 5<br />
Two or more races — — — — — — — — 22 78 44 14<br />
See notes at end of table.
Table 17-1.<br />
Sex <strong>and</strong> race/ethnicity<br />
Sex<br />
Percentage distribution of students at National Assessment of <strong>Education</strong>al Progress (NAEP) read<strong>in</strong>g achievement levels, by grade, sex, <strong>and</strong> race/<br />
ethnicity: Various years, 2005–11—Cont<strong>in</strong>ued<br />
Below<br />
Basic<br />
At or<br />
above<br />
Basic<br />
8th grade<br />
2007 2009 2011<br />
At or<br />
above<br />
Proficient<br />
At Advanced<br />
Below<br />
Basic<br />
At or<br />
above<br />
Basic<br />
At or<br />
above<br />
Proficient<br />
At Advanced<br />
Below<br />
Basic<br />
At or<br />
above<br />
Basic<br />
At or<br />
above<br />
Proficient<br />
Total 1 26 74 31 3 25 75 32 3 24 76 34 3<br />
Male 31 69 26 2 29 71 28 2 28 72 29 2<br />
Female 21 79 36 4 21 79 37 4 20 80 38 5<br />
Race/ethnicity<br />
White 16 84 40 4 16 84 41 4 15 85 43 5<br />
Black 45 55 13 # 43 57 14 # 41 59 15 1<br />
Hispanic 42 58 15 1 39 61 17 1 36 64 19 1<br />
Asian/Pacific Isl<strong>and</strong>er 20 80 41 5 17 83 45 6 17 83 47 8<br />
Asian — 2 — 2 — 2 — 2 — 2 — 2 — 2 — 2 16 84 49 8<br />
Native Hawaiian/Pacific Isl<strong>and</strong>er — 2 — 2 — 2 — 2 — 2 — 2 — 2 — 2 37 63 24 2<br />
American Indian/Alaska Native 44 56 18 2 38 62 21 2 37 63 22 2<br />
Two or more races — — — — — — — — 21 79 39 5<br />
Race/ethnicity by sex<br />
Male<br />
White 20 80 34 2 19 81 35 3 19 81 37 3<br />
Black 53 47 8 # 50 50 10 # 47 53 11 #<br />
Hispanic 47 53 12 # 44 56 14 1 40 60 16 1<br />
Asian/Pacific Isl<strong>and</strong>er 23 77 36 4 21 79 40 4 20 80 42 5<br />
Asian — 2 — 2 — 2 — 2 — 2 — 2 — 2 — 2 18 82 44 5<br />
Native Hawaiian/Pacific Isl<strong>and</strong>er — 2 — 2 — 2 — 2 — 2 — 2 — 2 — 2 44 56 19 2<br />
American Indian/Alaska Native 50 50 14 1 44 56 18 1 42 58 19 1<br />
Two or more races — — — — — — — — 26 74 31 3<br />
At Advanced<br />
Academic Preparation <strong>and</strong> Achievement 87<br />
Female<br />
White 12 88 46 5 12 88 48 5 11 89 49 6<br />
Black 38 62 16 1 37 63 17 1 34 66 19 1<br />
Hispanic 37 63 19 1 35 65 21 1 32 68 22 1<br />
Asian/Pacific Isl<strong>and</strong>er 16 84 46 7 13 87 51 8 14 86 52 11<br />
Asian — 2 — 2 — 2 — 2 — 2 — 2 — 2 — 2 13 87 54 11<br />
Native Hawaiian/Pacific Isl<strong>and</strong>er — 2 — 2 — 2 — 2 — 2 — 2 — 2 — 2 29 71 29 2<br />
American Indian/Alaska Native 37 63 23 3 33 67 23 3 32 68 24 2<br />
Two or more races — — — — — — — — 16 84 45 6<br />
See notes at end of table.<br />
4<br />
Preparation <strong>and</strong> Achievement<br />
17
88 <strong>Higher</strong> <strong>Education</strong>: <strong>Gaps</strong> <strong>in</strong> <strong>Access</strong> <strong>and</strong> <strong>Persistence</strong> <strong>Study</strong><br />
Table 17-1.<br />
Sex <strong>and</strong> race/ethnicity<br />
Percentage distribution of students at National Assessment of <strong>Education</strong>al Progress (NAEP) read<strong>in</strong>g achievement levels, by grade, sex, <strong>and</strong> race/<br />
ethnicity: Various years, 2005–11—Cont<strong>in</strong>ued<br />
Below Basic<br />
At or<br />
above Basic<br />
12th grade<br />
2005 2009<br />
At or above<br />
Proficient At Advanced<br />
Below Basic<br />
At or<br />
above Basic<br />
At or above<br />
Proficient At Advanced<br />
Total 1 27 73 35 5 26 74 38 5<br />
Sex<br />
Male 33 67 29 3 31 69 32 4<br />
Female 22 78 41 6 20 80 43 7<br />
Race/ethnicity<br />
White 21 79 43 6 19 81 46 7<br />
Black 46 54 16 1 43 57 17 1<br />
Hispanic 40 60 20 2 39 61 22 2<br />
Asian/Pacific Isl<strong>and</strong>er 26 74 36 5 19 81 49 10<br />
Asian — 2 — 2 — 2 — 2 — 2 — 2 — 2 — 2<br />
Native Hawaiian/Pacific Isl<strong>and</strong>er — 2 — 2 — 2 — 2 — 2 — 2 — 2 — 2<br />
American Indian/Alaska Native 33 67 26 2 30 70 29 2<br />
Two or more races — — — — — — — —<br />
Race/ethnicity by sex<br />
Male<br />
White 28 72 35 4 24 76 40 5<br />
Black 53 47 12 1 51 49 12 1<br />
Hispanic 46 54 15 1 45 55 18 1<br />
Asian/Pacific Isl<strong>and</strong>er 30 70 30 4 22 78 45 8<br />
Asian — 2 — 2 — 2 — 2 — 2 — 2 — 2 — 2<br />
Native Hawaiian/Pacific Isl<strong>and</strong>er — 2 — 2 — 2 — 2 — 2 — 2 — 2 — 2<br />
American Indian/Alaska Native ‡ ‡ ‡ ‡ 42 58 20 ‡<br />
Two or more races — — — — — — — —<br />
Female<br />
White 15 85 50 8 13 87 53 9<br />
Black 40 60 19 1 36 64 22 1<br />
Hispanic 35 65 23 2 33 67 26 2<br />
Asian/Pacific Isl<strong>and</strong>er 22 78 42 7 15 85 53 13<br />
Asian — 2 — 2 — 2 — 2 — 2 — 2 — 2 — 2<br />
Native Hawaiian/Pacific Isl<strong>and</strong>er — 2 — 2 — 2 — 2 — 2 — 2 — 2 — 2<br />
American Indian/Alaska Native ‡ ‡ ‡ ‡ 19 81 36 3<br />
Two or more races — — — — — — — —<br />
— Not available.<br />
# Rounds to zero.<br />
‡ Report<strong>in</strong>g st<strong>and</strong>ards not met (too few cases).<br />
1<br />
Total <strong>in</strong>cludes other racial/ethnic groups not shown separately <strong>in</strong> the table.<br />
2<br />
Separate estimates for Asians <strong>and</strong> Native Hawaiians/Pacific Isl<strong>and</strong>ers were not available.<br />
NOTE: NAEP achievement levels def<strong>in</strong>e what students should know <strong>and</strong> be able to do. Basic denotes partial mastery of knowledge <strong>and</strong> skills that are fundamental for proficient work at a given grade. Proficient<br />
represents solid academic performance. Students reach<strong>in</strong>g this level have demonstrated competency over challeng<strong>in</strong>g subject matter. Advanced signifies superior performance. NAEP reports data on student<br />
race/ethnicity based on <strong>in</strong>formation obta<strong>in</strong>ed from school rosters. The NAEP assessment was not adm<strong>in</strong>istered to grade 12 <strong>in</strong> 2007 or 2011. Detail may not sum to totals because of round<strong>in</strong>g. Race categories<br />
exclude persons of Hispanic ethnicity.<br />
SOURCE: U.S. Department of <strong>Education</strong>, National Center for <strong>Education</strong> Statistics, National Assessment of <strong>Education</strong>al Progress (NAEP), 2005, 2007, 2009, <strong>and</strong> 2011 Read<strong>in</strong>g Assessment, NAEP Data Explorer.
17<br />
This page <strong>in</strong>tentionally left blank.<br />
Preparation <strong>and</strong> Achievement<br />
4<br />
Academic Preparation <strong>and</strong> Achievement 89
Indicator 18<br />
Mathematics Achievement<br />
Among 4th-graders <strong>and</strong> 8th-graders <strong>in</strong> 2011, <strong>and</strong> among 12th-graders <strong>in</strong> 2009,<br />
higher percentages of males than females scored at or above Proficient on the<br />
National Assessment of <strong>Education</strong>al Progress (NAEP) <strong>in</strong> mathematics. This pattern<br />
was found for White students <strong>in</strong> all three grades <strong>and</strong> for Hispanic students <strong>in</strong> the<br />
4th <strong>and</strong> 12th grades.<br />
In 2011, some 40 percent of 4th-graders <strong>and</strong> 35 percent<br />
of 8th-graders scored at or above the Proficient level on<br />
the National Assessment of <strong>Education</strong>al Progress (NAEP)<br />
mathematics assessment. In 2009, the most recent year for<br />
which 12th-grade NAEP data were available, 26 percent<br />
of 12th-graders scored at or above the Proficient level <strong>in</strong><br />
mathematics.<br />
In both the 4th <strong>and</strong> 8th grades, higher percentages of<br />
males than females scored at or above Proficient on the<br />
mathematics portion of NAEP <strong>in</strong> 2011. This pattern<br />
was also found for White <strong>and</strong> Hispanic students <strong>in</strong> the<br />
4th grade <strong>and</strong> for White students <strong>in</strong> the 8th grade. For<br />
example, 25 percent of 4th-grade Hispanic males scored at<br />
or above Proficient, compared with 22 percent of Hispanic<br />
females. In contrast, a lower percentage of 8th-grade<br />
Native Hawaiian/Pacific Isl<strong>and</strong>er males (17 percent)<br />
than females (28 percent) scored at or above Proficient <strong>in</strong><br />
mathematics. Among the rema<strong>in</strong><strong>in</strong>g racial/ethnic groups,<br />
the percentages of males <strong>and</strong> females scor<strong>in</strong>g at or above<br />
Proficient did not measurably differ at either grade level.<br />
The percentage of students who scored at or above<br />
Proficient varied across racial/ethnic groups. In both the<br />
4th <strong>and</strong> 8th grades <strong>in</strong> 2011, higher percentages of Asian<br />
students <strong>and</strong> White students scored at or above Proficient<br />
on the mathematics portion than students of other<br />
racial/ethnic groups, <strong>and</strong> Black students had the lowest<br />
percentages scor<strong>in</strong>g at or above Proficient. The percentages<br />
of Native Hawaiians/Pacific Isl<strong>and</strong>ers scor<strong>in</strong>g at or<br />
above Proficient were higher than those of Hispanics <strong>and</strong><br />
American Indians/Alaska Natives <strong>in</strong> the 4th grade <strong>and</strong><br />
higher than those of American Indians/Alaska Natives<br />
<strong>in</strong> the 8th grade. For example, 64 percent of Asian<br />
4th-graders scored at or above Proficient, compared with<br />
52 percent of Whites, 34 percent of Native Hawaiians/<br />
Pacific Isl<strong>and</strong>ers, 24 percent of Hispanics, 22 percent<br />
of American Indians/Alaska Natives, <strong>and</strong> 17 percent of<br />
Blacks. Similarly, among 8th-graders, 58 percent of Asian<br />
students scored at or above Proficient, compared with<br />
44 percent of Whites, 22 percent of Native Hawaiians/<br />
Pacific Isl<strong>and</strong>ers, 20 percent of Hispanics, 17 percent<br />
of American Indians/Alaska Natives, <strong>and</strong> 13 percent of<br />
Figure 18-1.<br />
Percentage of students scor<strong>in</strong>g at or above the Proficient level of the National Assessment of <strong>Education</strong>al<br />
Progress (NAEP) mathematics assessments, by grade, race/ethnicity, <strong>and</strong> sex: 2011<br />
Percent Grade 4 Grade 8<br />
100<br />
80<br />
60<br />
46 43<br />
13 14<br />
40<br />
20<br />
42 39<br />
54 50<br />
17 18<br />
25 22<br />
64 65 36<br />
32<br />
24 21<br />
47 44<br />
36<br />
34<br />
21 19<br />
57 59 17<br />
28<br />
18 17<br />
39 39<br />
0<br />
Total 1 White Black Hispanic Asian Native American<br />
Hawaiian/ Indian/<br />
Pacific<br />
Isl<strong>and</strong>er<br />
Alaska<br />
Native<br />
Two or<br />
more<br />
races<br />
Total 1 White Black Hispanic Asian Native American Two or<br />
Hawaiian/ Indian/ more<br />
Pacific<br />
Isl<strong>and</strong>er<br />
Alaska<br />
Native<br />
races<br />
Race/ethnicity<br />
Male<br />
Female<br />
1<br />
Total <strong>in</strong>cludes other racial/ethnic groups not shown separately <strong>in</strong> the figure.<br />
NOTE: NAEP achievement levels def<strong>in</strong>e what students should know <strong>and</strong> be able to do. Proficient represents solid academic performance. Students reach<strong>in</strong>g<br />
this level have demonstrated competency over challeng<strong>in</strong>g subject matter. NAEP reports data on student race/ethnicity based on <strong>in</strong>formation obta<strong>in</strong>ed<br />
from school rosters. Race categories exclude persons of Hispanic ethnicity.<br />
SOURCE: U.S. Department of <strong>Education</strong>, National Center for <strong>Education</strong> Statistics, National Assessment of <strong>Education</strong>al Progress (NAEP), 2011 Mathematics<br />
Assessment, NAEP Data Explorer.<br />
90 <strong>Higher</strong> <strong>Education</strong>: <strong>Gaps</strong> <strong>in</strong> <strong>Access</strong> <strong>and</strong> <strong>Persistence</strong> <strong>Study</strong>
Blacks. Similar patterns were generally observed for both<br />
males <strong>and</strong> females across racial/ethnic groups <strong>in</strong> 2011.<br />
However, <strong>in</strong> the 4th grade, the percentages of Black<br />
females (18 percent) <strong>and</strong> American Indian/Alaska Native<br />
females (21 percent) scor<strong>in</strong>g at or above Proficient were not<br />
measurably different. In the 8th grade, the percentages of<br />
White females (43 percent) <strong>and</strong> females of two or more<br />
races (39 percent) were not measurably different, nor were<br />
the percentages for Black <strong>and</strong> American Indian/Alaska<br />
Native females (14 vs. 17 percent); Native Hawaiian/<br />
Pacific Isl<strong>and</strong>er <strong>and</strong> American Indian/Alaska Native males<br />
(17 vs. 18 percent); <strong>and</strong> Native Hawaiian/Pacific Isl<strong>and</strong>er<br />
<strong>and</strong> Black males (17 vs. 13 percent).<br />
Overall, higher percentages of students scored at or above<br />
Proficient <strong>in</strong> 2011 than <strong>in</strong> 2009 <strong>in</strong> both the 4th grade<br />
(40 vs. 39 percent) <strong>and</strong> 8th grade (35 vs. 34 percent). This<br />
pattern was also found for female students at both grade<br />
levels. Similarly, among 4th-grade students, percentages<br />
were higher <strong>in</strong> 2011 than <strong>in</strong> 2009 for Whites <strong>and</strong><br />
Hispanics overall, White females, <strong>and</strong> Hispanic males <strong>and</strong><br />
females. Among 8th-grade students, percentages were<br />
higher <strong>in</strong> 2011 than <strong>in</strong> 2009 for Hispanics overall (20 vs.<br />
17 percent).<br />
As <strong>in</strong> the 4th <strong>and</strong> 8th grades <strong>in</strong> 2011, a higher<br />
percentage of 12th-grade males than females scored at<br />
or above Proficient <strong>in</strong> mathematics (28 vs. 24 percent) <strong>in</strong><br />
2009. This pattern was also found for White <strong>and</strong> Hispanic<br />
12th-graders. For example, 13 percent of Hispanic males<br />
scored at or above Proficient, compared with 9 percent of<br />
Hispanic females. In 2009, higher percentages of Asian/<br />
Pacific Isl<strong>and</strong>er students (52 percent) <strong>and</strong> White students<br />
(33 percent) scored at or above Proficient than students<br />
from any other racial/ethnic groups. A higher percentage<br />
of Hispanics (11 percent) than Blacks (6 percent) scored<br />
at or above Proficient, but the percentage for American<br />
Indians/Alaska Natives (12 percent) did not differ<br />
measurably from those for either Hispanics or Blacks. The<br />
same patterns were observed for both males <strong>and</strong> females<br />
across racial/ethnic groups.<br />
18<br />
Technical Notes<br />
The National Assessment of <strong>Education</strong>al Progress<br />
(NAEP) achievement levels def<strong>in</strong>e what students should<br />
know <strong>and</strong> be able to do. Basic denotes partial mastery<br />
of knowledge <strong>and</strong> skills that are fundamental for<br />
proficient work at a given grade. Proficient represents<br />
solid academic performance. Students reach<strong>in</strong>g this<br />
level have demonstrated competency over challeng<strong>in</strong>g<br />
subject matter. Advanced signifies superior performance.<br />
NAEP reports data on student race/ethnicity based on<br />
<strong>in</strong>formation obta<strong>in</strong>ed from school rosters. This <strong>in</strong>dicator<br />
presents <strong>in</strong>formation on Asians <strong>and</strong> Pacific Isl<strong>and</strong>ers as<br />
a comb<strong>in</strong>ed category for the 2009 f<strong>in</strong>d<strong>in</strong>gs because the<br />
data were collected <strong>in</strong> a manner that does not permit<br />
separate report<strong>in</strong>g prior to 2011. S<strong>in</strong>ce 96 percent of all<br />
Asian/Pacific Isl<strong>and</strong>er 5- to 24-year-olds are Asian, this<br />
comb<strong>in</strong>ed category substantially reflects the situation<br />
for Asians, rather than Pacific Isl<strong>and</strong>ers. For more<br />
<strong>in</strong>formation, please see the <strong>in</strong>troduction to this report.<br />
Preparation <strong>and</strong> Achievement<br />
4<br />
Academic Preparation <strong>and</strong> Achievement 91
92 <strong>Higher</strong> <strong>Education</strong>: <strong>Gaps</strong> <strong>in</strong> <strong>Access</strong> <strong>and</strong> <strong>Persistence</strong> <strong>Study</strong><br />
Table 18-1.<br />
Sex <strong>and</strong> race/ethnicity<br />
Sex<br />
Percentage distribution of students at National Assessment of <strong>Education</strong>al Progress (NAEP) mathematics achievement levels, by grade, sex, <strong>and</strong> race/<br />
ethnicity: Various years, 2005–11<br />
Below<br />
Basic<br />
At or<br />
above<br />
Basic<br />
4th grade<br />
2007 2009 2011<br />
At or<br />
above<br />
Proficient<br />
At Advanced<br />
Below<br />
Basic<br />
At or<br />
above<br />
Basic<br />
At or<br />
above<br />
Proficient<br />
At Advanced<br />
Below<br />
Basic<br />
At or<br />
above<br />
Basic<br />
At or<br />
above<br />
Proficient<br />
Total 1 18 82 39 6 18 82 39 6 18 82 40 7<br />
Male 18 82 41 7 18 82 41 7 17 83 42 8<br />
Female 18 82 37 4 18 82 37 5 18 82 39 6<br />
Race/ethnicity<br />
White 9 91 51 8 9 91 51 8 9 91 52 9<br />
Black 36 64 15 1 36 64 16 1 34 66 17 1<br />
Hispanic 30 70 22 1 29 71 22 1 28 72 24 2<br />
Asian/Pacific Isl<strong>and</strong>er 9 91 58 15 8 92 60 17 9 91 62 19<br />
Asian — 2 — 2 — 2 — 2 — 2 — 2 — 2 — 2 7 93 64 20<br />
Native Hawaiian/Pacific Isl<strong>and</strong>er — 2 — 2 — 2 — 2 — 2 — 2 — 2 — 2 23 77 34 7<br />
American Indian/Alaska Native 30 70 25 2 34 66 21 2 34 66 22 2<br />
Two or more races — — — — — — — — 13 87 45 10<br />
At Advanced<br />
Race/ethnicity by sex<br />
Male<br />
White 8 92 54 9 9 91 53 10 9 91 54 10<br />
Black 38 62 15 1 38 62 16 1 35 65 17 1<br />
Hispanic 30 70 24 2 29 71 23 2 26 74 25 2<br />
Asian/Pacific Isl<strong>and</strong>er 9 91 61 18 8 92 61 17 10 90 62 19<br />
Asian — 2 — 2 — 2 — 2 — 2 — 2 — 2 — 2 8 92 64 20<br />
Native Hawaiian/Pacific Isl<strong>and</strong>er — 2 — 2 — 2 — 2 — 2 — 2 — 2 — 2 21 79 36 5<br />
American Indian/Alaska Native 30 70 25 3 33 67 22 2 34 66 24 3<br />
Two or more races — — — — — — — — 13 87 47 12<br />
Female<br />
White 9 91 48 6 10 90 48 7 9 91 50 7<br />
Black 35 65 16 1 35 65 16 1 33 67 18 1<br />
Hispanic 31 69 20 1 30 70 20 1 29 71 22 2<br />
Asian/Pacific Isl<strong>and</strong>er 9 91 56 13 9 91 60 17 8 92 62 19<br />
Asian — 2 — 2 — 2 — 2 — 2 — 2 — 2 — 2 7 93 65 20<br />
Native Hawaiian/Pacific Isl<strong>and</strong>er — 2 — 2 — 2 — 2 — 2 — 2 — 2 — 2 25 75 32 8<br />
American Indian/Alaska Native 30 70 24 2 35 65 21 1 33 67 21 1<br />
Two or more races — — — — — — — — 13 87 44 9<br />
See notes at end of table.
Table 18-1.<br />
Sex <strong>and</strong> race/ethnicity<br />
Sex<br />
Percentage distribution of students at National Assessment of <strong>Education</strong>al Progress (NAEP) mathematics achievement levels, by grade, sex, <strong>and</strong> race/<br />
ethnicity: Various years, 2005–11—Cont<strong>in</strong>ued<br />
Below<br />
Basic<br />
At or<br />
above<br />
Basic<br />
8th grade<br />
2007 2009 2011<br />
At or<br />
above<br />
Proficient<br />
At Advanced<br />
Below<br />
Basic<br />
At or<br />
above<br />
Basic<br />
At or<br />
above<br />
Proficient<br />
At Advanced<br />
Below<br />
Basic<br />
At or<br />
above<br />
Basic<br />
At or<br />
above<br />
Proficient<br />
Total 1 29 71 32 7 27 73 34 8 27 73 35 8<br />
Male 28 72 34 8 27 73 36 9 27 73 36 9<br />
Female 29 71 30 6 28 72 32 7 27 73 34 7<br />
Race/ethnicity<br />
White 18 82 42 9 17 83 44 11 16 84 44 11<br />
Black 53 47 11 1 50 50 12 1 49 51 13 2<br />
Hispanic 45 55 15 2 43 57 17 2 39 61 20 3<br />
Asian/Pacific Isl<strong>and</strong>er 17 83 50 17 15 85 54 20 14 86 55 22<br />
Asian — 2 — 2 — 2 — 2 — 2 — 2 — 2 — 2 12 88 58 24<br />
Native Hawaiian/Pacific Isl<strong>and</strong>er — 2 — 2 — 2 — 2 — 2 — 2 — 2 — 2 41 59 22 4<br />
American Indian/Alaska Native 47 53 16 2 44 56 18 3 45 55 17 3<br />
Two or more races — — — — — — — — 22 78 39 11<br />
Race/ethnicity by sex<br />
Male<br />
White 17 83 44 11 17 83 46 12 16 84 46 12<br />
Black 53 47 11 1 52 48 12 1 51 49 13 2<br />
Hispanic 45 55 17 2 41 59 19 2 39 61 21 3<br />
Asian/Pacific Isl<strong>and</strong>er 18 82 51 19 16 84 55 21 16 84 53 24<br />
Asian — 2 — 2 — 2 — 2 — 2 — 2 — 2 — 2 14 86 57 25<br />
Native Hawaiian/Pacific Isl<strong>and</strong>er — 2 — 2 — 2 — 2 — 2 — 2 — 2 — 2 48 52 17 3<br />
American Indian/Alaska Native 46 54 18 2 42 58 20 4 46 54 18 4<br />
Two or more races — — — — — — — — 22 78 39 11<br />
At Advanced<br />
Academic Preparation <strong>and</strong> Achievement 93<br />
Female<br />
White 18 82 39 8 17 83 42 10 17 83 43 10<br />
Black 52 48 11 1 49 51 13 1 47 53 14 1<br />
Hispanic 46 54 14 2 45 55 15 2 40 60 19 2<br />
Asian/Pacific Isl<strong>and</strong>er 17 83 49 16 14 86 52 19 12 88 57 21<br />
Asian — 2 — 2 — 2 — 2 — 2 — 2 — 2 — 2 11 89 59 22<br />
Native Hawaiian/Pacific Isl<strong>and</strong>er — 2 — 2 — 2 — 2 — 2 — 2 — 2 — 2 32 68 28 6<br />
American Indian/Alaska Native 48 52 15 3 46 54 17 2 45 55 17 3<br />
Two or more races — — — — — — — — 23 77 39 11<br />
See notes at end of table.<br />
4<br />
Preparation <strong>and</strong> Achievement<br />
18
94 <strong>Higher</strong> <strong>Education</strong>: <strong>Gaps</strong> <strong>in</strong> <strong>Access</strong> <strong>and</strong> <strong>Persistence</strong> <strong>Study</strong><br />
Table 18-1.<br />
Sex <strong>and</strong> race/ethnicity<br />
Sex<br />
Percentage distribution of students at National Assessment of <strong>Education</strong>al Progress (NAEP) mathematics achievement levels, by grade, sex, <strong>and</strong> race/<br />
ethnicity: Various years, 2005–11—Cont<strong>in</strong>ued<br />
Below<br />
Basic<br />
At or<br />
above<br />
Basic<br />
12th grade<br />
2005 2009<br />
At or<br />
above<br />
Proficient<br />
At Advanced<br />
Below<br />
Basic<br />
At or<br />
above<br />
Basic<br />
At or<br />
above<br />
Proficient<br />
Total 1 39 61 23 2 36 64 26 3<br />
Male 38 62 25 3 35 65 28 4<br />
Female 40 60 21 1 37 63 24 2<br />
Race/ethnicity<br />
White 30 70 29 3 25 75 33 3<br />
Black 70 30 6 # 63 37 6 #<br />
Hispanic 60 40 8 # 55 45 11 #<br />
Asian/Pacific Isl<strong>and</strong>er 27 73 36 6 16 84 52 10<br />
Asian — 2 — 2 — 2 — 2 — 2 — 2 — 2 — 2<br />
Native Hawaiian/Pacific Isl<strong>and</strong>er — 2 — 2 — 2 — 2 — 2 — 2 — 2 — 2<br />
American Indian/Alaska Native 58 42 6 1 44 56 12 #<br />
Two or more races — — — — — — — —<br />
At Advanced<br />
Race/ethnicity by sex<br />
Male<br />
White 29 71 31 4 25 75 35 4<br />
Black 70 30 7 # 64 36 6 #<br />
Hispanic 59 41 8 1 51 49 13 1<br />
Asian/Pacific Isl<strong>and</strong>er 29 71 37 10 17 83 52 12<br />
Asian — 2 — 2 — 2 — 2 — 2 — 2 — 2 — 2<br />
Native Hawaiian/Pacific Isl<strong>and</strong>er — 2 — 2 — 2 — 2 — 2 — 2 — 2 — 2<br />
American Indian/Alaska Native ‡ ‡ ‡ ‡ 40 60 14 #<br />
Two or more races — — — — — — — —<br />
Female<br />
White 30 70 27 2 26 74 30 2<br />
Black 70 30 5 # 63 37 6 #<br />
Hispanic 62 38 8 # 58 42 9 #<br />
Asian/Pacific Isl<strong>and</strong>er 25 75 35 3 16 84 51 8<br />
Asian — 2 — 2 — 2 — 2 — 2 — 2 — 2 — 2<br />
Native Hawaiian/Pacific Isl<strong>and</strong>er — 2 — 2 — 2 — 2 — 2 — 2 — 2 — 2<br />
American Indian/Alaska Native ‡ ‡ ‡ ‡ 46 54 10 #<br />
Two or more races — — — — — — — —<br />
— Not available.<br />
# Rounds to zero.<br />
‡ Report<strong>in</strong>g st<strong>and</strong>ards not met (too few cases).<br />
1<br />
Total <strong>in</strong>cludes other racial/ethnic groups not shown separately <strong>in</strong> the table.<br />
2<br />
Separate estimates for Asians <strong>and</strong> Native Hawaiians/Pacific Isl<strong>and</strong>ers were not available.<br />
NOTE: NAEP achievement levels def<strong>in</strong>e what students should know <strong>and</strong> be able to do. Basic denotes partial mastery of knowledge <strong>and</strong> skills that are fundamental for proficient work at a given grade. Proficient<br />
represents solid academic performance. Students reach<strong>in</strong>g this level have demonstrated competency over challeng<strong>in</strong>g subject matter. Advanced signifies superior performance. NAEP reports data on student<br />
race/ethnicity based on <strong>in</strong>formation obta<strong>in</strong>ed from school rosters. The NAEP assessment was not adm<strong>in</strong>istered to grade 12 <strong>in</strong> 2007 or 2011. Detail may not sum to totals because of round<strong>in</strong>g. Race categories<br />
exclude persons of Hispanic ethnicity.<br />
SOURCE: U.S. Department of <strong>Education</strong>, National Center for <strong>Education</strong> Statistics, National Assessment of <strong>Education</strong>al Progress (NAEP), 2005, 2007, 2009, <strong>and</strong> 2011 Mathematics Assessment, NAEP Data Explorer.
18<br />
This page <strong>in</strong>tentionally left blank.<br />
Preparation <strong>and</strong> Achievement<br />
4<br />
Academic Preparation <strong>and</strong> Achievement 95
Indicator 19<br />
Science Achievement<br />
In the 4th, 8th, <strong>and</strong> 12th grades, a higher percentage of males than females scored<br />
at or above Proficient on the National Assessment of <strong>Education</strong>al Progress (NAEP)<br />
<strong>in</strong> science <strong>in</strong> 2009. This pattern held among White students <strong>in</strong> the 4th grade; White,<br />
Hispanic, Asian/Pacific Isl<strong>and</strong>er, <strong>and</strong> American Indian/Alaska Native students <strong>in</strong><br />
the 8th grade; <strong>and</strong> White <strong>and</strong> Hispanic students <strong>in</strong> the 12th grade.<br />
In 2009, some 34 percent of 4th-graders, 30 percent of<br />
8th-graders, <strong>and</strong> 21 percent of 12th-graders scored at or<br />
above the Proficient level on the National Assessment of<br />
<strong>Education</strong>al Progress (NAEP) science assessment.<br />
At all three grade levels, a higher percentage of males<br />
than females scored at or above Proficient <strong>in</strong> science. For<br />
example, 24 percent of 12th-grade males scored at or<br />
above Proficient, compared with 18 percent of 12th-grade<br />
females. This pattern by sex held among White students<br />
<strong>in</strong> the 4th grade <strong>and</strong> among White, Hispanic, Asian/<br />
Pacific Isl<strong>and</strong>er, <strong>and</strong> American Indian/Alaska Native<br />
students <strong>in</strong> the 8th grade. It also held among White <strong>and</strong><br />
Hispanic students <strong>in</strong> the 12th grade: 32 percent of White<br />
males scored at or above Proficient, compared with 22<br />
percent of White females; <strong>and</strong> 11 percent of Hispanic<br />
males scored at or above Proficient, compared with 6<br />
percent of Hispanic females.<br />
In all three grades, higher percentages of White <strong>and</strong><br />
Asian/Pacific Isl<strong>and</strong>er students scored at or above<br />
Proficient than did American Indian/Alaska Native,<br />
Hispanic, <strong>and</strong> Black students. For example, among<br />
12th-grade students, 36 percent of Asians/Pacific Isl<strong>and</strong>ers<br />
<strong>and</strong> 27 percent of Whites scored at or above Proficient,<br />
compared with 13 percent of American Indians/Alaska<br />
Natives, 8 percent of Hispanics, <strong>and</strong> 4 percent of Blacks.<br />
The percentage of Asian/Pacific Isl<strong>and</strong>er 12th-graders<br />
scor<strong>in</strong>g at or above Proficient was higher than the<br />
percentage for their White peers. At the 4th- <strong>and</strong><br />
8th-grade levels, the percentages of American Indian/<br />
Alaska Native students scor<strong>in</strong>g at or above Proficient were<br />
higher than the correspond<strong>in</strong>g percentages of Hispanics<br />
<strong>and</strong> Blacks. In addition, the percentages of Hispanics<br />
Technical Notes<br />
The National Assessment of <strong>Education</strong>al Progress<br />
(NAEP) achievement levels def<strong>in</strong>e what students should<br />
know <strong>and</strong> be able to do. Basic denotes partial mastery<br />
of knowledge <strong>and</strong> skills that are fundamental for<br />
proficient work at a given grade. Proficient represents<br />
solid academic performance. Students reach<strong>in</strong>g this<br />
level have demonstrated competency over challeng<strong>in</strong>g<br />
subject matter. Advanced signifies superior performance.<br />
NAEP reports data on student race/ethnicity based on<br />
scor<strong>in</strong>g at or above Proficient were higher than the<br />
percentages of Blacks across all three grade levels.<br />
<strong>Higher</strong> percentages of both White <strong>and</strong> Asian/Pacific<br />
Isl<strong>and</strong>er males <strong>and</strong> females scored at or above Proficient <strong>in</strong><br />
science than males <strong>and</strong> females of any other racial/ethnic<br />
groups shown, at all grade levels. However, at all three<br />
grade levels, the percentages of White males at or above<br />
Proficient did not measurably differ from the percentages<br />
of Asian/Pacific Isl<strong>and</strong>er males. The percentages of<br />
White females <strong>and</strong> Asian/Pacific Isl<strong>and</strong>er females did not<br />
measurably differ <strong>in</strong> the 4th <strong>and</strong> 8th grades. For example,<br />
among 12th-grade males, 32 percent each of Asian/<br />
Pacific Isl<strong>and</strong>er males <strong>and</strong> White males scored at or above<br />
Proficient, compared with 11 percent of Hispanic males<br />
<strong>and</strong> 5 percent of Black males. Among females <strong>in</strong> the<br />
12th grade, a higher percentage of Asians/Pacific<br />
Isl<strong>and</strong>ers than Whites scored at or above Proficient<br />
(39 vs. 22 percent).<br />
The percentages of American Indian/Alaska Native<br />
males scor<strong>in</strong>g at or above Proficient were higher than the<br />
percentages of Black males at the 4th-grade level <strong>and</strong> the<br />
percentages of Hispanic <strong>and</strong> Black males at the 8th-grade<br />
level. <strong>Higher</strong> percentages of female American Indian/<br />
Alaska Native students scored at or above Proficient than<br />
Hispanic <strong>and</strong> Black females at the 4th-grade level <strong>and</strong><br />
Black females at the 8th-grade level. <strong>Higher</strong> percentages<br />
of Hispanic males than Black males scored at or above<br />
Proficient <strong>in</strong> all grades, <strong>and</strong> higher percentages of<br />
Hispanic females than Black females scored at or above<br />
Proficient <strong>in</strong> the 4th grade.<br />
<strong>in</strong>formation obta<strong>in</strong>ed from school rosters. This <strong>in</strong>dicator<br />
presents <strong>in</strong>formation on Asians <strong>and</strong> Pacific Isl<strong>and</strong>ers as<br />
a comb<strong>in</strong>ed category because the data were collected <strong>in</strong><br />
a manner that does not permit separate report<strong>in</strong>g. S<strong>in</strong>ce<br />
96 percent of all Asian/Pacific Isl<strong>and</strong>er 5- to 24-year-olds<br />
are Asian, this comb<strong>in</strong>ed category substantially reflects<br />
the situation for Asians, rather than Pacific Isl<strong>and</strong>ers.<br />
For more <strong>in</strong>formation, please see the <strong>in</strong>troduction to this<br />
report.<br />
96 <strong>Higher</strong> <strong>Education</strong>: <strong>Gaps</strong> <strong>in</strong> <strong>Access</strong> <strong>and</strong> <strong>Persistence</strong> <strong>Study</strong>
Figure 19-1.<br />
Percentage of students scor<strong>in</strong>g at or above the Proficient level of the National Assessment of<br />
<strong>Education</strong>al Progress (NAEP) science assessment, by grade, race/ethnicity, <strong>and</strong> sex: 2009<br />
19<br />
Race/ethnicity<br />
Total 2 35<br />
32<br />
White<br />
49<br />
45<br />
10<br />
Black<br />
Grade 4<br />
11<br />
Hispanic<br />
15<br />
13<br />
44<br />
Asian/Pacific Isl<strong>and</strong>er<br />
45<br />
American Indian/Alaska Native<br />
17<br />
17<br />
Total 2<br />
34<br />
27<br />
White<br />
46<br />
37<br />
9<br />
Black<br />
Grade 8<br />
8<br />
15<br />
Hispanic<br />
10<br />
Asian/Pacific Isl<strong>and</strong>er<br />
44<br />
37<br />
American Indian/Alaska Native<br />
22<br />
12<br />
24<br />
Total 2<br />
18<br />
White<br />
32<br />
22<br />
5<br />
Black<br />
Grade 12 1<br />
4<br />
11<br />
Hispanic<br />
6<br />
Asian/Pacific Isl<strong>and</strong>er<br />
32<br />
39<br />
0 20 40 60 80 100<br />
Male<br />
Percent<br />
Female<br />
1<br />
Report<strong>in</strong>g st<strong>and</strong>ards for American Indian/Alaska Native 12th-graders were not met; therefore, data for this group are not shown <strong>in</strong> the figure.<br />
2<br />
Total <strong>in</strong>cludes other racial/ethnic groups not shown separately <strong>in</strong> the figure.<br />
NOTE: NAEP achievement levels def<strong>in</strong>e what students should know <strong>and</strong> be able to do. Proficient represents solid academic performance. Students reach<strong>in</strong>g<br />
this level have demonstrated competency over challeng<strong>in</strong>g subject matter. NAEP reports data on student race/ethnicity based on <strong>in</strong>formation obta<strong>in</strong>ed<br />
from school rosters. Separate estimates for Asians <strong>and</strong> Native Hawaiians/Pacific Isl<strong>and</strong>ers were not available. Race categories exclude persons of Hispanic<br />
ethnicity.<br />
SOURCE: U.S. Department of <strong>Education</strong>, National Center for <strong>Education</strong> Statistics, National Assessment of <strong>Education</strong>al Progress (NAEP), 2009 Science<br />
Assessment, NAEP Data Explorer.<br />
Preparation <strong>and</strong> Achievement<br />
4<br />
Academic Preparation <strong>and</strong> Achievement 97
98 <strong>Higher</strong> <strong>Education</strong>: <strong>Gaps</strong> <strong>in</strong> <strong>Access</strong> <strong>and</strong> <strong>Persistence</strong> <strong>Study</strong><br />
Table 19-1.<br />
Grade <strong>and</strong><br />
achievement level<br />
4th grade<br />
Percentage distribution of students at National Assessment of <strong>Education</strong>al Progress (NAEP) science achievement levels, by race/ethnicity, sex, grade, <strong>and</strong><br />
achievement level: 2009<br />
Total<br />
Race/ethnicity<br />
Asian/Pacific<br />
Total 1 White Black Hispanic<br />
Isl<strong>and</strong>er 2<br />
Male<br />
Female<br />
Total Male<br />
Female<br />
Total Male<br />
Female<br />
Total Male<br />
Female<br />
Total Male<br />
American Indian/<br />
Alaska Native<br />
Female<br />
Total Male<br />
Two or more races<br />
Female<br />
Total Male<br />
Below Basic 28 27 28 13 13 14 53 54 53 47 46 48 19 20 19 43 43 44 — — —<br />
At or above Basic 72 73 72 87 87 86 47 46 47 53 54 52 81 80 81 57 57 56 — — —<br />
At or above Proficient 34 35 32 47 49 45 11 10 11 14 15 13 45 44 45 17 17 17 — — —<br />
At Advanced 1 1 1 1 1 1 # # # # # # 2 2 2 # # # — — —<br />
8th grade<br />
Below Basic 37 35 38 22 21 24 67 67 67 57 54 61 27 26 28 52 47 57 — — —<br />
At or above Basic 63 65 62 78 79 76 33 33 33 43 46 39 73 74 72 48 53 43 — — —<br />
At or above Proficient 30 34 27 42 46 37 8 9 8 12 15 10 41 44 37 17 22 12 — — —<br />
At Advanced 2 2 1 2 3 1 # # # # # # 3 4 2 # # # — — —<br />
12th grade<br />
Below Basic 40 37 42 28 26 31 71 69 73 58 53 63 27 29 26 47 ‡ ‡ — — —<br />
At or above Basic 60 63 58 72 74 69 29 31 27 42 47 37 73 71 74 53 ‡ ‡ — — —<br />
At or above Proficient 21 24 18 27 32 22 4 5 4 8 11 6 36 32 39 13 ‡ ‡ — — —<br />
At Advanced 1 2 1 2 3 1 # # # # 1 # 4 5 4 # ‡ ‡ — — —<br />
— Not available.<br />
# Rounds to zero.<br />
‡ Report<strong>in</strong>g st<strong>and</strong>ards not met (too few cases).<br />
1<br />
Total <strong>in</strong>cludes other racial/ethnic groups not shown separately <strong>in</strong> the table.<br />
2<br />
Separate estimates for Asians <strong>and</strong> Native Hawaiians/Pacific Isl<strong>and</strong>ers were not available.<br />
NOTE: NAEP achievement levels def<strong>in</strong>e what students should know <strong>and</strong> be able to do. Basic denotes partial mastery of knowledge <strong>and</strong> skills that are fundamental for proficient work at a given grade. Proficient<br />
represents solid academic performance. Students reach<strong>in</strong>g this level have demonstrated competency over challeng<strong>in</strong>g subject matter. Advanced signifies superior performance. NAEP reports data on student<br />
race/ethnicity based on <strong>in</strong>formation obta<strong>in</strong>ed from school rosters. Detail may not sum to totals because of round<strong>in</strong>g. Race categories exclude persons of Hispanic ethnicity.<br />
SOURCE: U.S. Department of <strong>Education</strong>, National Center for <strong>Education</strong> Statistics, National Assessment of <strong>Education</strong>al Progress (NAEP), 2009 Science Assessment, NAEP Data Explorer.<br />
Female
19<br />
This page <strong>in</strong>tentionally left blank.<br />
Preparation <strong>and</strong> Achievement<br />
4<br />
Academic Preparation <strong>and</strong> Achievement 99
Indicator 20<br />
Eighth-Grade Algebra<br />
Of students that scored <strong>in</strong> the top half of a 5th-grade mathematics assessment,<br />
a lower percentage of males than females went on to enroll <strong>in</strong> algebra or an<br />
advanced course other than algebra <strong>in</strong> 8th grade (51 vs. 66 percent).<br />
Overall, 33 percent of 8th-grade students were enrolled<br />
<strong>in</strong> algebra <strong>and</strong> 6 percent were enrolled <strong>in</strong> an advanced<br />
course other than algebra <strong>in</strong> grade 8 <strong>in</strong> the spr<strong>in</strong>g of<br />
2007. Of the students who scored <strong>in</strong> the top half of the<br />
ECLS-K 5th-grade mathematics assessment <strong>in</strong> the spr<strong>in</strong>g<br />
of 2004, some 58 percent went on to enroll <strong>in</strong> algebra or<br />
an advanced course other than algebra <strong>in</strong> 2007.<br />
In the spr<strong>in</strong>g of 5th grade, a higher percentage of males<br />
than females scored <strong>in</strong> the top half of the mathematics<br />
assessment (54 vs. 46 percent). This pattern was also<br />
found for White students (65 vs. 57 percent) <strong>and</strong><br />
Asian students (75 vs. 50 percent). In contrast, a lower<br />
percentage of males than females who scored <strong>in</strong> the top<br />
half of the 5th-grade mathematics assessment went on to<br />
enroll <strong>in</strong> algebra or an advanced course other than algebra<br />
<strong>in</strong> grade 8 (51 vs. 66 percent). This pattern also was<br />
found for White students (54 vs. 68 percent) but was not<br />
significant for other racial/ethnic groups.<br />
The percentages of students scor<strong>in</strong>g <strong>in</strong> the top half of<br />
the 5th-grade mathematics assessment differed across<br />
racial/ethnic groups. Lower percentages of Black (24<br />
percent) <strong>and</strong> Hispanic students (36 percent) than Asian<br />
(60 percent) <strong>and</strong> White students (61 percent) scored <strong>in</strong><br />
the top half of the assessment <strong>in</strong> grade 5. In addition, a<br />
higher percentage of Hispanic than Black students scored<br />
<strong>in</strong> the top half of the mathematics assessment (36 vs.<br />
24 percent).<br />
Enrollment rates at grade 8 <strong>in</strong> algebra or an advanced<br />
course other than algebra by students who scored <strong>in</strong> the<br />
top half of the 5th-grade mathematics assessment also<br />
differed across racial/ethnic groups. For example, among<br />
students who scored <strong>in</strong> the top half of the 5th-grade<br />
assessment, the percentage of Black students enrolled<br />
<strong>in</strong> algebra or an advanced course other than algebra by<br />
8th grade (26 percent) was lower than the percentages of<br />
Asian (86 percent), White (60 percent), <strong>and</strong> Hispanic<br />
(58 percent) students enrolled. In addition, the percentage<br />
of Asian students (86 percent) who scored <strong>in</strong> the top half<br />
<strong>in</strong> grade 5 <strong>and</strong> went on to enroll <strong>in</strong> algebra or an advanced<br />
course other than algebra <strong>in</strong> grade 8 was higher than<br />
the percentages for all other racial/ethnic groups. These<br />
Figure 20-1.<br />
Percentage of spr<strong>in</strong>g 2000 first-graders who scored <strong>in</strong> the top half of the fifth-grade mathematics<br />
assessment, by race/ethnicity <strong>and</strong> sex: Spr<strong>in</strong>g 2004<br />
Percent<br />
100<br />
80<br />
75<br />
65<br />
60<br />
54<br />
46<br />
57<br />
50<br />
40<br />
36 36<br />
20<br />
28<br />
21<br />
0<br />
Total 1 White Black Hispanic Asian<br />
Race/ethnicity<br />
Male<br />
Female<br />
1<br />
Total <strong>in</strong>cludes other racial/ethnic groups not shown separately <strong>in</strong> the figure.<br />
NOTE: Estimates represent all U.S. students who attended 1st grade <strong>in</strong> the spr<strong>in</strong>g of 2000 <strong>and</strong> then were <strong>in</strong> a U.S. 8th grade <strong>in</strong> the 2006–07 school year.<br />
Estimates were weighted by C7CPTM0. Report<strong>in</strong>g st<strong>and</strong>ards for Native Hawaiian/Pacific Isl<strong>and</strong>er students, American Indian/Alaska Native students, <strong>and</strong><br />
students of two or more races were not met; therefore, data for these groups are not shown <strong>in</strong> the figure. Race categories exclude persons of Hispanic<br />
ethnicity.<br />
SOURCE: U.S. Department of <strong>Education</strong>, National Center for <strong>Education</strong> Statistics, Early Childhood Longitud<strong>in</strong>al <strong>Study</strong>, K<strong>in</strong>dergarten Class of 1998–99 (ECLS-K),<br />
K<strong>in</strong>dergarten-Eighth Grade Full Sample Public-Use Data File.<br />
100 <strong>Higher</strong> <strong>Education</strong>: <strong>Gaps</strong> <strong>in</strong> <strong>Access</strong> <strong>and</strong> <strong>Persistence</strong> <strong>Study</strong>
Figure 20-2.<br />
Percent<br />
100<br />
Percentage of spr<strong>in</strong>g 2000 first-graders who scored <strong>in</strong> the top half of the fifth-grade mathematics<br />
assessment <strong>and</strong> went on to enroll <strong>in</strong> algebra or an advanced course other than algebra <strong>in</strong> the eighth<br />
grade, by race/ethnicity <strong>and</strong> sex: Spr<strong>in</strong>g 2007<br />
92<br />
20<br />
80<br />
66<br />
68<br />
66<br />
82<br />
60<br />
51<br />
54<br />
51<br />
40<br />
34!<br />
20<br />
20!<br />
0<br />
Total 1 White Black Hispanic Asian<br />
Race/ethnicity<br />
Male<br />
Female<br />
! Interpret data with caution. The coefficient of variation (CV) for this estimate is 30 percent or greater.<br />
1<br />
Total <strong>in</strong>cludes other racial/ethnic groups not shown separately <strong>in</strong> the figure.<br />
NOTE: Estimates represent all U.S. students who attended 1st grade <strong>in</strong> the spr<strong>in</strong>g of 2000 <strong>and</strong> then were <strong>in</strong> a U.S. 8th grade <strong>in</strong> the 2006–07 school year. “Algebra<br />
or an advanced course other than algebra” <strong>in</strong>cludes algebra I, <strong>in</strong>tegrated or sequential mathematics, algebra II, <strong>and</strong> geometry. Estimates were weighted by<br />
C7CPTM0. Report<strong>in</strong>g st<strong>and</strong>ards for Native Hawaiian/Pacific Isl<strong>and</strong>er students, American Indian/Alaska Native students, <strong>and</strong> students of two or more races<br />
were not met; therefore, data for these groups are not shown <strong>in</strong> the figure. Race categories exclude persons of Hispanic ethnicity.<br />
SOURCE: U.S. Department of <strong>Education</strong>, National Center for <strong>Education</strong> Statistics, Early Childhood Longitud<strong>in</strong>al <strong>Study</strong>, K<strong>in</strong>dergarten Class of 1998–99 (ECLS-K),<br />
K<strong>in</strong>dergarten-Eighth Grade Full Sample Public-Use Data File.<br />
overall race/ethnicity patterns were similarly observed<br />
for males by race/ethnicity. However, no measurable<br />
differences were observed among females when studied by<br />
racial/ethnic group, except <strong>in</strong> the case of Black females.<br />
The percentage of Black females who scored <strong>in</strong> the top<br />
Technical Notes<br />
Data on mathematics achievement <strong>in</strong> grades 5 <strong>and</strong> 8<br />
were based on student assessments, <strong>and</strong> data on students’<br />
mathematics coursetak<strong>in</strong>g <strong>in</strong> grade 8 were based on<br />
responses from students’ mathematics teachers. Estimates<br />
represent all U.S. students who attended 1st grade <strong>in</strong><br />
the spr<strong>in</strong>g of 2000 <strong>and</strong> were then enrolled <strong>in</strong> a U.S.<br />
half <strong>in</strong> grade 5 <strong>and</strong> went on to enroll <strong>in</strong> algebra or an<br />
advanced course other than algebra <strong>in</strong> grade 8 was lower<br />
than the percentages for females of all other racial/ethnic<br />
groups.<br />
8th grade <strong>in</strong> the 2006–07 school year. The cohort<br />
represents approximately 80 percent of all 8th-grade<br />
students <strong>in</strong> the 2006–07 school year. Algebra or an<br />
advanced course other than algebra <strong>in</strong>cludes algebra I,<br />
<strong>in</strong>tegrated or sequential mathematics, algebra II, <strong>and</strong><br />
geometry.<br />
Preparation <strong>and</strong> Achievement<br />
4<br />
Academic Preparation <strong>and</strong> Achievement 101
Table 20-1. Percentage of spr<strong>in</strong>g 2000 first-graders who scored <strong>in</strong> the top half of the fifth-grade ECLS-K mathematics<br />
assessment <strong>and</strong> of those who scored <strong>in</strong> the top half, the percentage enrolled <strong>in</strong> algebra or an advanced<br />
course other than algebra <strong>in</strong> the eighth grade, by sex <strong>and</strong> race/ethnicity: Spr<strong>in</strong>g 2004 <strong>and</strong> spr<strong>in</strong>g 2007<br />
Percentage scor<strong>in</strong>g <strong>in</strong> the top half of the 5th-grade mathematics assessment<br />
Enrolled <strong>in</strong> algebra or an advanced<br />
course other than algebra <strong>in</strong> 8th grade<br />
Race/ethnicity<br />
Total Male Female Total Male Female<br />
Total 50.0 53.8 46.2 57.7 51.1 65.6<br />
White 60.8 64.8 56.6 60.3 53.7 68.3<br />
Black 24.3 28.3 20.9 25.8 19.8 ! 34.3 !<br />
Hispanic 36.3 36.3 36.2 58.4 51.3 65.6<br />
Asian 59.7 75.2 49.8 86.4 91.5 81.5<br />
Native Hawaiian/Pacific Isl<strong>and</strong>er ‡ ‡ ‡ ‡ ‡ ‡<br />
American Indian/Alaska Native ‡ ‡ ‡ ‡ ‡ ‡<br />
Two or more races 59.3 ‡ ‡ 55.4 ‡ ‡<br />
! Interpret data with caution. The coefficient of variation (CV) for this estimate is 30 percent or greater.<br />
‡ Report<strong>in</strong>g st<strong>and</strong>ards not met (too few cases).<br />
NOTE: Estimates represent all U.S. students who attended 1st grade <strong>in</strong> the spr<strong>in</strong>g of 2000 <strong>and</strong> then were <strong>in</strong> a U.S. 8th grade <strong>in</strong> the 2006–07 school year.<br />
“Algebra or an advanced course other than algebra” <strong>in</strong>cludes algebra I, <strong>in</strong>tegrated or sequential mathematics, algebra II, <strong>and</strong> geometry. Estimates<br />
were weighted by C7CPTM0. Race categories exclude persons of Hispanic ethnicity.<br />
SOURCE: U.S. Department of <strong>Education</strong>, National Center for <strong>Education</strong> Statistics, Early Childhood Longitud<strong>in</strong>al <strong>Study</strong>, K<strong>in</strong>dergarten Class of 1998–99<br />
(ECLS-K), K<strong>in</strong>dergarten-Eighth Grade Full Sample Public-Use Data File.<br />
102 <strong>Higher</strong> <strong>Education</strong>: <strong>Gaps</strong> <strong>in</strong> <strong>Access</strong> <strong>and</strong> <strong>Persistence</strong> <strong>Study</strong>
20<br />
This page <strong>in</strong>tentionally left blank.<br />
Preparation <strong>and</strong> Achievement<br />
4<br />
Academic Preparation <strong>and</strong> Achievement 103
Indicator 21<br />
N<strong>in</strong>th-Grade Mathematics<br />
In 2009, the percentages of 9th-graders who reported that they were enrolled <strong>in</strong><br />
algebra <strong>and</strong> geometry were not measurably different between males <strong>and</strong> females<br />
overall or between males <strong>and</strong> females with<strong>in</strong> each racial/ethnic group.<br />
In 2009, a nationally representative sample of 9th-grade<br />
students were asked to identify the mathematics courses<br />
<strong>in</strong> which they were currently enrolled. About 10 percent<br />
of these 9th-graders reported that they were not enrolled<br />
<strong>in</strong> a mathematics course. Among those who reported<br />
they were enrolled <strong>in</strong> at least one mathematics course,<br />
7 percent were tak<strong>in</strong>g prealgebra or review/remedial<br />
mathematics, 57 percent were tak<strong>in</strong>g algebra I, some<br />
25 percent were tak<strong>in</strong>g geometry, <strong>and</strong> 11 percent were<br />
tak<strong>in</strong>g an advanced math course other than algebra I<br />
or geometry (e.g., algebra II, trigonometry, <strong>in</strong>tegrated<br />
mathematics, statistics or probability, analytic geometry,<br />
precalculus, or calculus). In general, the percentages of<br />
9th-graders enrolled <strong>in</strong> algebra <strong>and</strong> geometry were not<br />
measurably different between males <strong>and</strong> females overall<br />
or with<strong>in</strong> each racial/ethnic group. In addition, the<br />
percentages of 9th-graders who were not enrolled <strong>in</strong> any<br />
mathematics course were not measurably different by sex.<br />
Mathematics course enrollment <strong>in</strong> the 9th grade differed<br />
across racial/ethnic groups. The percentages of 9th-graders<br />
who reported they were currently enrolled <strong>in</strong> algebra<br />
I were higher for Blacks (64 percent) <strong>and</strong> Hispanics<br />
(62 percent) than for Whites (55 percent) <strong>and</strong> Asians<br />
(29 percent). This racial/ethnic pattern was observed<br />
for male 9th-graders, <strong>and</strong> it was observed for female<br />
9th-graders as well, with the exception that no measurable<br />
difference was seen between the percentages of White <strong>and</strong><br />
Hispanic females enrolled <strong>in</strong> algebra I.<br />
The percentages of 9th-graders who reported they were<br />
enrolled <strong>in</strong> geometry were higher for Asians (46 percent),<br />
Whites (26 percent), Hispanics (23 percent), <strong>and</strong> students<br />
of two or more races (23 percent) than for Blacks (15<br />
percent) <strong>and</strong> American Indians/Alaska Natives (10<br />
percent). A similar racial/ethnic pattern was observed for<br />
female 9th-graders. However, among male 9th-graders,<br />
higher percentages of Asians (45 percent) <strong>and</strong> Whites<br />
Figure 21-1.<br />
Among 9th-grade students who reported they were currently enrolled <strong>in</strong> a mathematics course,<br />
percentage enrolled <strong>in</strong> algebra I, by race/ethnicity <strong>and</strong> sex: 2009<br />
Percent<br />
100<br />
80<br />
60<br />
57 57 55 55<br />
62<br />
65 64<br />
60<br />
61<br />
53<br />
60 61<br />
40<br />
20<br />
31<br />
28<br />
0<br />
Total 1 White Black Hispanic Asian American Indian/<br />
Alaska Native<br />
Race/ethnicity<br />
Two or<br />
more races<br />
Male<br />
Female<br />
1<br />
Total <strong>in</strong>cludes other racial/ethnic groups not shown separately <strong>in</strong> the figure.<br />
NOTE: Information on 9th-grade mathematics coursetak<strong>in</strong>g was based on student report. Report<strong>in</strong>g st<strong>and</strong>ards for Native Hawaiian/Pacific Isl<strong>and</strong>ers were not<br />
met; therefore, data for this group are not shown <strong>in</strong> the figure. Data weighted by W1STUDENT. Race categories exclude persons of Hispanic ethnicity.<br />
SOURCE: U.S. Department of <strong>Education</strong>, National Center for <strong>Education</strong> Statistics, High School Longitud<strong>in</strong>al <strong>Study</strong> of 2009, Base-Year Restricted-Use Data File.<br />
104 <strong>Higher</strong> <strong>Education</strong>: <strong>Gaps</strong> <strong>in</strong> <strong>Access</strong> <strong>and</strong> <strong>Persistence</strong> <strong>Study</strong>
Figure 21-2.<br />
Percent<br />
100<br />
Among 9th-grade students who reported they were currently enrolled <strong>in</strong> a mathematics course,<br />
percentage enrolled <strong>in</strong> geometry, by race/ethnicity <strong>and</strong> sex: 2009<br />
21<br />
80<br />
60<br />
45<br />
48<br />
40<br />
20<br />
24<br />
26 26<br />
27<br />
14<br />
16 20<br />
27<br />
25<br />
21<br />
0<br />
Total 1 White Black Hispanic Asian Two or more races<br />
Race/ethnicity<br />
Male<br />
Female<br />
1<br />
Total <strong>in</strong>cludes other racial/ethnic groups not shown separately <strong>in</strong> the figure.<br />
NOTE: Information on 9th-grade mathematics coursetak<strong>in</strong>g was based on student report. Report<strong>in</strong>g st<strong>and</strong>ards for Native Hawaiian/Pacific Isl<strong>and</strong>er males<br />
<strong>and</strong> females <strong>and</strong> American Indian/Alaska Native males were not met; therefore, data for Native Hawaiian/Pacific Isl<strong>and</strong>er males <strong>and</strong> females <strong>and</strong> American<br />
Indian/Alaska Native males <strong>and</strong> females are not shown <strong>in</strong> the figure. Data weighted by W1STUDENT. Race categories exclude persons of Hispanic ethnicity.<br />
SOURCE: U.S. Department of <strong>Education</strong>, National Center for <strong>Education</strong> Statistics, High School Longitud<strong>in</strong>al <strong>Study</strong> of 2009, Base-Year Restricted-Use Data File.<br />
(26 percent) than Hispanics (20 percent) <strong>and</strong> Blacks (14<br />
percent) were enrolled <strong>in</strong> geometry.<br />
The percentages of American Indian/Alaska Native<br />
(17 percent), Black (14 percent), <strong>and</strong> Hispanic (13 percent)<br />
9th-graders who reported they were not enrolled <strong>in</strong> a<br />
mathematics course were higher than the percentages<br />
for White (8 percent) <strong>and</strong> Asian 9th-graders (7 percent).<br />
Similar patterns <strong>in</strong> the percentages of 9th-graders not<br />
Technical Notes<br />
Information on 9th-grade mathematics coursetak<strong>in</strong>g was<br />
based on student report. Students could report enrollment<br />
<strong>in</strong> more than one mathematics course. Students could<br />
enrolled <strong>in</strong> a mathematics course were also observed by<br />
sex across the Black, Hispanic, White, <strong>and</strong> Asian racial/<br />
ethnic groups. The percentages of Black <strong>and</strong> Hispanic<br />
9th-graders who reported they were not tak<strong>in</strong>g a<br />
mathematics course were also higher than the percentage<br />
of students of two or more races who were not tak<strong>in</strong>g a<br />
mathematics course (8 percent). This racial/ethnic pattern<br />
<strong>in</strong> the percentages of 9th-graders not tak<strong>in</strong>g mathematics<br />
was also observed for female students.<br />
also report enrollment <strong>in</strong> an “other math course,” but this<br />
response category is not presented <strong>in</strong> the text.<br />
Preparation <strong>and</strong> Achievement<br />
4<br />
Academic Preparation <strong>and</strong> Achievement 105
Table 21-1.<br />
Sex <strong>and</strong> race/ethnicity<br />
Sex<br />
Percentage of 9th-grade students who reported they were enrolled <strong>in</strong> various mathematics courses, by<br />
sex <strong>and</strong> race/ethnicity: 2009<br />
Not enrolled <strong>in</strong> a<br />
mathematics<br />
course<br />
Among students currently enrolled <strong>in</strong> a mathematics course<br />
Enrolled <strong>in</strong><br />
prealgebra<br />
or review/<br />
remedial<br />
math 1<br />
Enrolled <strong>in</strong><br />
algebra I 2<br />
Enrolled <strong>in</strong><br />
geometry<br />
Enrolled <strong>in</strong> an<br />
advanced<br />
course other<br />
than algebra I<br />
<strong>and</strong> geometry 3<br />
Total 10.3 6.7 57.2 24.5 10.7<br />
Male 11.0 6.8 57.3 23.5 11.3<br />
Female 9.5 6.6 57.2 25.5 10.2<br />
Race/ethnicity<br />
White 8.4 5.8 55.1 26.3 11.3<br />
Black 14.0 9.5 63.5 15.0 11.4<br />
Hispanic 13.2 7.2 61.9 23.1 7.2<br />
Asian 7.3 4.4 ! 29.4 46.2 20.3<br />
Native Hawaiian/Pacific Isl<strong>and</strong>er ‡ ‡ ‡ ‡ ‡<br />
American Indian/Alaska Native 17.0 18.9 ! 57.3 9.9 ! 11.5 !<br />
Two or more races 8.4 7.2 60.3 22.6 11.7<br />
Race/ethnicity by sex<br />
Male<br />
White 9.2 5.9 54.8 25.6 11.6<br />
Black 15.4 10.3 62.3 14.4 12.8<br />
Hispanic 13.8 7.5 63.5 19.7 8.1<br />
Asian 8.3 4.6 ! 30.5 44.9 20.3<br />
Native Hawaiian/Pacific Isl<strong>and</strong>er ‡ ‡ ‡ ‡ ‡<br />
American Indian/Alaska Native 12.7 ! 18.4 ! 60.7 ‡ 10.8 !<br />
Two or more races 10.3 6.0 60.2 24.8 12.1<br />
Female<br />
White 7.6 5.7 55.4 27.1 10.9<br />
Black 12.8 8.8 64.5 15.5 10.3<br />
Hispanic 12.7 7.0 60.3 26.6 6.3<br />
Asian 6.3 4.3 ! 28.2 47.5 20.4<br />
Native Hawaiian/Pacific Isl<strong>and</strong>er ‡ ‡ ‡ ‡ ‡<br />
American Indian/Alaska Native 22.4 ! 19.5 ! 52.5 11.0 ! ‡<br />
Two or more races 6.6 8.4 60.5 20.5 11.3<br />
! Interpret data with caution. The coefficient of variation (CV) for this estimate is 30 percent or greater.<br />
‡ Report<strong>in</strong>g st<strong>and</strong>ards not met. Either there are too few cases or the coefficient of variation (CV) is 50 percent or greater.<br />
1<br />
Includes basic, bus<strong>in</strong>ess, consumer, functional, or general mathematics.<br />
2<br />
Includes algebra IA <strong>and</strong> IB.<br />
3<br />
Includes courses such as algebra II, trigonometry, <strong>in</strong>tegrated mathematics, statistics or probability, analytic geometry, precalculus, <strong>and</strong> calculus.<br />
NOTE: Information on 9th-grade mathematics coursetak<strong>in</strong>g was based on student report. Students could report enrollment <strong>in</strong> more than one<br />
mathematics course. Students could also report enrollment <strong>in</strong> an “other math course,” but this response category is not presented <strong>in</strong> the table. Data<br />
weighted by W1STUDENT. Race categories exclude persons of Hispanic ethnicity.<br />
SOURCE: U.S. Department of <strong>Education</strong>, National Center for <strong>Education</strong> Statistics, High School Longitud<strong>in</strong>al <strong>Study</strong> of 2009, Base-Year Restricted-Use Data<br />
File.<br />
106 <strong>Higher</strong> <strong>Education</strong>: <strong>Gaps</strong> <strong>in</strong> <strong>Access</strong> <strong>and</strong> <strong>Persistence</strong> <strong>Study</strong>
21<br />
This page <strong>in</strong>tentionally left blank.<br />
Preparation <strong>and</strong> Achievement<br />
4<br />
Academic Preparation <strong>and</strong> Achievement 107
Indicator 22<br />
Mathematics <strong>and</strong> Science Coursetak<strong>in</strong>g <strong>in</strong> High<br />
School<br />
Of high school students who graduated <strong>in</strong> 2009, a higher percentage of females<br />
(37 percent) than males (34 percent) had completed precalculus. The percentage<br />
of 2009 high school graduates who had completed biology, chemistry, <strong>and</strong> physics<br />
was lower for females (28 percent) than for males (32 percent). The percentage<br />
of Asian/Pacific Isl<strong>and</strong>er 2009 graduates who had completed precalculus or had<br />
completed biology, chemistry, <strong>and</strong> physics was higher than the percentages of<br />
2009 graduates of any other racial/ethnic group shown who had completed these<br />
courses.<br />
Some 35 percent of high school students who graduated<br />
<strong>in</strong> 2009 had completed precalculus. 3 A higher percentage<br />
of female (37 percent) than male (34 percent) students<br />
who graduated that year had completed precalculus. The<br />
same pattern was also observed for Black females <strong>and</strong><br />
males who graduated <strong>in</strong> 2009 (25 vs. 20 percent). No<br />
measurable differences by sex were observed for 2009<br />
graduates from other racial/ethnic groups.<br />
The precalculus coursetak<strong>in</strong>g pattern among high<br />
school students who graduated <strong>in</strong> 2009 varied across<br />
racial/ethnic groups. A higher percentage of Asians/<br />
Pacific Isl<strong>and</strong>ers (60 percent) than of students of any<br />
other racial/ethnic group shown who graduated that<br />
year had completed precalculus. In addition, a higher<br />
percentage of White (38 percent) high school graduates<br />
of 2009 had completed precalculus than Hispanic (26<br />
percent), Black (23 percent), <strong>and</strong> American Indian/<br />
Alaska Native (19 percent) high school graduates of that<br />
3<br />
Refers to hav<strong>in</strong>g completed at least 0.5 Carnegie credits of precalculus.<br />
year. The percentage of Hispanic high school graduates<br />
who had completed precalculus was higher than those<br />
for Black <strong>and</strong> American Indian/Alaska Native graduates.<br />
Similar patterns across racial/ethnic groups were also<br />
observed for males <strong>and</strong> females who graduated from<br />
high school <strong>in</strong> 2009. For example, 63 percent of Asian/<br />
Pacific Isl<strong>and</strong>er females <strong>and</strong> 39 percent of White females<br />
had completed precalculus, compared with 28 percent<br />
of Hispanic females, 25 percent of Black females, <strong>and</strong><br />
17 percent of American Indian/Alaska Native females.<br />
<strong>Higher</strong> percentages of Hispanic females <strong>and</strong> Black females<br />
than of American Indian/Alaska Native females had<br />
completed precalculus. No measurable differences were<br />
found between Hispanic female <strong>and</strong> Black female 2009<br />
graduates.<br />
Among 2009 high school graduates, 30 percent had<br />
completed biology, chemistry, <strong>and</strong> physics. 4 A higher<br />
4<br />
Refers to hav<strong>in</strong>g completed at least one Carnegie credit each of biology,<br />
chemistry, <strong>and</strong> physics.<br />
Figure 22-1.<br />
Percentage of high school graduates who completed precalculus <strong>and</strong> biology, chemistry, <strong>and</strong> physics <strong>in</strong><br />
high school, by race/ethnicity <strong>and</strong> sex: 2009<br />
Race/ethnicity<br />
Precalculus 1 Biology, chemistry, <strong>and</strong> physics 2<br />
Total 3<br />
0 20 40 60 80 100<br />
White<br />
34<br />
37<br />
36<br />
39<br />
32<br />
28<br />
34<br />
29<br />
Black<br />
Hispanic<br />
20<br />
25<br />
25<br />
28<br />
21<br />
22<br />
24<br />
22<br />
Asian/Pacific<br />
Isl<strong>and</strong>er<br />
58<br />
63<br />
53<br />
56<br />
American Indian/<br />
Alaska Native<br />
21<br />
17<br />
0 20 40 60 80 100<br />
Percent<br />
14<br />
13<br />
Male<br />
Female<br />
1<br />
At least 0.5 Carnegie credits of precalculus.<br />
2<br />
At least one Carnegie credit each of biology, chemistry, <strong>and</strong> physics.<br />
3<br />
Total <strong>in</strong>cludes other racial/ethnic groups not shown separately <strong>in</strong> the figure.<br />
NOTE: These data only report the percentage of graduates who earned the <strong>in</strong>dicated Carnegie credit (0.5 = one semester; 1.0 = one academic year) for<br />
each high school course. For a transcript to be <strong>in</strong>cluded <strong>in</strong> the analyses, it had to meet three requirements: (1) the graduate received either a st<strong>and</strong>ard or<br />
honors diploma, (2) the graduate’s transcript conta<strong>in</strong>ed 16 or more Carnegie credits, <strong>and</strong> (3) the graduate’s transcript conta<strong>in</strong>ed more than 0 Carnegie<br />
credits <strong>in</strong> English courses. Race categories exclude persons of Hispanic ethnicity.<br />
SOURCE: U.S. Department of <strong>Education</strong>, National Center for <strong>Education</strong> Statistics, High School Transcript <strong>Study</strong> (HSTS), 2009.<br />
108 <strong>Higher</strong> <strong>Education</strong>: <strong>Gaps</strong> <strong>in</strong> <strong>Access</strong> <strong>and</strong> <strong>Persistence</strong> <strong>Study</strong>
Figure 22-2.<br />
Percentage of high school graduates who completed precalculus <strong>and</strong> biology, chemistry, <strong>and</strong> physics <strong>in</strong><br />
high school, by sex: 2000, 2005, <strong>and</strong> 2009<br />
22<br />
Percent<br />
100<br />
Precalculus 1 Biology, chemistry, <strong>and</strong> physics 2<br />
80<br />
60<br />
40<br />
25 28 28<br />
31<br />
34 37<br />
26 24<br />
28 27<br />
32<br />
28<br />
20<br />
0<br />
2000 2005 2009<br />
2000 2005 2009<br />
Years<br />
Male<br />
Female<br />
1<br />
At least 0.5 Carnegie credits of precalculus.<br />
2<br />
At least one Carnegie credit each of biology, chemistry, <strong>and</strong> physics.<br />
NOTE: These data only report the percentage of graduates who earned the <strong>in</strong>dicated Carnegie credit (0.5 = one semester; 1.0 = one academic year) for<br />
each high school course. For a transcript to be <strong>in</strong>cluded <strong>in</strong> the analyses, it had to meet three requirements: (1) the graduate received either a st<strong>and</strong>ard or<br />
honors diploma, (2) the graduate’s transcript conta<strong>in</strong>ed 16 or more Carnegie credits, <strong>and</strong> (3) the graduate’s transcript conta<strong>in</strong>ed more than 0 Carnegie<br />
credits <strong>in</strong> English courses. Race categories exclude persons of Hispanic ethnicity.<br />
SOURCE: U.S. Department of <strong>Education</strong>, National Center for <strong>Education</strong> Statistics, High School Transcript <strong>Study</strong> (HSTS), 2000, 2005, <strong>and</strong> 2009.<br />
percentage of males (32 percent) than females (28<br />
percent) who graduated that year had completed these<br />
three courses. A similar pattern was observed for 2009<br />
graduates who were White males <strong>and</strong> females (34 vs.<br />
29 percent), but no measurable differences by sex were<br />
observed for 2009 high school graduates from other racial/<br />
ethnic groups.<br />
A higher percentage of 2009 high school graduates who<br />
were Asians/Pacific Isl<strong>and</strong>ers (54 percent) than of 2009<br />
graduates from any other racial/ethnic group shown had<br />
completed biology, chemistry, <strong>and</strong> physics . A higher<br />
percentage of White students who graduated <strong>in</strong> 2009<br />
(31 percent) had completed these three courses than<br />
Hispanics (23 percent), Blacks (22 percent), <strong>and</strong> American<br />
Indians/Alaska Natives (14 percent) who graduated <strong>in</strong><br />
2009. The percentages of Hispanic <strong>and</strong> Black 2009<br />
graduates who had completed the three science courses<br />
were also higher than the percentage of American Indian/<br />
Alaska Native 2009 graduates. A similar pattern was<br />
also observed for male <strong>and</strong> female high school graduates<br />
separately, except that no measurable differences were<br />
detected between the percentages of Black males <strong>and</strong><br />
American Indian/Alaska Native males. For example, 53<br />
percent of Asian/Pacific Isl<strong>and</strong>er males <strong>and</strong> 34 percent<br />
of White males had completed these courses, compared<br />
with 24 percent of Hispanic, 21 percent of Black, <strong>and</strong> 14<br />
percent of American Indian/Alaska Native males.<br />
A higher percentage of students who graduated from high<br />
school <strong>in</strong> 2009 completed precalculus than students who<br />
graduated <strong>in</strong> 2000 (35 vs. 27 percent). This difference<br />
<strong>in</strong> coursetak<strong>in</strong>g between the graduat<strong>in</strong>g classes of 2000<br />
<strong>and</strong> 2009 was also observed by sex <strong>and</strong> by race/ethnicity,<br />
except that no measurable difference was detected<br />
between graduates of 2000 <strong>and</strong> 2009 who were American<br />
Indians/Alaska Natives. Specifically, some 34 percent<br />
of male <strong>and</strong> 37 percent of female 2009 graduates had<br />
completed precalculus, compared with 25 percent of<br />
male <strong>and</strong> 28 percent of female 2000 graduates. Students<br />
who graduated <strong>in</strong> 2009 completed precalculus at higher<br />
percentages than those who graduated <strong>in</strong> 2000 by these<br />
races/ethnicities: Blacks (23 vs. 16 percent), Hispanics (26<br />
vs. 19 percent), Whites (38 vs. 28 percent), <strong>and</strong> Asians/<br />
Pacific Isl<strong>and</strong>ers (60 vs. 49 percent).<br />
The percentage of 2009 high school graduates who<br />
had completed the three science courses (i.e., biology,<br />
chemistry, <strong>and</strong> physics) was higher than the percentage<br />
of 2000 high school graduates who had done so: some<br />
30 percent of 2009 high school graduates had completed<br />
these courses, compared with 25 percent of 2000 high<br />
school graduates. In addition, 32 percent of male <strong>and</strong><br />
28 percent of female students who graduated from high<br />
school <strong>in</strong> 2009 had completed all of these science courses,<br />
compared with 26 percent <strong>and</strong> 24 percent, respectively,<br />
of 2000 high school graduates. By race/ethnicity, the<br />
percentages of White <strong>and</strong> Hispanic 2009 graduates who<br />
had completed biology, chemistry, <strong>and</strong> physics were<br />
higher than the correspond<strong>in</strong>g percentages of White <strong>and</strong><br />
Hispanic 2000 graduates.<br />
Preparation <strong>and</strong> Achievement<br />
4<br />
Academic Preparation <strong>and</strong> Achievement 109
Technical Notes<br />
This <strong>in</strong>dicator reports the percentage of graduates who<br />
earned the <strong>in</strong>dicated Carnegie credit (0.5 = one semester;<br />
1.0 = one academic year) for high school math <strong>and</strong> science<br />
courses accord<strong>in</strong>g to transcript data. For a transcript<br />
to be <strong>in</strong>cluded <strong>in</strong> the analyses, it had to meet three<br />
requirements: (1) the graduate received either a st<strong>and</strong>ard<br />
or honors diploma, (2) the graduate’s transcript conta<strong>in</strong>ed<br />
16 or more Carnegie credits, <strong>and</strong> (3) the graduate’s<br />
transcript conta<strong>in</strong>ed more than 0 Carnegie credits <strong>in</strong><br />
English courses. This <strong>in</strong>dicator presents <strong>in</strong>formation<br />
on Asians <strong>and</strong> Pacific Isl<strong>and</strong>ers as a comb<strong>in</strong>ed category<br />
because the data were collected <strong>in</strong> a manner that does<br />
not permit separate report<strong>in</strong>g. S<strong>in</strong>ce 96 percent of all<br />
Asian/Pacific Isl<strong>and</strong>er 5- to 24-year-olds are Asian, this<br />
comb<strong>in</strong>ed category substantially reflects the situation<br />
for Asians, rather than Pacific Isl<strong>and</strong>ers. For more<br />
<strong>in</strong>formation, please see the <strong>in</strong>troduction to this report.<br />
110 <strong>Higher</strong> <strong>Education</strong>: <strong>Gaps</strong> <strong>in</strong> <strong>Access</strong> <strong>and</strong> <strong>Persistence</strong> <strong>Study</strong>
Table 22-1. Percentage of high school graduates who completed selected mathematics <strong>and</strong> science courses <strong>in</strong> high school, by sex <strong>and</strong> race/ethnicity: 2000, 2005,<br />
<strong>and</strong> 2009<br />
Year, sex, <strong>and</strong> race/ethnicity Geometry 1 trigonometry 2<br />
Algebra II/<br />
2000<br />
Pre-<br />
Biology <strong>and</strong><br />
calculus 2 Calculus 1 Biology 1 Chemistry 1 Physics 1 chemistry 3<br />
Biology,<br />
chemistry,<br />
<strong>and</strong> physics 4<br />
Total 5 78.3 68.3 26.6 11.6 91.1 61.8 31.3 59.2 25.0<br />
Sex<br />
Male 74.8 65.2 25.3 12.1 88.9 57.7 34.1 54.3 26.3<br />
Female 81.4 71.1 27.8 11.1 93.2 65.5 28.9 63.6 23.9<br />
Race/ethnicity<br />
White 79.2 69.6 28.1 12.5 91.7 62.9 32.3 60.1 25.6<br />
Black 77.8 64.7 16.1 4.6 92.4 59.5 25.1 57.8 20.0<br />
Hispanic 72.6 60.0 19.3 5.6 87.8 52.0 23.1 50.3 17.7<br />
Asian/Pacific Isl<strong>and</strong>er 81.3 81.3 48.7 30.4 87.8 75.1 53.8 70.6 47.0<br />
American Indian/Alaska<br />
Native 65.0 60.3 12.6 2.4 ! 88.4 43.6 17.5 39.4 11.9<br />
Two or more races — — — — — — — — —<br />
Race/ethnicity by sex<br />
Male<br />
White 75.3 66.2 26.7 13.4 89.1 59.1 35.6 55.5 27.5<br />
Black 74.6 61.0 14.7 3.8 90.2 53.2 26.2 51.1 19.2<br />
Hispanic 70.0 57.9 18.0 5.6 87.4 47.0 23.6 45.2 17.6<br />
Asian/Pacific Isl<strong>and</strong>er 79.3 77.1 45.3 28.3 85.5 71.2 54.0 65.4 45.9<br />
American Indian/Alaska<br />
Native 67.6 63.7 9.5 ‡ 86.2 44.9 22.7 39.2 14.2 !<br />
Two or more races — — — — — — — — —<br />
Academic Preparation <strong>and</strong> Achievement 111<br />
Female<br />
White 82.8 72.6 29.5 11.7 94.0 66.4 29.3 64.5 24.0<br />
Black 80.3 67.5 17.4 5.3 94.1 64.5 24.4 63.1 20.7<br />
Hispanic 75.0 61.8 20.5 5.6 88.2 56.6 22.8 54.8 17.8<br />
Asian/Pacific Isl<strong>and</strong>er 83.2 85.2 51.9 32.4 89.8 78.6 53.6 75.4 48.0<br />
American Indian/Alaska<br />
Native 62.1 56.5 16.1 ‡ 91.0 42.1 11.6 ! 39.7 9.2 !<br />
Two or more races — — — — — — — — —<br />
See notes at end of table.<br />
4<br />
Preparation <strong>and</strong> Achievement<br />
22
112 <strong>Higher</strong> <strong>Education</strong>: <strong>Gaps</strong> <strong>in</strong> <strong>Access</strong> <strong>and</strong> <strong>Persistence</strong> <strong>Study</strong><br />
Table 22-1. Percentage of high school graduates who completed selected mathematics <strong>and</strong> science courses <strong>in</strong> high school, by sex <strong>and</strong> race/ethnicity: 2000, 2005,<br />
<strong>and</strong> 2009—Cont<strong>in</strong>ued<br />
Year, sex, <strong>and</strong> race/ethnicity Geometry 1 trigonometry 2<br />
Algebra II/<br />
2005<br />
Pre-<br />
Biology <strong>and</strong><br />
calculus 2 Calculus 1 Biology 1 Chemistry 1 Physics 1 chemistry 3<br />
Biology,<br />
chemistry,<br />
<strong>and</strong> physics 4<br />
Total 5 83.8 71.3 29.4 13.6 92.5 66.4 32.9 64.3 27.4<br />
Sex<br />
Male 81.9 68.0 28.0 14.0 91.0 62.7 34.9 60.3 28.2<br />
Female 85.6 74.4 30.8 13.2 93.9 70.0 31.0 68.0 26.5<br />
Race/ethnicity<br />
White 83.9 72.4 32.0 15.3 92.8 67.4 34.8 65.3 29.0<br />
Black 85.0 69.3 17.9 5.5 93.7 63.6 25.8 62.0 21.3<br />
Hispanic 81.0 63.1 20.4 6.4 89.2 59.3 23.4 57.2 18.8<br />
Asian/Pacific Isl<strong>and</strong>er 87.1 79.5 48.8 30.0 92.4 79.7 50.3 75.5 42.9<br />
American Indian/Alaska<br />
Native 73.8 67.2 15.8 7.9 ! 91.5 48.9 18.1 47.6 14.0<br />
Two or more races — — — — — — — — —<br />
Race/ethnicity by sex<br />
Male<br />
White 82.3 69.2 30.8 15.6 91.4 63.7 37.5 61.3 30.5<br />
Black 81.0 64.0 15.3 5.4 91.8 57.4 24.5 55.4 18.6<br />
Hispanic 78.8 60.5 16.8 5.9 87.7 55.7 22.7 53.7 18.2<br />
Asian/Pacific Isl<strong>and</strong>er 85.9 75.8 46.8 30.0 90.7 77.6 52.9 72.1 43.5<br />
American Indian/Alaska<br />
Native 74.3 64.3 11.4 ! 11.4 ! 90.9 48.7 19.0 47.4 11.9 !<br />
Two or more races — — — — — — — — —<br />
Female<br />
White 85.5 75.7 33.2 15.0 94.3 71.1 32.1 69.1 27.6<br />
Black 88.1 73.3 19.8 5.6 95.1 68.3 26.7 67.1 23.3<br />
Hispanic 82.9 65.4 23.7 6.8 90.5 62.5 24.0 60.3 19.4<br />
Asian/Pacific Isl<strong>and</strong>er 88.3 82.9 50.6 30.0 94.0 81.6 47.8 78.7 42.3<br />
American Indian/Alaska<br />
Native 73.4 69.5 19.3 5.1 ! 92.0 49.1 17.3 47.7 15.7<br />
Two or more races — — — — — — — — —<br />
See notes at end of table.
Table 22-1. Percentage of high school graduates who completed selected mathematics <strong>and</strong> science courses <strong>in</strong> high school, by sex <strong>and</strong> race/ethnicity: 2000, 2005,<br />
<strong>and</strong> 2009—Cont<strong>in</strong>ued<br />
Year, sex, <strong>and</strong> race/ethnicity Geometry 1 trigonometry 2<br />
Algebra II/<br />
2009<br />
Pre-<br />
Biology <strong>and</strong><br />
calculus 2 Calculus 1 Biology 1 Chemistry 1 Physics 1 chemistry 3<br />
Biology,<br />
chemistry,<br />
<strong>and</strong> physics 4<br />
Total 5 88.3 75.8 35.3 15.9 95.6 70.4 36.1 68.3 30.1<br />
Sex<br />
Male 86.6 73.8 33.8 16.1 94.9 67.4 39.2 65.0 31.9<br />
Female 89.9 77.8 36.6 15.7 96.2 73.4 33.0 71.4 28.3<br />
Race/ethnicity<br />
White 88.8 77.4 37.9 17.5 95.6 71.5 37.6 68.9 31.4<br />
Black 88.4 70.6 22.7 6.1 96.3 65.3 26.9 64.3 21.9<br />
Hispanic 87.0 71.4 26.5 8.6 94.8 65.7 28.6 64.2 22.7<br />
Asian/Pacific Isl<strong>and</strong>er 86.1 83.0 60.5 42.2 95.8 84.8 61.1 82.7 54.4<br />
American Indian/Alaska<br />
Native 81.6 66.6 18.5 6.3 94.5 44.5 19.8 43.9 13.6<br />
Two or more races — — — — — — — — —<br />
Race/ethnicity by sex<br />
Male<br />
White 86.8 75.6 36.4 17.5 95.0 68.5 41.8 65.6 34.0<br />
Black 86.7 67.6 20.2 6.2 95.4 59.7 27.5 58.5 21.2<br />
Hispanic 86.3 68.7 25.2 9.1 94.4 64.1 29.9 62.8 23.7<br />
Asian/Pacific Isl<strong>and</strong>er 85.5 81.0 58.0 41.9 94.4 81.8 61.3 78.8 52.6<br />
American Indian/Alaska<br />
Native 74.5 58.9 20.5 4.6 ! 93.2 42.5 18.3 42.0 14.3<br />
Two or more races — — — — — — — — —<br />
Academic Preparation <strong>and</strong> Achievement 113<br />
Female<br />
White 90.8 79.2 39.5 17.6 96.2 74.7 33.4 72.2 28.7<br />
Black 89.9 73.2 24.9 6.1 97.1 70.2 26.4 69.4 22.4<br />
Hispanic 87.7 73.8 27.7 8.1 95.1 67.0 27.5 65.4 21.9<br />
Asian/Pacific Isl<strong>and</strong>er 86.6 85.0 62.9 42.5 97.1 87.7 60.8 86.7 56.2<br />
American Indian/Alaska<br />
Native 87.6 73.1 16.9 7.7 ! 95.6 46.2 21.2 45.5 13.0<br />
Two or more races — — — — — — — — —<br />
— Not available.<br />
! Interpret data with caution. The coefficient of variation (CV) for this estimate is 30 percent or greater.<br />
‡ Report<strong>in</strong>g st<strong>and</strong>ards not met. Either there are too few cases or the coefficient of variation (CV) is 50 percent or greater.<br />
1<br />
Percentages are for students who earned at least one Carnegie credit.<br />
2<br />
Percentages are for students who earned at least 0.5 of a Carnegie credit.<br />
3<br />
Percentages are for students who earned at least one Carnegie credit each <strong>in</strong> biology <strong>and</strong> chemistry.<br />
4<br />
Percentages are for students who earned at least one Carnegie credit each <strong>in</strong> biology, chemistry, <strong>and</strong> physics.<br />
5<br />
Total <strong>in</strong>cludes other racial/ethnic groups not shown separately <strong>in</strong> the table.<br />
NOTE: These data only report the percentage of students who earned the <strong>in</strong>dicated Carnegie credit (0.5 = one semester; 1.0 = one academic year) for each high school course. For a transcript to be <strong>in</strong>cluded<br />
<strong>in</strong> the analyses, it had to meet three requirements: (1) the graduate received either a st<strong>and</strong>ard or honors diploma, (2) the graduate’s transcript conta<strong>in</strong>ed 16 or more Carnegie credits, <strong>and</strong> (3) the graduate’s<br />
transcript conta<strong>in</strong>ed more than 0 Carnegie credits <strong>in</strong> English courses. Race categories exclude persons of Hispanic ethnicity.<br />
SOURCE: U.S. Department of <strong>Education</strong>, National Center for <strong>Education</strong> Statistics, High School Transcript <strong>Study</strong> (HSTS), 2000, 2005, <strong>and</strong> 2009.<br />
4<br />
Preparation <strong>and</strong> Achievement<br />
22
Indicator 23<br />
Advanced Placement Exams<br />
In May 2010, a higher percentage of males than females (61 vs. 54 percent) who<br />
took an Advanced Placement (AP) exam received a score of 3 or higher <strong>in</strong> at least<br />
one subject area. This trend held across all racial/ethnic groups, with the largest<br />
difference occurr<strong>in</strong>g between American Indian/Alaska Native males <strong>and</strong> females<br />
(7 percentage po<strong>in</strong>t difference) <strong>and</strong> the smallest differences occurr<strong>in</strong>g both<br />
between Hispanic males <strong>and</strong> females <strong>and</strong> between Black males <strong>and</strong> females<br />
(3 percentage po<strong>in</strong>t difference each).<br />
In May 2010, about 58 percent of students who took an<br />
AP exam received a score of 3 or higher <strong>in</strong> at least one<br />
subject area. A higher percentage of males than females<br />
received a score of 3 or higher on any AP exam (61 vs.<br />
54 percent). This trend held across all racial/ethnic groups,<br />
with the largest difference occurr<strong>in</strong>g between American<br />
Indian/Alaska Native males <strong>and</strong> females (7 percentage<br />
po<strong>in</strong>t difference) <strong>and</strong> the smallest difference occurr<strong>in</strong>g<br />
both between Hispanic males <strong>and</strong> females <strong>and</strong> between<br />
Black males <strong>and</strong> females (3 percentage po<strong>in</strong>t difference<br />
each). In addition, there was a 6 percentage po<strong>in</strong>t<br />
difference between White males <strong>and</strong> females <strong>and</strong> a<br />
5 percentage po<strong>in</strong>t difference between Asian/Pacific<br />
Isl<strong>and</strong>er males <strong>and</strong> females.<br />
The percentage of students achiev<strong>in</strong>g a score of 3 or higher<br />
on any AP exam varied across racial/ethnic groups. Some<br />
66 percent of Asian/Pacific Isl<strong>and</strong>er test-takers received<br />
a score of 3 or higher, compared with 63 percent of<br />
White test-takers, 44 percent of American Indian/Alaska<br />
Natives, 42 percent of Hispanics, <strong>and</strong> 27 percent of Black<br />
test-takers. The same racial/ethnic patterns were observed<br />
for male <strong>and</strong> female students who took AP exams. Among<br />
males, 69 percent of Asian/Pacific Isl<strong>and</strong>ers received a<br />
Figure 23-1.<br />
Percentage of test-tak<strong>in</strong>g students receiv<strong>in</strong>g a score of 3 or higher on any Advanced Placement (AP)<br />
exams, by race/ethnicity <strong>and</strong> sex: May 2010<br />
Percent<br />
100<br />
80<br />
60<br />
40<br />
61<br />
54<br />
67<br />
60<br />
28<br />
25<br />
44<br />
41<br />
69<br />
63<br />
48<br />
41<br />
20<br />
0<br />
Total 1 White Black Hispanic Asian/Pacific<br />
Isl<strong>and</strong>er<br />
Race/ethnicity<br />
American Indian/<br />
Alaska Native<br />
Male<br />
Female<br />
1<br />
Total <strong>in</strong>cludes other racial/ethnic groups not shown separately <strong>in</strong> the figure.<br />
NOTE: Biology, Calculus AB, Chemistry, English literature <strong>and</strong> composition, <strong>and</strong> U.S. history are some of the most frequently taken AP exams (The College Board<br />
2005). The scores for all AP exam<strong>in</strong>ations range from 1 to 5, with 5 be<strong>in</strong>g the highest score. Data reported are for all students who completed an AP exam.<br />
The College Board collects racial/ethnic <strong>in</strong>formation based on the follow<strong>in</strong>g categories: American Indian/Alaska Native, Asian/Asian American, Black or<br />
African American/Afro-American, Lat<strong>in</strong>o (Chicano/Mexican, Puerto Rican, Other Lat<strong>in</strong>o), White, <strong>and</strong> Other. Black or African American refers to test-takers who<br />
identified themselves as Black or African American/Afro-American, <strong>and</strong> Hispanic or Lat<strong>in</strong>o refers to the sum of all Lat<strong>in</strong>o subgroups. Separate estimates for<br />
Asians <strong>and</strong> Native Hawaiians/Pacific Isl<strong>and</strong>ers were not available. Race categories exclude persons of Hispanic ethnicity.<br />
SOURCE: The College Board, Advanced Placement Program, National Summary Report, 2010.<br />
114 <strong>Higher</strong> <strong>Education</strong>: <strong>Gaps</strong> <strong>in</strong> <strong>Access</strong> <strong>and</strong> <strong>Persistence</strong> <strong>Study</strong>
score of 3 or higher, compared with 67 percent of White<br />
students, 48 percent of American Indian/Alaska Native<br />
students, 44 percent of Hispanic students, <strong>and</strong> 29 percent<br />
of Black students. Among females, 63 percent of Asian/<br />
Technical Notes<br />
The scores for all AP exam<strong>in</strong>ations range from 1 to 5, with<br />
5 be<strong>in</strong>g the highest score. AP exam<strong>in</strong>ations are available<br />
<strong>in</strong> over 30 different subject areas. Biology, Calculus AB,<br />
Chemistry, English literature <strong>and</strong> composition, <strong>and</strong> U.S.<br />
history are some of the most frequently taken AP exams.<br />
Data reported are for all students who completed an AP<br />
exam <strong>in</strong> any subject area <strong>in</strong> May 2010. AP exams are<br />
offered only <strong>in</strong> the month of May. This <strong>in</strong>dicator presents<br />
Pacific Isl<strong>and</strong>ers achieved a score of 3 or higher, compared<br />
with 60 percent of White students, 41 percent of<br />
American Indian/Alaska Natives, 41 percent of Hispanics,<br />
<strong>and</strong> 25 percent of Black students.<br />
<strong>in</strong>formation on Asians <strong>and</strong> Pacific Isl<strong>and</strong>ers as a comb<strong>in</strong>ed<br />
category because the data were collected <strong>in</strong> a manner that<br />
does not permit separate report<strong>in</strong>g. S<strong>in</strong>ce 96 percent of<br />
all Asian/Pacific Isl<strong>and</strong>er 5- to 24-year-olds are Asian,<br />
this comb<strong>in</strong>ed category substantially reflects the situation<br />
for Asians, rather than Pacific Isl<strong>and</strong>ers. For more<br />
<strong>in</strong>formation, please see the <strong>in</strong>troduction to this report.<br />
23<br />
Preparation <strong>and</strong> Achievement<br />
4<br />
Academic Preparation <strong>and</strong> Achievement 115
Table 23-1.<br />
Percentage of test-tak<strong>in</strong>g students receiv<strong>in</strong>g a score of 3 or higher on the Advanced Placement (AP)<br />
exams, by subject, sex, <strong>and</strong> race/ethnicity: May 2010<br />
Sex <strong>and</strong> race/ethnicity All AP exams 1 Biology<br />
Sex<br />
Calculus<br />
AB<br />
Chemistry<br />
English<br />
literature<br />
<strong>and</strong> composition<br />
U.S. History<br />
Total 2 57.5 48.7 55.1 54.1 57.2 52.5<br />
Male 61.2 55.5 59.8 60.2 57.4 56.7<br />
Female 54.5 43.8 50.1 47.2 57.1 48.9<br />
Race/ethnicity<br />
White 63.2 53.0 59.6 56.1 66.1 59.2<br />
Black 26.6 19.3 24.4 22.7 24.4 24.7<br />
Hispanic 42.2 25.0 34.4 29.0 33.6 30.3<br />
Asian/Pacific Isl<strong>and</strong>er 66.0 60.2 61.6 66.3 63.0 62.4<br />
American Indian/Alaska Native 44.2 31.1 42.2 34.7 43.7 36.7<br />
Race/ethnicity by sex<br />
Male<br />
White 66.6 60.0 64.0 62.3 66.0 63.1<br />
Black 28.5 23.2 27.9 28.5 23.4 26.2<br />
Hispanic 44.0 31.6 40.6 35.3 33.8 34.3<br />
Asian/Pacific Isl<strong>and</strong>er 68.7 65.4 64.9 70.6 61.8 64.8<br />
American Indian/Alaska Native 48.3 35.7 49.5 43.4 43.1 42.4<br />
Female<br />
White 60.3 48.0 54.7 48.7 66.2 55.7<br />
Black 25.4 17.1 21.9 18.6 24.8 23.8<br />
Hispanic 40.9 20.3 28.2 22.4 33.4 27.2<br />
Asian/Pacific Isl<strong>and</strong>er 63.4 55.9 58.4 61.6 63.8 60.3<br />
American Indian/Alaska Native 41.0 27.6 34.3 23.3 44.0 32.0<br />
1<br />
Estimates reflect the percentage of students who received a score of 3 or higher on any AP exam, <strong>in</strong>clud<strong>in</strong>g subject areas not presented <strong>in</strong> this table.<br />
2<br />
Total <strong>in</strong>cludes other racial/ethnic groups not shown separately <strong>in</strong> the table.<br />
NOTE: Biology, Calculus AB, Chemistry, English literature <strong>and</strong> composition, <strong>and</strong> U.S. history are some of the most frequently taken AP exams (The<br />
College Board 2005). The scores for all AP exam<strong>in</strong>ations range from 1 to 5, with 5 be<strong>in</strong>g the highest score. Data reported are for all students who<br />
completed an AP exam. The College Board collects racial/ethnic <strong>in</strong>formation based on the follow<strong>in</strong>g categories: American Indian/Alaskan, Asian/<br />
Asian American, Black or African American/Afro-American, Lat<strong>in</strong>o (Chicano/Mexican, Puerto Rican, Other Lat<strong>in</strong>o), White, <strong>and</strong> Other. Black or African<br />
American refers to test-takers who identified themselves as Black or African American/Afro-American, <strong>and</strong> Hispanic or Lat<strong>in</strong>o refers to the sum of all<br />
Lat<strong>in</strong>o subgroups. Separate estimates for Asians <strong>and</strong> Native Hawaiians/Pacific Isl<strong>and</strong>ers were not available. Race categories exclude persons of<br />
Hispanic ethnicity.<br />
SOURCE: The College Board, Advanced Placement Program, National Summary Report, 2010.<br />
116 <strong>Higher</strong> <strong>Education</strong>: <strong>Gaps</strong> <strong>in</strong> <strong>Access</strong> <strong>and</strong> <strong>Persistence</strong> <strong>Study</strong>
23<br />
This page <strong>in</strong>tentionally left blank.<br />
Preparation <strong>and</strong> Achievement<br />
4<br />
Academic Preparation <strong>and</strong> Achievement 117
Indicator 24<br />
College Entrance Exams<br />
A higher percentage of males than females met the ACT benchmark scores<br />
<strong>in</strong> mathematics (49 vs. 41 percent) <strong>and</strong> science (34 vs. 26 percent) <strong>in</strong> 2011. In<br />
contrast, a lower percentage of males than females met the benchmark scores <strong>in</strong><br />
English (64 vs. 69 percent) <strong>and</strong> read<strong>in</strong>g (51 vs. 53 percent).<br />
College entrance exams are typically required for<br />
acceptance at 4-year postsecondary <strong>in</strong>stitutions. This<br />
<strong>in</strong>dicator focuses on student performance on the two<br />
most prom<strong>in</strong>ent college entrance exams (the ACT<br />
<strong>and</strong> the SAT) us<strong>in</strong>g ACT college read<strong>in</strong>ess benchmark<br />
scores <strong>and</strong> SAT scores. In 2011, some 25 percent of all<br />
students who took the ACT met or exceeded the ACT<br />
college read<strong>in</strong>ess benchmark score <strong>in</strong> all four subject areas<br />
(English, mathematics, read<strong>in</strong>g, <strong>and</strong> science). A higher<br />
percentage of males than females (28 vs. 22 percent)<br />
achieved all four ACT college read<strong>in</strong>ess benchmark scores.<br />
This pattern held across all racial/ethnic groups. <strong>Higher</strong><br />
percentages of males than females achieved the four<br />
benchmark scores with<strong>in</strong> the Asian (44 vs. 37 percent),<br />
White (35 vs. 28 percent), Native Hawaiian/Pacific<br />
Isl<strong>and</strong>er (18 vs. 12 percent), Hispanic (14 vs. 9 percent),<br />
American Indian/Alaska Native (14 vs. 10 percent), <strong>and</strong><br />
Black (5 vs. 4 percent) racial/ethnic groups.<br />
In the same year, 45 percent of all students met the ACT<br />
mathematics benchmark, <strong>and</strong> 30 percent of all students<br />
met the science benchmark. A higher percentage of males<br />
than females met the benchmark score <strong>in</strong> mathematics<br />
(49 vs. 41 percent) <strong>and</strong> <strong>in</strong> science (34 vs. 26 percent).<br />
These patterns held with<strong>in</strong> all racial/ethnic groups <strong>in</strong><br />
both mathematics <strong>and</strong> science. For example, 29 percent<br />
of American Indian/Alaska Native males met the ACT<br />
mathematics benchmark, compared with 22 percent of<br />
their female peers; <strong>and</strong> 18 percent of Hispanic males met<br />
the science benchmark, compared with 12 percent of their<br />
female peers.<br />
The percentages of students who met the ACT<br />
benchmarks <strong>in</strong> mathematics <strong>and</strong> science <strong>in</strong> 2011 differed<br />
across racial/ethnic groups, but exhibited similar patterns.<br />
The highest percentage of students meet<strong>in</strong>g the science<br />
<strong>and</strong> mathematics benchmarks were Asian students<br />
(71 <strong>and</strong> 46 percent, respectively), followed by White<br />
(54 <strong>and</strong> 37 percent), Native Hawaiian/Pacific Isl<strong>and</strong>er<br />
(36 <strong>and</strong> 19 percent), Hispanic (30 <strong>and</strong> 15 percent),<br />
American Indian/Alaska Native (25 <strong>and</strong> 15 percent), <strong>and</strong><br />
Black (14 <strong>and</strong> 6 percent) students. The same racial/ethnic<br />
Figure 24-1.<br />
Percentage of ACT test-tak<strong>in</strong>g population meet<strong>in</strong>g all four college read<strong>in</strong>ess benchmark scores, by race/<br />
ethnicity <strong>and</strong> sex: 2011<br />
Percent<br />
100<br />
80<br />
60<br />
40<br />
20<br />
0<br />
28<br />
22<br />
35<br />
28<br />
5 4<br />
Total 1 White Black Hispanic Asian Native Hawaiian/<br />
Pacific Isl<strong>and</strong>er<br />
14<br />
9<br />
44<br />
37<br />
18<br />
12 14 10<br />
American Indian/<br />
Alaska Native<br />
Race/ethnicity<br />
Male<br />
Female<br />
1<br />
Total <strong>in</strong>cludes other racial/ethnic groups not shown separately <strong>in</strong> the figure.<br />
NOTE: College read<strong>in</strong>ess benchmark scores are based on the actual performance of approximately 90,000 college students from a nationally representative<br />
sample of 98 <strong>in</strong>stitutions <strong>and</strong> represent the level of achievement required for students to have a 50 percent chance of obta<strong>in</strong><strong>in</strong>g a B or higher or about a 75<br />
percent chance of obta<strong>in</strong><strong>in</strong>g a C or higher <strong>in</strong> correspond<strong>in</strong>g credit-bear<strong>in</strong>g first-year college courses. These college courses <strong>in</strong>clude English Composition,<br />
College Algebra, an <strong>in</strong>troductory social science course, <strong>and</strong> Biology. The benchmarks are median course placement values for these <strong>in</strong>stitutions <strong>and</strong> as<br />
such represent a typical set of expectations. The benchmark scores, out of a total possible score of 36, are 18 for English, 21 for Read<strong>in</strong>g, 22 for Mathematics,<br />
<strong>and</strong> 24 for Science. Estimates are based on all students who took the ACT assessment dur<strong>in</strong>g their sophomore, junior, or senior year <strong>and</strong> who graduated from<br />
high school <strong>in</strong> the spr<strong>in</strong>g of the respective year shown. Test-takers were asked to self-identify a s<strong>in</strong>gle racial/ethnic group. Race categories exclude persons of<br />
Hispanic ethnicity.<br />
SOURCE: American College Test<strong>in</strong>g Program, ACT National Scores Report, 2011.<br />
118 <strong>Higher</strong> <strong>Education</strong>: <strong>Gaps</strong> <strong>in</strong> <strong>Access</strong> <strong>and</strong> <strong>Persistence</strong> <strong>Study</strong>
Figure 24-2.<br />
Average SAT scores for the 12th-grade SAT test-tak<strong>in</strong>g population, by subject, race/ethnicity, <strong>and</strong> sex:<br />
2011<br />
24<br />
Race/ethnicity<br />
Total 1 500<br />
495<br />
White<br />
531<br />
526<br />
Critical<br />
425<br />
Black<br />
read<strong>in</strong>g<br />
430<br />
Hispanic<br />
456<br />
447<br />
Asian/Pacific Isl<strong>and</strong>er<br />
518<br />
517<br />
American Indian/Alaska Native<br />
486<br />
482<br />
531<br />
Total 1<br />
500<br />
White<br />
552<br />
520<br />
Mathematics<br />
435<br />
Black<br />
422<br />
481<br />
Hispanic<br />
449<br />
Asian/Pacific Isl<strong>and</strong>er<br />
608<br />
583<br />
American Indian/Alaska Native<br />
505<br />
473<br />
482<br />
Total 1<br />
496<br />
White<br />
507<br />
524<br />
405<br />
Black<br />
Writ<strong>in</strong>g<br />
426<br />
Hispanic<br />
439<br />
448<br />
Asian/Pacific Isl<strong>and</strong>er<br />
521<br />
534<br />
American Indian/Alaska Native<br />
456<br />
472<br />
0 400 450 500 550 600 650<br />
Score<br />
Male<br />
Female<br />
1<br />
Total <strong>in</strong>cludes other racial/ethnic groups not shown separately <strong>in</strong> the figure.<br />
NOTE: Data are for seniors who took the SAT anytime dur<strong>in</strong>g high school (through March of their senior year). If a student took a test more than once, the<br />
most recent score was used. Possible scores on each part of the SAT range from 200 to 800. The critical read<strong>in</strong>g section was formerly known as the verbal<br />
section. Test-takers were asked to self-identify a s<strong>in</strong>gle racial/ethnic group, which <strong>in</strong>cluded Mexican American, Puerto Rican, <strong>and</strong> Other Hispanic; however, for<br />
the purpose of this report these groups have been comb<strong>in</strong>ed <strong>in</strong>to Hispanic us<strong>in</strong>g a weighted average. Separate estimates for Asians <strong>and</strong> Native Hawaiians/<br />
Pacific Isl<strong>and</strong>ers were not available. Race categories exclude persons of Hispanic ethnicity.<br />
SOURCE: The College Board, College Bound Seniors, 2011.<br />
patterns of performance were found for both males <strong>and</strong><br />
females.<br />
In 2011, some 66 percent of students met the ACT<br />
English benchmark score, <strong>and</strong> 52 percent met the ACT<br />
read<strong>in</strong>g benchmark score. Lower percentages of males<br />
than females met the benchmark scores <strong>in</strong> English (64 vs.<br />
69 percent) <strong>and</strong> read<strong>in</strong>g (51 vs. 53 percent). Males also<br />
met the English benchmark at a lower rate than females<br />
by race/ethnicity. For example, 31 percent of Black males<br />
met the ACT English benchmark, compared with<br />
38 percent of Black females. The percentages of White,<br />
Black, Asian, Native Hawaiian/Pacific Isl<strong>and</strong>er, <strong>and</strong><br />
American Indian/Alaska Native males who met the ACT<br />
read<strong>in</strong>g benchmark were lower than the percentages<br />
of their female peers who met it. This pattern was not<br />
observed, however, <strong>in</strong> reference to the percentages of<br />
Hispanic males <strong>and</strong> females who met the ACT read<strong>in</strong>g<br />
benchmark.<br />
The percentages of students meet<strong>in</strong>g the ACT English <strong>and</strong><br />
read<strong>in</strong>g benchmarks varied across racial/ethnic groups.<br />
<strong>Higher</strong> percentages of White (77 percent) <strong>and</strong> Asian<br />
(76 percent) students met the English benchmark than<br />
Native Hawaiian/Pacific Isl<strong>and</strong>er (55 percent), American<br />
Indian/Alaska Native (47 percent), Hispanic (47 percent),<br />
<strong>and</strong> Black (35 percent) students. This racial/ethnic pattern<br />
was also observed for the percentages of students meet<strong>in</strong>g<br />
Preparation <strong>and</strong> Achievement<br />
4<br />
Academic Preparation <strong>and</strong> Achievement 119
the read<strong>in</strong>g benchmark. Similar racial/ethnic patterns of<br />
performance <strong>in</strong> English <strong>and</strong> read<strong>in</strong>g were observed for<br />
both males <strong>and</strong> females.<br />
In terms of SAT scores <strong>in</strong> 2011, the average score on the<br />
SAT critical read<strong>in</strong>g section was 497 out of 800. Males<br />
had higher critical read<strong>in</strong>g scores, on average, than<br />
females (500 vs. 495 po<strong>in</strong>ts). This trend was observed for<br />
White, Hispanic, Asian/Pacific Isl<strong>and</strong>er, <strong>and</strong> American<br />
Indian/Alaska Native students, with the largest difference<br />
observed between Hispanic males <strong>and</strong> females (a 9-po<strong>in</strong>t<br />
difference) <strong>and</strong> the smallest difference observed between<br />
Asian/Pacific Isl<strong>and</strong>er males <strong>and</strong> females (a 1-po<strong>in</strong>t<br />
difference). In contrast, Black males scored 5 po<strong>in</strong>ts lower<br />
than females on the critical read<strong>in</strong>g section.<br />
Average critical read<strong>in</strong>g scores on the SAT varied across<br />
racial/ethnic groups. The highest average score on the<br />
critical read<strong>in</strong>g test was achieved by White students<br />
(528 po<strong>in</strong>ts), followed by Asian/Pacific Isl<strong>and</strong>er<br />
(517 po<strong>in</strong>ts), American Indian/Alaska Native (484 po<strong>in</strong>ts),<br />
Hispanic (451 po<strong>in</strong>ts), <strong>and</strong> Black students (428 po<strong>in</strong>ts).<br />
The same racial/ethnic patterns of performance were<br />
found for males <strong>and</strong> females.<br />
In the same year, the average score on the mathematics<br />
section of the SAT was 514 po<strong>in</strong>ts. Males had higher<br />
mathematics scores, on average, than females (531 vs.<br />
500 po<strong>in</strong>ts). This pattern held for all racial/ethnic groups.<br />
The largest male-female score difference occurred for<br />
Hispanic students (a 33-po<strong>in</strong>t difference), followed by<br />
White <strong>and</strong> American Indian/Alaska Native (a 32-po<strong>in</strong>t<br />
Technical Notes<br />
The ACT consists of four sections: English, mathematics,<br />
read<strong>in</strong>g, <strong>and</strong> science. Scores for each section range from<br />
0 to 36. College read<strong>in</strong>ess benchmark scores are based<br />
on the actual performance of approximately 90,000<br />
college students from a nationally representative sample<br />
of 98 <strong>in</strong>stitutions <strong>and</strong> represent the level of achievement<br />
required for students to have a 50 percent chance of<br />
obta<strong>in</strong><strong>in</strong>g a B or higher or about a 75 percent chance of<br />
obta<strong>in</strong><strong>in</strong>g a C or higher <strong>in</strong> correspond<strong>in</strong>g credit-bear<strong>in</strong>g<br />
first-year college courses. These college courses <strong>in</strong>clude<br />
English composition, college algebra, an <strong>in</strong>troductory<br />
social science course, <strong>and</strong> biology. The benchmarks are<br />
median course placement values for these <strong>in</strong>stitutions <strong>and</strong><br />
as such represent a typical set of expectations.<br />
The benchmark scores, out of a total possible score of<br />
36, are 18 for English, 21 for read<strong>in</strong>g, 22 for mathematics,<br />
<strong>and</strong> 24 for science. Estimates are based on all students<br />
who took the ACT assessment dur<strong>in</strong>g their sophomore,<br />
difference for each), Asian/Pacific Isl<strong>and</strong>er (a 25-po<strong>in</strong>t<br />
difference), <strong>and</strong> Black students (a 13-po<strong>in</strong>t difference).<br />
Average mathematics scores varied across racial/ethnic<br />
groups. Asian/Pacific Isl<strong>and</strong>er students had the highest<br />
average mathematics score (595 po<strong>in</strong>ts), followed by<br />
White (535 po<strong>in</strong>ts), American Indian/Alaska Native<br />
(488 po<strong>in</strong>ts), Hispanic (463 po<strong>in</strong>ts), <strong>and</strong> Black students<br />
(427 po<strong>in</strong>ts). The same racial/ethnic patterns of<br />
performance were found for males <strong>and</strong> females.<br />
In 2011, the average score on the writ<strong>in</strong>g section of the<br />
SAT was 489 po<strong>in</strong>ts. Males had lower average writ<strong>in</strong>g<br />
scores than females overall (482 vs. 496 po<strong>in</strong>ts), as<br />
well as with<strong>in</strong> racial/ethnic groups, with the largest<br />
average writ<strong>in</strong>g performance difference between males<br />
<strong>and</strong> females occurr<strong>in</strong>g for Black students (a 21-po<strong>in</strong>t<br />
difference), followed by White students (a 17-po<strong>in</strong>t<br />
difference), American Indian/Alaska Native students<br />
(a 16-po<strong>in</strong>t difference), Asian/Pacific Isl<strong>and</strong>er students<br />
(a 13-po<strong>in</strong>t difference), <strong>and</strong> Hispanic students (an 8-po<strong>in</strong>t<br />
difference).<br />
Racial/ethnic patterns of performance for writ<strong>in</strong>g scores<br />
were similar to the racial/ethnic patterns of performance<br />
for mathematics scores. Asian/Pacific Isl<strong>and</strong>er students<br />
achieved the highest average writ<strong>in</strong>g score (528 po<strong>in</strong>ts),<br />
followed by White (516 po<strong>in</strong>ts), American Indian/Alaska<br />
Native (465 po<strong>in</strong>ts), Hispanic (444 po<strong>in</strong>ts), <strong>and</strong> Black<br />
students (417 po<strong>in</strong>ts). The same racial/ethnic patterns of<br />
performance were found for males <strong>and</strong> females.<br />
junior, or senior year <strong>and</strong> who graduated from high school<br />
<strong>in</strong> the spr<strong>in</strong>g of the respective year shown. The SAT<br />
<strong>in</strong>cludes a critical read<strong>in</strong>g section, a writ<strong>in</strong>g section, <strong>and</strong><br />
a mathematics section, each scored on a scale rang<strong>in</strong>g<br />
from 200 to 800 po<strong>in</strong>ts. Data are for seniors who took<br />
the SAT anytime dur<strong>in</strong>g high school (through March of<br />
their senior year). If a student took a test more than once,<br />
the most recent score was used. The SAT <strong>in</strong>formation on<br />
Asians <strong>and</strong> Pacific Isl<strong>and</strong>ers is presented as a comb<strong>in</strong>ed<br />
category because the data were collected <strong>in</strong> a manner that<br />
does not permit separate report<strong>in</strong>g. S<strong>in</strong>ce 96 percent of<br />
all Asian/Pacific Isl<strong>and</strong>er 5- to 24-year-olds are Asian,<br />
this comb<strong>in</strong>ed category substantially reflects the situation<br />
for Asians, rather than Pacific Isl<strong>and</strong>ers. Data used to<br />
calculate gaps discussed <strong>in</strong> the text are unrounded <strong>and</strong>,<br />
therefore, may be different from calculations us<strong>in</strong>g the<br />
rounded data from the accompany<strong>in</strong>g table. For more<br />
<strong>in</strong>formation, please see the <strong>in</strong>troduction to this report.<br />
120 <strong>Higher</strong> <strong>Education</strong>: <strong>Gaps</strong> <strong>in</strong> <strong>Access</strong> <strong>and</strong> <strong>Persistence</strong> <strong>Study</strong>
Table 24-1.<br />
Percentage of ACT test-tak<strong>in</strong>g population meet<strong>in</strong>g college read<strong>in</strong>ess benchmark scores, by subject, sex,<br />
<strong>and</strong> race/ethnicity: 2010 <strong>and</strong> 2011<br />
All four subjects Mathematics Science English Read<strong>in</strong>g<br />
Sex <strong>and</strong> race/ethnicity 2010 2011 2010 2011 2010 2011 2010 2011 2010 2011<br />
Sex<br />
Total 1 24 25 43 45 29 30 66 66 52 52<br />
Male 28 28 48 49 34 34 64 64 51 51<br />
Female 21 22 40 41 25 26 69 69 53 53<br />
24<br />
Race/ethnicity<br />
White 30 31 52 54 36 37 77 77 62 62<br />
Black 4 4 13 14 6 6 34 35 21 21<br />
Hispanic 11 11 27 30 14 15 46 47 34 35<br />
Asian/Pacific Isl<strong>and</strong>er 39 — 68 — 44 — 76 — 61 —<br />
Asian — 2 41 — 2 71 — 2 46 — 2 76 — 2 62<br />
Native Hawaiian/<br />
Pacific Isl<strong>and</strong>er 2 — 2 15 — 2 36 — 2 19 — 2 55 — 2 39<br />
American Indian/Alaska Native 12 11 26 25 17 15 50 47 39 36<br />
Race/ethnicity by sex<br />
Male<br />
White 34 35 56 58 42 42 74 74 60 60<br />
Black 4 5 14 15 7 7 30 31 18 19<br />
Hispanic 13 14 32 35 18 18 44 46 34 35<br />
Asian/Pacific Isl<strong>and</strong>er 43 — 72 — 50 — 74 — 61 —<br />
Asian 2 — 2 44 — 2 74 — 2 51 — 2 74 — 2 61<br />
Native Hawaiian/<br />
Pacific Isl<strong>and</strong>er 2 — 2 18 — 2 40 — 2 22 — 2 52 — 2 38<br />
American Indian/Alaska<br />
Native 15 14 30 29 21 19 47 44 38 35<br />
Female<br />
White 27 28 48 50 32 33 80 80 63 64<br />
Black 4 4 12 13 6 6 37 38 23 23<br />
Hispanic 9 9 24 26 11 12 47 49 34 35<br />
Asian/Pacific Isl<strong>and</strong>er 36 — 65 — 40 — 78 — 62 —<br />
Asian 2 — 2 37 — 2 69 — 2 41 — 2 78 — 2 63<br />
Native Hawaiian/<br />
Pacific Isl<strong>and</strong>er 2 — 2 12 — 2 32 — 2 16 — 2 58 — 2 39<br />
American Indian/Alaska<br />
Native 10 10 22 22 14 12 53 49 40 37<br />
— Not available.<br />
1<br />
Total <strong>in</strong>cludes other racial/ethnic groups not shown separately <strong>in</strong> the table.<br />
2<br />
Asian <strong>and</strong> Native Hawaiian/Pacific Isl<strong>and</strong>er estimates are only available as a comb<strong>in</strong>ed category <strong>and</strong> cannot be separated.<br />
NOTE: College read<strong>in</strong>ess benchmark scores are based on the actual performance of approximately 90,000 college students from a nationally<br />
representative sample of 98 <strong>in</strong>stitutions <strong>and</strong> represent the level of achievement required for students to have a 50 percent chance of obta<strong>in</strong><strong>in</strong>g a B<br />
or higher or about a 75 percent chance of obta<strong>in</strong><strong>in</strong>g a C or higher <strong>in</strong> correspond<strong>in</strong>g credit-bear<strong>in</strong>g first-year college courses. These college courses<br />
<strong>in</strong>clude English Composition, College Algebra, an <strong>in</strong>troductory social science course, <strong>and</strong> Biology. The benchmarks are median course placement<br />
values for these <strong>in</strong>stitutions <strong>and</strong> as such represent a typical set of expectations. The benchmark scores, out of a total possible score of 36, are 18<br />
for English, 21 for Read<strong>in</strong>g, 22 for Mathematics, <strong>and</strong> 24 for Science. Estimates are based on all students who took the ACT assessment dur<strong>in</strong>g their<br />
sophomore, junior, or senior year <strong>and</strong> who graduated from high school <strong>in</strong> the spr<strong>in</strong>g of the respective year shown. Test-takers were asked to self-identify<br />
a s<strong>in</strong>gle racial/ethnic group. Race categories exclude persons of Hispanic ethnicity.<br />
SOURCE: American College Test<strong>in</strong>g Program, ACT National Scores Report, 2010 <strong>and</strong> 2011.<br />
Preparation <strong>and</strong> Achievement<br />
4<br />
Academic Preparation <strong>and</strong> Achievement 121
Table 24-2.<br />
Average SAT scores for students who took the SAT dur<strong>in</strong>g high school, by subject, sex, <strong>and</strong> race/ethnicity:<br />
Selected years, 2008–11<br />
Critical read<strong>in</strong>g Mathematics Writ<strong>in</strong>g<br />
Sex <strong>and</strong> race/ethnicity 2008 2009 2010 2011 2008 2009 2010 2011 2008 2009 2010 2011<br />
Sex<br />
Total 1 502 501 501 497 515 515 516 514 494 493 492 489<br />
Male 504 503 503 500 533 534 534 531 488 486 486 482<br />
Female 500 498 498 495 500 499 500 500 501 499 498 496<br />
Race/ethnicity<br />
White 528 528 528 528 537 536 536 535 518 517 516 516<br />
Black 430 429 429 428 426 426 428 427 424 421 420 417<br />
Hispanic 455 454 454 451 461 461 463 463 447 447 447 444<br />
Mexican or Mexican<br />
American 454 453 454 451 463 463 467 466 447 446 448 445<br />
Puerto Rican 456 452 454 452 453 450 452 452 445 443 443 442<br />
Other Hispanic 455 455 454 451 461 461 462 462 448 448 447 444<br />
Asian/Pacific Isl<strong>and</strong>er 513 516 519 517 581 587 591 595 516 520 526 528<br />
American Indian/<br />
Alaska Native 485 486 485 484 491 493 492 488 470 469 467 465<br />
Race/ethnicity by sex<br />
Male<br />
White 530 530 530 531 555 555 555 552 510 509 508 507<br />
Black 425 426 426 425 434 435 436 435 412 410 408 405<br />
Hispanic 459 459 459 456 481 481 483 481 444 443 443 439<br />
Mexican or Mexican<br />
American 456 457 459 455 482 482 486 484 443 442 444 440<br />
Puerto Rican 459 453 456 454 470 467 468 467 439 436 437 435<br />
Other Hispanic 461 461 460 457 482 483 484 482 445 446 444 440<br />
Asian/Pacific Isl<strong>and</strong>er 513 516 520 518 596 602 605 608 510 514 520 521<br />
American Indian/<br />
Alaska Native 487 491 487 486 509 513 508 505 463 465 459 456<br />
Female<br />
White 526 526 526 526 521 520 519 520 526 524 523 524<br />
Black 433 431 432 430 420 420 422 422 433 429 428 426<br />
Hispanic 452 450 450 447 446 445 447 449 450 449 450 448<br />
Mexican or Mexican<br />
American 452 450 451 448 448 447 451 452 451 449 451 449<br />
Puerto Rican 454 450 452 450 440 437 438 439 450 448 448 448<br />
Other Hispanic 451 450 449 446 445 445 446 448 450 449 449 447<br />
Asian/Pacific Isl<strong>and</strong>er 513 515 519 517 567 572 577 583 523 527 532 534<br />
American Indian/<br />
Alaska Native 483 482 484 482 475 476 479 473 477 473 474 472<br />
1<br />
Total <strong>in</strong>cludes other racial/ethnic groups not shown separately <strong>in</strong> the table.<br />
NOTE: Data are for seniors who took the SAT anytime dur<strong>in</strong>g high school (through March of their senior year). If a student took a test more than once,<br />
the most recent score was used. Possible scores on each part of the SAT range from 200 to 800. Test-takers were asked to self-identify a s<strong>in</strong>gle racial/<br />
ethnic group, which <strong>in</strong>cluded Mexican American, Puerto Rican, <strong>and</strong> Other Hispanic; however, for the purpose of this report these groups have been<br />
comb<strong>in</strong>ed <strong>in</strong>to Hispanic us<strong>in</strong>g a weighted average. Race categories exclude persons of Hispanic ethnicity.<br />
SOURCE: The College Board, College Bound Seniors, 2008–2011.<br />
122 <strong>Higher</strong> <strong>Education</strong>: <strong>Gaps</strong> <strong>in</strong> <strong>Access</strong> <strong>and</strong> <strong>Persistence</strong> <strong>Study</strong>
24<br />
This page <strong>in</strong>tentionally left blank.<br />
Preparation <strong>and</strong> Achievement<br />
4<br />
Academic Preparation <strong>and</strong> Achievement 123
Indicator 25<br />
Graduation Rates<br />
For the class of 2008–09 <strong>in</strong> public high schools, a lower percentage of males<br />
than females graduated on time with a regular diploma (71.8 vs. 78.9 percent).<br />
This pattern was also found for Whites (78.9 vs. 84.0 percent), Blacks (57.3 vs.<br />
69.3 percent), Hispanics (60.3 vs. 69.7 percent), Asians/Pacific Isl<strong>and</strong>ers (88.0 vs.<br />
93.1 percent), <strong>and</strong> American Indians/Alaska Natives (60.5 vs. 67.7 percent).<br />
The averaged freshman graduation rate (AFGR) estimates<br />
the proportion of public high school freshmen who<br />
graduate with a regular diploma 4 years after start<strong>in</strong>g<br />
9th grade. The AFGR for the class of 2008–09 was<br />
75.5 percent among public school students <strong>in</strong> the United<br />
States. Overall, the AFGR by state for the class of<br />
2008–09 ranged from 56.3 percent <strong>in</strong> Nevada to<br />
90.7 percent <strong>in</strong> Wiscons<strong>in</strong>.<br />
For the class of 2008–09, a lower percentage of males<br />
than females graduated with a regular diploma (71.8 vs.<br />
78.9 percent). This pattern was also found for Whites<br />
(78.9 vs. 84.0 percent), Blacks (57.3 vs. 69.3 percent),<br />
Hispanics (60.3 vs. 69.7 percent), Asians/Pacific Isl<strong>and</strong>ers<br />
(88.0 vs. 93.1 percent), <strong>and</strong> American Indians/Alaska<br />
Natives (60.5 vs. 67.7 percent). The AFGRs for males were<br />
also lower than the AFGRs for females across all 50 states<br />
<strong>and</strong> the District of Columbia.<br />
Technical Notes<br />
The AFGR is an estimate of the percentage of an enter<strong>in</strong>g<br />
freshman class graduat<strong>in</strong>g <strong>in</strong> 4 years. For 2008–09, it<br />
equals the total number of regular diploma recipients<br />
<strong>in</strong> 2008–09 divided by the average membership of the<br />
8th-grade class <strong>in</strong> 2004–05, the 9th-grade class <strong>in</strong><br />
2005–06, <strong>and</strong> the 10th-grade class <strong>in</strong> 2006–07. The<br />
United States total <strong>in</strong>cludes all 50 states <strong>and</strong> the District<br />
of Columbia. This <strong>in</strong>dicator presents <strong>in</strong>formation on<br />
Differences <strong>in</strong> the AFGR were also found across racial/<br />
ethnic groups. In 2008–09, a higher percentage of Asians/<br />
Pacific Isl<strong>and</strong>ers (90.4 percent) than Whites<br />
(81.4 percent), Blacks (63.2 percent), Hispanics<br />
(64.9 percent), <strong>and</strong> American Indians/Alaska Natives<br />
(64.1 percent) graduated on time with a regular diploma.<br />
This overall race/ethnicity pattern was similar among<br />
males. A higher percentage of Asian/Pacific Isl<strong>and</strong>er males<br />
(88.0 percent) than White (78.9 percent), Black<br />
(57.3 percent), Hispanic (60.3 percent), <strong>and</strong> American<br />
Indian/Alaska Native males (60.5 percent) graduated on<br />
time with a regular diploma. Among females, Asians/<br />
Pacific Isl<strong>and</strong>ers (93.1 percent) <strong>and</strong> Whites (84.0 percent)<br />
had higher graduation rates than all other racial/ethnic<br />
groups shown. Black females (69.3 percent) <strong>and</strong> Hispanic<br />
females (69.7 percent) had higher graduation rates than<br />
American Indian/Alaska Native females (67.7 percent).<br />
Asians <strong>and</strong> Pacific Isl<strong>and</strong>ers as a comb<strong>in</strong>ed category<br />
because the data were collected <strong>in</strong> a manner that does<br />
not permit separate report<strong>in</strong>g. S<strong>in</strong>ce 96 percent of all<br />
Asian/Pacific Isl<strong>and</strong>er 5- to 24-year-olds are Asian, this<br />
comb<strong>in</strong>ed category substantially reflects the situation<br />
for Asians, rather than Pacific Isl<strong>and</strong>ers. For more<br />
<strong>in</strong>formation, please see the <strong>in</strong>troduction to this report.<br />
124 <strong>Higher</strong> <strong>Education</strong>: <strong>Gaps</strong> <strong>in</strong> <strong>Access</strong> <strong>and</strong> <strong>Persistence</strong> <strong>Study</strong>
Figure 25-1. Averaged freshman graduation rate (AFGR) <strong>in</strong> public schools, by race/ethnicity <strong>and</strong> sex: 2008–09<br />
25<br />
Percent<br />
100<br />
80<br />
60<br />
72<br />
79 79<br />
84<br />
57<br />
69<br />
60<br />
70<br />
88<br />
93<br />
61<br />
68<br />
40<br />
20<br />
0<br />
Total¹ White Black Hispanic Asian/Pacific<br />
Isl<strong>and</strong>er<br />
Race/ethnicity<br />
American Indian/<br />
Alaska Native 2<br />
Male<br />
Female<br />
1<br />
Total <strong>in</strong>cludes other racial/ethnic groups not shown separately <strong>in</strong> the figure, <strong>and</strong> all 50 states <strong>and</strong> the District of Columbia.<br />
2<br />
The rate for American Indians/Alaska Natives excludes students served <strong>in</strong> schools operated by the Bureau of Indian <strong>Education</strong>.<br />
NOTE: AFGR is an estimate of the percentage of an enter<strong>in</strong>g freshman class graduat<strong>in</strong>g <strong>in</strong> 4 years. For 2008–09, it equals the total number of diploma<br />
recipients <strong>in</strong> 2008–09 divided by the average membership of the 8th-grade class <strong>in</strong> 2004–05, the 9th-grade class <strong>in</strong> 2005–06, <strong>and</strong> the 10th-grade class <strong>in</strong><br />
2006–07.<br />
SOURCE: U.S. Department of <strong>Education</strong>, National Center for <strong>Education</strong> Statistics, Common Core of Data (CCD), State Dropout <strong>and</strong> Completer Data File:<br />
School year 2007–08, version 1b; School year 2008–09, version 1a State Non-Fiscal Data File: School year 2003–04, version 1b; 2004–05, version 1f; 2005–06<br />
version 1b; 2006–07, version 1c LEA Dropout <strong>and</strong> Completer Data File (Restricted-Use): School year 2008–09, version 1a School File: School year 2003–04,<br />
version 1a; 2004–05, version 1b; 2005–06, version 1a; 2006–07, version 1c; 2008–09, version 1b.<br />
Preparation <strong>and</strong> Achievement<br />
4<br />
Academic Preparation <strong>and</strong> Achievement 125
126 <strong>Higher</strong> <strong>Education</strong>: <strong>Gaps</strong> <strong>in</strong> <strong>Access</strong> <strong>and</strong> <strong>Persistence</strong> <strong>Study</strong><br />
Table 25-1. Averaged freshman graduation rate (AFGR) <strong>in</strong> public schools, by race/ethnicity, sex, <strong>and</strong> state or jurisdiction: 2008–09<br />
State or jurisdiction<br />
Total 1 White Black Hispanic Asian/Pacific Isl<strong>and</strong>er<br />
American Indian/<br />
Alaska Native 2<br />
Total Male Female Total Male Female Total Male Female Total Male Female Total Male Female Total Male Female<br />
United States 3,4,5 75.5 71.8 78.9 81.4 78.9 84.0 63.2 57.3 69.3 64.9 60.3 69.7 90.4 88.0 93.1 64.1 60.5 67.7<br />
Alabama 69.9 65.4 74.7 74.5 71.5 77.7 62.2 55.0 69.6 63.0 57.9 69.0 90.2 87.2 93.5 84.7 80.3 89.3<br />
Alaska 5 72.6 65.1 71.0 75.2 72.4 78.3 56.3 52.1 60.6 89.4 83.0 96.5 63.7 64.1 63.3 51.8 48.2 55.6<br />
Arizona 72.5 68.5 76.9 75.8 72.4 79.5 78.7 76.7 80.9 69.2 63.7 75.1 98.9 97.1 100.0 53.8 50.3 57.6<br />
Arkansas 74.0 71.0 77.3 75.5 73.6 77.5 68.0 62.0 74.3 75.7 70.8 81.4 94.4 87.9 100.0 79.2 74.8 84.2<br />
California 5,6,7 71.0 66.2 74.9 80.8 77.5 84.2 57.7 52.6 62.9 61.6 56.2 67.2 87.1 84.6 89.8 65.8 59.5 72.3<br />
Colorado 77.6 73.9 81.5 84.3 81.1 87.7 69.8 66.0 74.0 60.8 55.7 66.1 96.3 95.3 97.3 61.4 56.4 67.1<br />
Connecticut 75.4 72.2 78.8 81.8 79.1 84.7 63.5 58.3 69.2 55.5 51.8 59.5 88.5 87.3 89.9 61.1 60.8 61.5<br />
Delaware 73.7 69.9 77.8 79.0 76.2 82.1 66.8 60.8 72.9 61.3 57.8 64.8 91.8 90.6 92.9 81.6 60.0 100.0<br />
District of Columbia 62.4 55.4 68.9 77.5 79.8 75.8 62.8 55.3 69.8 50.1 44.8 54.7 84.6 82.7 86.4 100.0 75.0 100.0<br />
Florida 68.9 63.7 72.3 71.1 68.2 74.3 59.8 53.9 66.0 66.9 61.7 72.5 94.0 90.3 97.9 68.4 67.9 69.0<br />
Georgia 67.8 62.9 72.6 73.0 70.0 76.3 61.2 54.0 68.8 56.6 52.8 60.6 94.1 92.4 95.7 76.1 78.4 73.9<br />
Hawaii 75.3 73.7 77.1 70.5 70.0 71.0 75.3 76.3 74.3 71.0 71.3 70.6 76.7 74.7 79.1 77.0 64.5 85.3<br />
Idaho 80.6 77.8 83.7 81.6 79.0 84.4 91.9 94.5 88.8 72.7 67.8 77.8 96.7 96.7 96.8 61.5 53.8 69.8<br />
Ill<strong>in</strong>ois 77.7 74.3 81.2 85.7 83.7 87.8 60.8 54.2 67.4 68.8 63.6 74.2 92.9 91.7 94.2 70.6 70.6 70.6<br />
Indiana 75.2 70.3 78.2 77.1 73.9 80.4 56.4 48.5 64.2 66.8 60.6 73.9 100.0 99.2 100.0 68.6 60.4 76.4<br />
Iowa 85.7 83.1 88.5 87.4 85.2 89.7 71.5 66.6 76.9 68.7 61.3 76.6 98.1 92.4 100.0 63.6 58.2 68.6<br />
Kansas 80.2 77.5 82.0 83.7 81.9 85.7 66.6 62.9 70.3 63.5 59.0 68.5 87.9 89.0 86.7 69.0 69.0 69.0<br />
Kentucky 77.6 73.2 81.2 77.8 74.2 81.6 70.2 63.8 77.0 80.2 74.4 86.2 99.0 100.0 95.1 7.2 7.3 7.2<br />
Louisiana 67.3 61.4 73.3 73.2 68.8 77.7 59.6 51.7 67.6 73.6 68.1 79.6 94.2 91.4 97.6 70.0 63.8 76.9<br />
Ma<strong>in</strong>e 4 79.9 77.8 82.2 79.4 77.2 81.8 90.4 90.7 90.0 77.1 74.1 80.8 100.0 100.0 100.0 87.8 94.7 80.4<br />
Maryl<strong>and</strong> 80.1 75.8 84.7 85.6 83.0 88.3 71.8 65.1 78.8 76.8 72.0 82.0 98.8 97.0 100.0 71.5 63.8 79.3<br />
Massachusetts 5 83.3 80.1 85.6 86.1 84.1 88.2 73.9 69.3 78.7 67.7 62.7 73.0 91.9 89.5 94.6 76.0 64.2 87.1<br />
Michigan 75.3 71.6 79.2 80.9 78.1 84.0 58.5 51.8 65.2 61.2 56.3 66.6 94.5 92.0 97.2 64.7 62.6 67.0<br />
M<strong>in</strong>nesota 87.4 85.2 89.8 91.4 89.4 93.5 69.1 65.6 73.0 63.9 60.3 67.9 90.4 88.1 93.1 56.7 54.1 59.2<br />
Mississippi 5 62.0 56.5 67.6 65.3 61.5 69.5 58.6 51.1 65.7 67.7 64.8 71.1 79.3 75.0 84.3 49.3 42.1 54.4<br />
Missouri 83.1 81.0 85.3 85.7 84.4 87.0 71.3 65.8 77.1 80.3 76.6 84.5 100.0 100.0 100.0 83.4 81.9 84.6<br />
Montana 82.0 80.5 83.5 84.5 83.2 86.0 73.9 78.5 69.4 76.6 71.1 83.6 92.0 85.3 98.4 63.1 61.3 64.9<br />
Nebraska 82.9 79.9 86.2 88.0 85.9 90.3 56.7 49.0 64.6 66.9 60.2 74.0 92.4 90.3 95.0 56.3 50.2 62.3<br />
Nevada 6,8 56.3 53.5 59.7 63.3 60.0 66.9 45.0 42.0 48.3 45.3 42.3 48.7 80.2 79.2 81.3 44.8 43.7 46.1<br />
New Hampshire 84.3 82.4 86.3 84.2 82.3 86.2 100.0 100.0 100.0 41.6 39.0 44.5 100.0 100.0 100.0 77.6 81.6 73.5<br />
New Jersey 5 85.3 84.2 85.5 89.1 88.9 89.2 75.9 74.4 77.3 76.1 74.5 77.9 95.6 95.0 96.2 70.5 57.9 87.4<br />
New Mexico 64.8 61.3 68.5 72.4 69.2 75.9 67.4 62.5 72.9 60.7 57.4 64.2 93.3 93.7 92.8 59.9 54.2 65.5<br />
New York 73.5 70.8 76.7 85.1 83.2 87.1 58.1 53.8 62.5 57.4 53.4 61.6 88.4 84.0 93.4 60.6 56.5 64.4<br />
North Carol<strong>in</strong>a 75.1 69.7 78.4 79.3 76.3 82.6 65.0 58.3 72.0 66.5 62.4 71.1 93.3 93.4 93.2 67.2 64.0 70.5<br />
North Dakota 87.4 86.0 89.0 91.1 89.8 92.4 100.0 100.0 100.0 72.4 68.9 77.3 93.8 93.2 94.4 52.4 49.2 55.5<br />
Ohio 79.6 77.1 82.1 84.9 83.1 86.9 56.8 52.4 61.6 66.0 60.7 72.0 98.7 95.5 100.0 83.9 74.4 93.6<br />
Oklahoma 77.3 75.2 79.6 79.0 77.3 80.9 68.7 63.9 73.9 73.7 69.7 78.1 100.0 100.0 100.0 75.5 74.2 76.8<br />
Oregon 76.5 73.2 79.3 77.4 74.9 80.1 61.1 59.0 63.4 70.7 65.4 76.4 89.8 86.7 93.1 62.3 58.1 66.9<br />
See notes at end of table.
Table 25-1.<br />
State or jurisdiction<br />
Averaged freshman graduation rate (AFGR) <strong>in</strong> public schools, by race/ethnicity, sex, <strong>and</strong> state or jurisdiction: 2008–09—Cont<strong>in</strong>ued<br />
Total 1 White Black Hispanic Asian/Pacific Isl<strong>and</strong>er<br />
American Indian/<br />
Alaska Native 2<br />
Total Male Female Total Male Female Total Male Female Total Male Female Total Male Female Total Male Female<br />
United States 3,4,5 75.5 71.8 78.9 81.4 78.9 84.0 63.2 57.3 69.3 64.9 60.3 69.7 90.4 88.0 93.1 64.1 60.5 67.7<br />
Academic Preparation <strong>and</strong> Achievement 127<br />
Pennsylvania 80.5 77.3 83.5 84.4 82.0 86.9 64.0 58.3 69.9 65.3 60.4 70.7 99.3 97.1 100.0 72.5 66.9 79.2<br />
Rhode Isl<strong>and</strong> 75.3 71.4 79.4 77.8 75.0 80.9 70.5 65.4 76.1 67.2 59.8 74.8 75.7 70.2 80.8 75.9 67.4 85.1<br />
South Carol<strong>in</strong>a 66.0 60.1 72.7 71.6 67.3 76.2 58.9 49.9 68.2 64.0 60.9 67.4 90.3 84.0 97.1 62.9 57.4 69.0<br />
South Dakota 81.7 78.7 84.9 85.1 82.1 88.3 85.5 79.9 92.7 66.5 63.3 69.9 99.0 91.2 100.0 54.4 52.9 56.0<br />
Tennessee 77.4 74.0 81.1 79.4 77.5 81.4 71.4 63.9 79.1 74.3 67.9 81.6 97.8 92.3 100.0 83.2 78.1 88.1<br />
Texas 75.4 72.7 78.4 82.7 80.9 84.7 68.0 64.2 72.0 69.6 66.4 73.1 100.0 99.4 100.0 81.9 77.2 86.6<br />
Utah 79.4 76.2 82.3 81.7 79.1 84.4 70.3 60.1 80.8 61.2 56.6 66.2 91.3 88.7 94.2 62.9 55.0 69.4<br />
Vermont 5,9 89.6 87.3 91.7 89.1 86.9 90.9 84.6 75.3 100.0 81.3 96.1 97.7 100.0 100.0 100.0 83.0 83.6 87.1<br />
Virg<strong>in</strong>ia 78.4 73.7 82.9 82.3 79.1 85.8 67.2 59.8 74.7 71.8 65.4 78.9 99.4 97.5 100.0 79.7 81.7 77.6<br />
Wash<strong>in</strong>gton 73.7 69.1 77.8 75.3 71.2 79.7 60.7 56.6 64.9 63.1 58.0 68.6 87.6 84.3 91.1 51.3 46.9 55.7<br />
West Virg<strong>in</strong>ia 77.0 74.1 80.1 77.0 74.2 80.0 70.2 64.6 76.7 88.1 83.1 92.7 100.0 100.0 100.0 57.1 55.2 58.4<br />
Wiscons<strong>in</strong> 90.7 88.2 93.4 95.0 93.2 97.0 65.3 58.2 72.7 77.3 73.3 81.6 99.5 96.4 100.0 74.1 71.6 76.5<br />
Wyom<strong>in</strong>g 75.2 71.5 79.2 77.1 73.8 80.7 65.0 59.3 72.2 69.6 60.3 80.7 87.3 94.2 80.2 45.0 46.9 42.3<br />
1<br />
Total <strong>in</strong>cludes other racial/ethnic groups not shown separately <strong>in</strong> the table.<br />
2<br />
The rate for American Indians/Alaska Natives excludes students served <strong>in</strong> schools operated by the Bureau of Indian <strong>Education</strong>.<br />
3<br />
The United States total <strong>in</strong>cludes all 50 states <strong>and</strong> the District of Columbia.<br />
4<br />
Ma<strong>in</strong>e reported 1,169 diplomas that were awarded to students attend<strong>in</strong>g private high schools that received a majority of their fund<strong>in</strong>g from public sources. These 1,169 diplomas were excluded from Ma<strong>in</strong>e’s <strong>and</strong><br />
the United State’s AFGR calculations as the students were not reported <strong>in</strong> enrollment for prior years. These 1,169 diplomas were prorated out of the diploma counts used <strong>in</strong> the calculation of the AFGR by race/<br />
ethnicity <strong>and</strong> sex.<br />
5<br />
Alaska, California, Massachusetts, Mississippi, New Jersey, <strong>and</strong> Vermont reported students <strong>in</strong> seven race categories for 2008–09, rather than five. For these states the reported Asian <strong>and</strong> Pacific Isl<strong>and</strong>er<br />
categories were comb<strong>in</strong>ed for this table. The “two or more races” category was excluded from the detail for these states but <strong>in</strong>cluded <strong>in</strong> the total.<br />
6<br />
Due to item nonresponse, data for California <strong>and</strong> Nevada were imputed based on prior year reported data.<br />
7<br />
Due to item nonresponse at the school district level, sex distributions with<strong>in</strong> race for California were taken from prior year reported data.<br />
8<br />
Due to item nonresponse at the school district level, sex distributions <strong>in</strong> Nevada were based on the sex distribution of the 12th-graders enrolled <strong>in</strong> the graduation year. Because Nevada was unable to report<br />
enrollment data by race/ethnicity for 2004–05, the year required for 8th-grade enrollment <strong>in</strong> the AFGR calculations, race/ethnicity <strong>and</strong> sex distributions for the 8th-grade enrollment were imputed by averag<strong>in</strong>g the<br />
reported data for 2003–04 <strong>and</strong> 2005–06 <strong>and</strong> then adjust<strong>in</strong>g them to the 2004–05 reported grade total.<br />
9<br />
Due to item nonresponse, specifically the lack of race/ethnicity <strong>and</strong> sex data for diplomas for several years, race/ethnicity <strong>and</strong> sex distributions were taken from the reported 12th-grade enrollments <strong>and</strong> applied<br />
to the reported diploma total for Vermont.<br />
NOTE: AFGR is an estimate of the percentage of an enter<strong>in</strong>g freshman class graduat<strong>in</strong>g <strong>in</strong> 4 years. For 2008–09, it equals the total number of diploma recipients <strong>in</strong> 2008–09 divided by the average membership<br />
of the 8th-grade class <strong>in</strong> 2004–05, the 9th-grade class <strong>in</strong> 2005–06, <strong>and</strong> the 10th-grade class <strong>in</strong> 2006–07. Ungraded students were allocated to <strong>in</strong>dividual grades proportional to each state’s enrollment <strong>in</strong> those<br />
grades. Due to the time lapse between the report<strong>in</strong>g of enrollments <strong>and</strong> graduates, calculated rates may exceed 100 percent. For the purpose of report<strong>in</strong>g, these rates have been top coded to 100 percent. Data<br />
<strong>in</strong> this table may differ from previously released tables due to the imputation of sex detail <strong>and</strong> miss<strong>in</strong>g race/ethnicity detail. Race categories exclude persons of Hispanic ethnicity.<br />
SOURCE: U.S. Department of <strong>Education</strong>, National Center for <strong>Education</strong> Statistics, Common Core of Data (CCD), State Dropout <strong>and</strong> Completer Data File: School year 2007–08, version 1b; School year 2008–09,<br />
version 1a State Non-Fiscal Data File: School year 2003–04, version 1b; 2004–05, version 1f; 2005–06 version 1b; 2006–07, version 1c LEA Dropout <strong>and</strong> Completer Data File (Restricted-Use): School year 2008–09,<br />
version 1a School File: School year 2003–04, version 1a; 2004–05, version 1b; 2005–06, version 1a; 2006–07, version 1c; 2008–09, version 1b.<br />
4<br />
Preparation <strong>and</strong> Achievement<br />
25
Indicator 26<br />
Status Dropout Rates<br />
In 2010, the status dropout rate was higher for males (8 percent) than for females<br />
(6 percent). This pattern was also found for Whites, Blacks, <strong>and</strong> Hispanics. Females<br />
of two or more races, however, had higher status dropout rates (8 percent) than<br />
their male counterparts (2 percent). No measurable differences <strong>in</strong> status dropout<br />
rates by sex were found for Asians or American Indians/Alaska Natives.<br />
The status dropout rate represents the percentage of<br />
16- through 24-year-olds who are not enrolled <strong>in</strong> school<br />
<strong>and</strong> have not earned a high school credential (either a<br />
diploma or an equivalency credential such as a General<br />
<strong>Education</strong>al Development [GED] certificate). In 2010,<br />
the status dropout rate was 7 percent.<br />
Status dropout rates varied across racial/ethnic groups.<br />
In 2010, status dropout rates were higher for Hispanics<br />
(15 percent) than for Whites (5 percent), Blacks<br />
(8 percent), Asians (4 percent), Native Hawaiians/Pacific<br />
Isl<strong>and</strong>ers (5 percent), <strong>and</strong> persons of two or more races<br />
(5 percent). Blacks had higher status dropout rates than<br />
Whites <strong>and</strong> Asians. In addition, American Indians/<br />
Alaska Natives (12 percent) had higher dropout rates than<br />
Whites, Asians, <strong>and</strong> persons of two or more races.<br />
Overall, the status dropout rate <strong>in</strong> 2010 was higher<br />
for males (8 percent) than for females (6 percent). This<br />
pattern was also found for Whites, Blacks, <strong>and</strong> Hispanics.<br />
Females of two or more races, however, had higher status<br />
dropout rates (8 percent) than their male counterparts<br />
(2 percent). No measurable differences <strong>in</strong> status dropout<br />
rates by sex were found for Asians or American Indians/<br />
Alaska Natives.<br />
Among males, status dropout rates were higher for<br />
Hispanics (17 percent) than for Whites (6 percent), Blacks<br />
(9 percent), Asians (4 percent), or Native Hawaiians/<br />
Pacific Isl<strong>and</strong>ers (8 percent). Black males (9 percent) had<br />
higher status dropout rates than White (6 percent) <strong>and</strong><br />
Asian (4 percent) males. Among females, status dropout<br />
rates were higher for Hispanics (13 percent) than Whites<br />
Figure 26-1.<br />
Status dropout rates of 16- through 24-year-olds <strong>in</strong> the civilian, non<strong>in</strong>stitutionalized population, by race/<br />
ethnicity <strong>and</strong> sex: October Supplement, 2010<br />
Percent<br />
60<br />
50<br />
40<br />
30<br />
20<br />
10<br />
0<br />
8<br />
6 6 4<br />
9 7<br />
Total White Black Hispanic Asian Native Hawaiian/<br />
Pacific Isl<strong>and</strong>er<br />
17<br />
13<br />
Race/ethnicity<br />
4 5<br />
8!<br />
#<br />
11!<br />
14!<br />
American Indian/<br />
Alaska Native<br />
Male<br />
Female<br />
# Rounds to zero.<br />
! Interpret data with caution. The coefficient of variation (CV) for this estimate is 30 percent or greater.<br />
NOTE: Report<strong>in</strong>g st<strong>and</strong>ards for males of two or more races were not met; therefore, data for two or more races are not shown <strong>in</strong> the figure. The data<br />
presented here represent status dropout rates, which is the percentage of civilian, non<strong>in</strong>stitutionalized 16- to 24-year-olds who are not <strong>in</strong> high school<br />
<strong>and</strong> who have not earned a high school credential (either a diploma or equivalency credential such as a GED). The status dropout rate <strong>in</strong>cludes all<br />
dropouts (regardless of when they last attended school), as well as <strong>in</strong>dividuals who may have never attended school <strong>in</strong> the United States, such as<br />
immigrants who did not complete a high school diploma <strong>in</strong> their home country. Young adults <strong>in</strong> the military or those who are <strong>in</strong>carcerated, for <strong>in</strong>stance,<br />
are not <strong>in</strong>cluded <strong>in</strong> this measure. Race categories exclude persons of Hispanic ethnicity.<br />
SOURCE: U.S. Department of Commerce, Census Bureau, Current Population Survey (CPS), October Supplement, 2010.<br />
128 <strong>Higher</strong> <strong>Education</strong>: <strong>Gaps</strong> <strong>in</strong> <strong>Access</strong> <strong>and</strong> <strong>Persistence</strong> <strong>Study</strong>
(4 percent), Blacks (7 percent), or Asians (5 percent).<br />
Black females had higher status dropout rates than<br />
White females. American Indian/Alaska Native females<br />
(14 percent) had higher dropout rates than Asian <strong>and</strong><br />
White females, but no measurable differences were found<br />
between American Indian/Alaska Native females <strong>and</strong><br />
females from any other racial/ethnic group <strong>in</strong> 2010.<br />
Comparisons between 2008 <strong>and</strong> 2010 revealed some<br />
differences. Overall, the status dropout rate was higher <strong>in</strong><br />
2008 than <strong>in</strong> 2010 (8 vs. 7 percent). This f<strong>in</strong>d<strong>in</strong>g was also<br />
true for Blacks (10 vs. 8 percent) <strong>and</strong> Hispanics (18 vs.<br />
15 percent). Among males, no measurable differences<br />
either overall or by race/ethnicity were found between<br />
2008 <strong>and</strong> 2010. However, females had a higher status<br />
dropout rate <strong>in</strong> 2008 than <strong>in</strong> 2010 (8 vs. 6 percent). This<br />
f<strong>in</strong>d<strong>in</strong>g was also true for Black females (11 vs. 7 percent)<br />
<strong>and</strong> Hispanic females (17 vs. 13 percent).<br />
26<br />
Technical Notes<br />
The Current Population Survey (CPS) estimates of the<br />
status dropout rate <strong>in</strong>clude civilian, non<strong>in</strong>stitutionalized<br />
16- through 24-year-olds. Young adults <strong>in</strong> the military or<br />
those who are <strong>in</strong>carcerated, for <strong>in</strong>stance, are not <strong>in</strong>cluded<br />
<strong>in</strong> the CPS measure.<br />
Preparation <strong>and</strong> Achievement<br />
4<br />
Academic Preparation <strong>and</strong> Achievement 129
Table 26-1.<br />
Status dropout rates of 16- through 24-year-olds <strong>in</strong> the civilian, non<strong>in</strong>stitutionalized population, by<br />
race/ethnicity, year, <strong>and</strong> sex: October Supplement, 2008–10<br />
Year <strong>and</strong> sex Total White Black Hispanic Asian<br />
Native<br />
Hawaiian/<br />
Pacific<br />
Isl<strong>and</strong>er<br />
American<br />
Indian/<br />
Alaska<br />
Native<br />
Two or<br />
more<br />
races<br />
Total<br />
2008 8.0 4.8 9.9 18.3 4.5 ‡ 14.6 4.2<br />
2009 8.1 5.2 9.3 17.6 2.1 18.4 13.2 6.5<br />
2010 7.4 5.1 8.0 15.1 4.1 5.0 ! 12.4 5.4<br />
Male<br />
2008 8.5 5.4 8.7 19.9 3.9 ‡ 18.6 3.6 !<br />
2009 9.1 6.3 10.6 19.0 ‡ 26.9 ! 12.3 ! 5.5 !<br />
2010 8.5 5.9 9.5 17.3 3.6 8.5 ! 10.6 ! ‡<br />
Female<br />
2008 7.5 4.2 11.1 16.7 5.1 ‡ 11.6 ! 4.8 !<br />
2009 7.0 4.1 8.1 16.1 3.0 ! ‡ 14.1 ! 7.5<br />
2010 6.3 4.2 6.7 12.8 4.5 # 14.2 ! 8.2<br />
# Rounds to zero.<br />
! Interpret data with caution. The coefficient of variation (CV) for this estimate is 30 percent or greater.<br />
‡ Report<strong>in</strong>g st<strong>and</strong>ards not met. Either there are too few cases or the coefficient of variation (CV) is 50 percent or greater.<br />
NOTE: The data presented here represent status dropout rates, which is the percentage of civilian, non<strong>in</strong>stitutionalized 16- to 24-year-olds who are not<br />
<strong>in</strong> high school <strong>and</strong> who have not earned a high school credential (either a diploma or equivalency credential such as a GED). The status dropout rate<br />
<strong>in</strong>cludes all dropouts (regardless of when they last attended school), as well as <strong>in</strong>dividuals who may have never attended school <strong>in</strong> the United States,<br />
such as immigrants who did not complete a high school diploma <strong>in</strong> their home country. Young adults <strong>in</strong> the military or those who are <strong>in</strong>carcerated, for<br />
<strong>in</strong>stance, are not <strong>in</strong>cluded <strong>in</strong> this measure. Race categories exclude persons of Hispanic ethnicity.<br />
SOURCE: U.S. Department of Commerce, Census Bureau, Current Population Survey (CPS), October Supplement, 2008–2010.<br />
130 <strong>Higher</strong> <strong>Education</strong>: <strong>Gaps</strong> <strong>in</strong> <strong>Access</strong> <strong>and</strong> <strong>Persistence</strong> <strong>Study</strong>
26<br />
This page <strong>in</strong>tentionally left blank.<br />
Preparation <strong>and</strong> Achievement<br />
4<br />
Academic Preparation <strong>and</strong> Achievement 131
Chapter 5<br />
College Knowledge<br />
27. Postsecondary Plans............................................................................................................ 134<br />
28. Steps Toward Postsecondary Enrollment............................................................................. 140<br />
29. Informational Resources...................................................................................................... 146<br />
30. Postsecondary School Choice Factors............................................................................... 150<br />
31. F<strong>in</strong>ancial Aid Considerations............................................................................................... 154<br />
32. Participation <strong>in</strong> College Preparatory <strong>and</strong> Awareness Programs........................................ 158<br />
132 <strong>Higher</strong> <strong>Education</strong>: <strong>Gaps</strong> <strong>in</strong> <strong>Access</strong> <strong>and</strong> <strong>Persistence</strong> <strong>Study</strong>
Chapter 5 exam<strong>in</strong>es the extent to which males <strong>and</strong> females across <strong>and</strong> with<strong>in</strong> racial/ethnic groups have postsecondary<br />
aspirations, complete specific steps toward postsecondary enrollment, consult various sources for <strong>in</strong>formation about<br />
college, report the importance of specific factors <strong>in</strong> their decision to apply to <strong>and</strong> enroll <strong>in</strong> postsecondary <strong>in</strong>stitutions,<br />
<strong>and</strong> participate <strong>in</strong> college preparatory <strong>and</strong> awareness programs.<br />
Students’ aspirations to cont<strong>in</strong>ue their education after high school are shaped by personal <strong>and</strong> environmental factors<br />
such as family <strong>and</strong> community expectations. In addition to parents’ educational atta<strong>in</strong>ment, parental encouragement,<br />
socioeconomic status (SES), <strong>and</strong> students’ academic abilities, the availability of resources—such as access to<br />
<strong>in</strong>formation <strong>and</strong> guidance—has also been associated with students’ predispositions toward postsecondary education<br />
(Bers <strong>and</strong> Galowich 2002; Butner et al. 2001; Hossler, Schmit, <strong>and</strong> Vesper 1999; McDonough 1997). For example,<br />
research has shown that the association between SES <strong>and</strong> enrollment <strong>in</strong> 2- <strong>and</strong> 4-year postsecondary <strong>in</strong>stitutions is<br />
reduced when students are exposed to <strong>in</strong>formation <strong>and</strong> guidance about postsecondary education <strong>and</strong> complete specific<br />
steps of the postsecondary education search <strong>and</strong> decisionmak<strong>in</strong>g process (i.e., visit<strong>in</strong>g <strong>and</strong> apply<strong>in</strong>g to postsecondary<br />
<strong>in</strong>stitutions <strong>and</strong> explor<strong>in</strong>g <strong>and</strong> apply<strong>in</strong>g for f<strong>in</strong>ancial aid; Plank <strong>and</strong> Jordan 2001).<br />
Often, low-<strong>in</strong>come <strong>and</strong> first-generation students do not have the knowledge necessary to successfully transition from<br />
high school to a postsecondary <strong>in</strong>stitution. The entry process, which <strong>in</strong>volves tak<strong>in</strong>g admissions tests, research<strong>in</strong>g<br />
schools, <strong>and</strong> apply<strong>in</strong>g to <strong>and</strong> ultimately select<strong>in</strong>g a postsecondary <strong>in</strong>stitution, can be difficult for many first-generation<br />
students to navigate (Cabrera <strong>and</strong> La Nasa 2000; Roderick et al. 2008). Lack<strong>in</strong>g the proper guidance <strong>and</strong> <strong>in</strong>formation<br />
about this process may be associated with lower postsecondary enrollment rates (Choy et al. 2000; Cunn<strong>in</strong>gham,<br />
Erisman, <strong>and</strong> Looney 2007; Horn <strong>and</strong> Chen 1998; Ishitani <strong>and</strong> Snider 2004; Kao <strong>and</strong> Tienda 1998; Plank <strong>and</strong> Jordan<br />
2001; Venezia <strong>and</strong> Kirst 2005).<br />
One of the first steps <strong>in</strong> the college application process is tak<strong>in</strong>g entrance exams. To <strong>in</strong>crease their chances of success,<br />
some students complete various steps <strong>in</strong> preparation for exams such as the SAT or ACT. There is evidence that tak<strong>in</strong>g<br />
advantage of SAT/ACT preparation courses is associated with an <strong>in</strong>creased likelihood of matriculation (e.g., Plank <strong>and</strong><br />
Jordan 2001).<br />
The extent to which students prepare for entrance exams may be associated with the number <strong>and</strong> type of postsecondary<br />
<strong>in</strong>stitutions they apply to while <strong>in</strong> high school. This decision may also be related to the <strong>in</strong>formational resources<br />
available to students at school, at home, or <strong>in</strong> their community. Students who consult various sources—such as parents,<br />
teachers, guidance counselors, <strong>and</strong> <strong>in</strong>dividual <strong>in</strong>stitutions—for <strong>in</strong>formation about a postsecondary <strong>in</strong>stitution are more<br />
likely to attend a 2- or 4-year <strong>in</strong>stitution than those who do not seek out <strong>in</strong>formation from these sources (Bett<strong>in</strong>ger,<br />
Long, Oreopoulos, <strong>and</strong> Sanbonmatsu 2009; Engberg <strong>and</strong> Wolniak 2010; Hill 2008; Horn <strong>and</strong> Chen 1998; Plank <strong>and</strong><br />
Jordan 2001). There is evidence of a positive association between postsecondary enrollment <strong>and</strong> participat<strong>in</strong>g <strong>in</strong> college<br />
awareness programs that offer such assistance to students as provid<strong>in</strong>g academic support, career development, f<strong>in</strong>ancial<br />
aid resources, <strong>and</strong> opportunities to visit campuses (Constant<strong>in</strong>e et al. 2006; Johnson 1998).<br />
Another important aspect of students’ decisions about <strong>and</strong> predispositions toward postsecondary enrollment is their<br />
perception of costs <strong>and</strong> access to f<strong>in</strong>ancial aid (Grodsky <strong>and</strong> Jones 2007; Horn, Chen, <strong>and</strong> Chapman 2003; K<strong>in</strong>g 2006;<br />
Terenz<strong>in</strong>i, Cabrera, <strong>and</strong> Bernal 2001). Inform<strong>in</strong>g students about the availability of f<strong>in</strong>ancial aid <strong>and</strong> assist<strong>in</strong>g them with<br />
the process of apply<strong>in</strong>g for aid have been associated with <strong>in</strong>creased postsecondary enrollment rates <strong>and</strong> f<strong>in</strong>ancial aid<br />
applications (e.g., Bett<strong>in</strong>ger et al. 2009; Constant<strong>in</strong>e et al. 2006). When surveyed, students frequently cited f<strong>in</strong>ancial<br />
aid <strong>and</strong> low expenses as “very important” factors <strong>in</strong> their postsecondary education selection process (Ingels <strong>and</strong> Dalton<br />
2008). These factors have also been associated with greater postsecondary access <strong>and</strong> persistence (St. John, Paulsen, <strong>and</strong><br />
Starkey 1996; Engberg <strong>and</strong> Wolniak 2010).<br />
College Knowledge 133
Indicator 27<br />
Postsecondary Plans<br />
Among 9th-grade students <strong>in</strong> 2009, a lower percentage of males than females<br />
(53 vs. 59 percent) expected to complete a bachelor’s or graduate/professional<br />
degree as their highest level of education. Conversely, a higher percentage of<br />
males than females (17 vs. 12 percent) expected their highest level of education to<br />
be the completion of high school or less.<br />
In 2009, n<strong>in</strong>th-graders <strong>in</strong> a nationally representative<br />
sample were asked to <strong>in</strong>dicate the highest level of<br />
education they expected to achieve. About 56 percent<br />
expected to complete a bachelor’s or graduate/professional<br />
degree, 7 percent expected to complete some college,<br />
15 percent expected to complete high school or less, <strong>and</strong><br />
22 percent didn’t know what level of education they<br />
would complete. A lower percentage of males than females<br />
(53 vs. 59 percent) expected to complete a bachelor’s or<br />
graduate/professional degree. This pattern held for White<br />
males <strong>and</strong> females (56 vs. 63 percent) <strong>and</strong> Black males<br />
<strong>and</strong> females (54 vs. 61 percent), but no measurable<br />
differences by sex were observed for other racial/ethnic<br />
groups. Conversely, a higher percentage of males than<br />
females (17 vs. 12 percent) expected their highest level of<br />
education to be the completion of high school or less. This<br />
pattern of differences by sex was also observed for White<br />
males <strong>and</strong> females (15 vs. 9 percent) <strong>and</strong> Hispanic males<br />
<strong>and</strong> females (24 vs. 17 percent).<br />
Some differences <strong>in</strong> 9th-graders’ expectations concern<strong>in</strong>g<br />
their educational atta<strong>in</strong>ment were found when compar<strong>in</strong>g<br />
racial/ethnic groups. <strong>Higher</strong> percentages of Asian<br />
students, White students, students of two or more races,<br />
<strong>and</strong> Black students than Hispanic or American Indian/<br />
Alaska Native students expected to complete a bachelor’s<br />
or graduate/professional degree. This pattern was found<br />
for males as well. For example, 60 percent of Asian males,<br />
59 percent of males of two or more races, 56 percent of<br />
White males, <strong>and</strong> 54 percent of Black males expected<br />
to complete at least a bachelor’s degree, compared with<br />
44 percent of Hispanic males <strong>and</strong> 33 percent of American<br />
Indian/Alaska Native males. Also, higher percentages of<br />
females who were Asian, White, of two or more races, <strong>and</strong><br />
Black expected to complete a bachelor’s or graduate degree<br />
than did Hispanic females. In contrast, the percentages<br />
of 9th-graders who expected to complete high school<br />
or less were higher for American Indian/Alaska Native<br />
<strong>and</strong> Hispanic students than for Asian students, White<br />
students, <strong>and</strong> students of two or more races. Also, a higher<br />
percentage of Black 9th-graders than Asian or White<br />
9th-graders reported that they expected high school or less<br />
to be their highest level of education.<br />
N<strong>in</strong>th-graders were also asked to <strong>in</strong>dicate what they<br />
planned to do dur<strong>in</strong>g their first year after high school.<br />
Figure 27-1.<br />
Percentage of 9th-graders expect<strong>in</strong>g to complete a bachelor’s or graduate/professional degree, by race/<br />
ethnicity <strong>and</strong> sex: 2009<br />
Percent<br />
100<br />
80<br />
60<br />
40<br />
53<br />
59 56<br />
63<br />
54<br />
61<br />
44<br />
50<br />
60<br />
65<br />
33<br />
43<br />
59 59<br />
20<br />
0<br />
Total 1 White Black Hispanic Asian American Indian/<br />
Alaska Native<br />
Race/ethnicity<br />
Two or<br />
more races<br />
Male<br />
Female<br />
1<br />
Total <strong>in</strong>cludes other racial/ethnic groups not shown separately <strong>in</strong> the figure.<br />
NOTE: Report<strong>in</strong>g st<strong>and</strong>ards for Native Hawaiians/Pacific Isl<strong>and</strong>ers were not met; therefore, data for this group are not shown <strong>in</strong> the figure. Data weighted by<br />
W1STUDENT. Race categories exclude persons of Hispanic ethnicity.<br />
SOURCE: U.S. Department of <strong>Education</strong>, National Center for <strong>Education</strong> Statistics, High School Longitud<strong>in</strong>al <strong>Study</strong> of 2009, Base-Year Public-Use Data File.<br />
134 <strong>Higher</strong> <strong>Education</strong>: <strong>Gaps</strong> <strong>in</strong> <strong>Access</strong> <strong>and</strong> <strong>Persistence</strong> <strong>Study</strong>
Figure 27-2.<br />
Percent<br />
Percentage of 9th-graders plann<strong>in</strong>g to enroll <strong>in</strong> a license/certificate, associate’s, or bachelor’s program<br />
dur<strong>in</strong>g their first year after high school, by race/ethnicity <strong>and</strong> sex: 2009<br />
27<br />
100<br />
80<br />
60<br />
40<br />
20<br />
0<br />
59<br />
71<br />
60<br />
73<br />
61<br />
71<br />
Total 1 White Black Hispanic Asian American Indian/<br />
Alaska Native<br />
53<br />
Race/ethnicity<br />
Male<br />
67 67<br />
Female<br />
74<br />
45<br />
48<br />
62<br />
73<br />
Two or<br />
more races<br />
College Knowledge<br />
5<br />
1<br />
Total <strong>in</strong>cludes other racial/ethnic groups not shown separately <strong>in</strong> the figure.<br />
NOTE: Report<strong>in</strong>g st<strong>and</strong>ards for Native Hawaiians/Pacific Isl<strong>and</strong>ers were not met; therefore, data for this group are not shown <strong>in</strong> the figure. Data weighted by<br />
W1STUDENT. Race categories exclude persons of Hispanic ethnicity.<br />
SOURCE: U.S. Department of <strong>Education</strong>, National Center for <strong>Education</strong> Statistics, High School Longitud<strong>in</strong>al <strong>Study</strong> of 2009, Base-Year Public-Use Data File.<br />
Some 65 percent of 9th-graders <strong>in</strong>dicated that they<br />
planned to enroll <strong>in</strong> a license/certificate, associate’s,<br />
or bachelor’s program dur<strong>in</strong>g their first year after<br />
high school. A lower percentage of males (59 percent)<br />
than females (71 percent) planned to pursue a license/<br />
certificate, associate’s, or bachelor’s program <strong>in</strong> their first<br />
year after high school. This pattern held for White males<br />
<strong>and</strong> females (60 vs. 73 percent), Black males <strong>and</strong> females<br />
Technical Notes<br />
“High school or less” <strong>in</strong>cludes students who <strong>in</strong>dicated that<br />
they expected to complete less than high school, a high<br />
school diploma, or a General <strong>Education</strong>al Development<br />
(GED) credential. “Some college” <strong>in</strong>cludes those who<br />
expected to start an associate’s degree, complete an<br />
(61 vs. 71 percent), Hispanic males <strong>and</strong> females (53 vs.<br />
67 percent), <strong>and</strong> males <strong>and</strong> females of two or more<br />
races (62 vs. 73 percent). Patterns between racial/ethnic<br />
groups for students plann<strong>in</strong>g to enter a license/certificate,<br />
associate’s, or bachelor’s program were similar to those for<br />
students expect<strong>in</strong>g to complete a bachelor’s or graduate/<br />
professional degree.<br />
associate’s degree, or start a bachelor’s degree. “Graduate<br />
or professional degree” <strong>in</strong>cludes those who expected to<br />
complete a master’s degree or start or complete a Ph.D.,<br />
M.D., law, or other professional degree.<br />
College Knowledge 135
Table 27-1.<br />
Sex <strong>and</strong> race/ethnicity<br />
Sex<br />
Percentage distribution of 9th-graders expect<strong>in</strong>g to complete various educational levels, by sex <strong>and</strong><br />
race/ethnicity: 2009<br />
Total<br />
High<br />
school<br />
or less<br />
Some<br />
college<br />
Bachelor’s or graduate/<br />
professional degree<br />
Total<br />
Bachelor’s<br />
degree<br />
Graduate<br />
or<br />
professional<br />
degree<br />
Don’t know<br />
Total 100.0 14.7 7.3 56.3 17.2 39.1 21.7<br />
Male 100.0 17.3 8.1 53.1 18.6 34.5 21.5<br />
Female 100.0 12.1 6.5 59.5 15.7 43.8 21.9<br />
Race/ethnicity<br />
White 100.0 12.1 7.3 59.4 19.6 39.9 21.2<br />
Black 100.0 17.6 6.6 57.8 13.8 44.0 18.0<br />
Hispanic 100.0 20.4 7.2 47.0 14.6 32.4 25.5<br />
Asian 100.0 5.8 6.7 62.9 15.2 47.7 24.7<br />
Native Hawaiian/<br />
Pacific Isl<strong>and</strong>er ‡ ‡ ‡ ‡ ‡ ‡ ‡<br />
American Indian/<br />
Alaska Native 100.0 28.5 10.9 37.8 11.8 26.0 22.8<br />
Two or more races 100.0 14.1 8.4 58.7 15.9 42.8 18.8<br />
Race/ethnicity by sex<br />
Male<br />
White 100.0 15.2 8.2 55.9 20.5 35.4 20.7<br />
Black 100.0 18.9 8.2 53.9 17.1 36.8 19.0<br />
Hispanic 100.0 23.8 6.8 44.4 16.4 28.0 25.0<br />
Asian 100.0 6.8 9.4 60.4 14.1 46.3 23.4<br />
Native Hawaiian/<br />
Pacific Isl<strong>and</strong>er ‡ ‡ ‡ ‡ ‡ ‡ ‡<br />
American Indian/<br />
Alaska Native 100.0 34.0 8.4 ! 33.3 7.4 ! 25.9 24.3<br />
Two or more races 100.0 14.0 9.4 58.6 18.6 40.0 18.0<br />
Female<br />
White 100.0 8.8 6.4 63.2 18.6 44.6 21.7<br />
Black 100.0 16.5 5.3 61.1 10.9 50.2 17.1<br />
Hispanic 100.0 16.8 7.5 49.7 12.8 36.9 25.9<br />
Asian 100.0 4.7 ! 3.9 ! 65.4 16.3 49.1 26.0<br />
Native Hawaiian/<br />
Pacific Isl<strong>and</strong>er ‡ ‡ ‡ ‡ ‡ ‡ ‡<br />
American Indian/<br />
Alaska Native 100.0 21.6 ! 14.0 43.4 17.2 ! 26.1 ! 21.0 !<br />
Two or more races 100.0 14.3 7.4 58.7 13.2 45.5 19.6<br />
! Interpret data with caution. The coefficient of variation (CV) for this estimate is 30 percent or greater.<br />
‡ Report<strong>in</strong>g st<strong>and</strong>ards not met (too few cases).<br />
NOTE: “High school or less” <strong>in</strong>cludes students who <strong>in</strong>dicated that they expected to complete less than high school, a high school diploma, or a General<br />
<strong>Education</strong>al Development (GED) credential. “Some college” <strong>in</strong>cludes those who expected to start an associate’s degree, complete an associate’s<br />
degree, or start a bachelor’s degree. “Graduate or professional degree” <strong>in</strong>cludes those who expected to complete a master’s degree or start or<br />
complete a Ph.D., M.D., law, or other professional degree. Data weighted by W1STUDENT. Race categories exclude persons of Hispanic ethnicity.<br />
SOURCE: U.S. Department of <strong>Education</strong>, National Center for <strong>Education</strong> Statistics, High School Longitud<strong>in</strong>al <strong>Study</strong> of 2009, Base-Year Public-Use Data File.<br />
136 <strong>Higher</strong> <strong>Education</strong>: <strong>Gaps</strong> <strong>in</strong> <strong>Access</strong> <strong>and</strong> <strong>Persistence</strong> <strong>Study</strong>
27<br />
College Knowledge<br />
5<br />
This page <strong>in</strong>tentionally left blank.<br />
College Knowledge 137
Table 27-2.<br />
Sex <strong>and</strong> race/ethnicity<br />
Sex<br />
Percentage of 9th-graders plann<strong>in</strong>g different activities dur<strong>in</strong>g their first year after high school, by sex <strong>and</strong><br />
race/ethnicity: 2009<br />
License/certificate, associate’s, or bachelor’s program<br />
At least one<br />
program<br />
License or<br />
certificate<br />
Associate’s<br />
program<br />
Bachelor’s<br />
program<br />
Apprenticeship<br />
Jo<strong>in</strong> armed<br />
services<br />
Total 65.1 12.8 16.4 49.5 2.9 8.4<br />
Male 59.0 12.1 15.0 44.7 2.7 13.0<br />
Female 71.1 13.4 17.9 54.4 3.1 3.8<br />
Race/ethnicity<br />
White 66.5 9.9 14.9 52.1 2.5 9.1<br />
Black 66.1 18.6 16.6 47.5 2.3 6.8<br />
Hispanic 60.0 13.9 19.4 42.9 2.8 7.6<br />
Asian 70.4 14.0 14.4 63.0 5.3 4.3<br />
Native Hawaiian/<br />
Pacific Isl<strong>and</strong>er ‡ ‡ ‡ ‡ ‡ ‡<br />
American Indian/<br />
Alaska Native 46.7 8.8 16.3 36.0 ‡ 13.4<br />
Two or more races 67.7 18.3 18.6 50.5 5.0 10.4<br />
Race/ethnicity by sex<br />
Male<br />
White 60.4 9.9 13.1 46.9 2.5 14.4<br />
Black 60.8 14.6 16.4 43.6 1.9 9.8<br />
Hispanic 53.3 14.3 17.4 37.2 2.3 11.5<br />
Asian 67.0 17.0 16.5 56.9 5.1 6.7<br />
Native Hawaiian/<br />
Pacific Isl<strong>and</strong>er ‡ ‡ ‡ ‡ ‡ ‡<br />
American Indian/<br />
Alaska Native 45.4 11.5 ! 15.8 ! 39.2 ‡ 13.3 !<br />
Two or more races 62.2 14.9 17.2 49.5 5.1 16.0<br />
Female<br />
White 73.0 10.0 16.8 57.6 2.6 3.5<br />
Black 70.6 21.9 16.8 50.8 2.7 4.3<br />
Hispanic 67.0 13.5 21.4 48.9 3.3 3.7<br />
Asian 73.9 11.1 12.2 69.1 5.6 ‡<br />
Native Hawaiian/<br />
Pacific Isl<strong>and</strong>er ‡ ‡ ‡ ‡ ‡ ‡<br />
American Indian/<br />
Alaska Native 48.3 ‡ 16.9 ! 32.4 ! ‡ 13.5 !<br />
Two or more races 73.1 21.6 19.9 51.6 5.0 4.9<br />
See notes at end of table.<br />
138 <strong>Higher</strong> <strong>Education</strong>: <strong>Gaps</strong> <strong>in</strong> <strong>Access</strong> <strong>and</strong> <strong>Persistence</strong> <strong>Study</strong>
Table 27-2.<br />
Percentage of 9th-graders plann<strong>in</strong>g different activities dur<strong>in</strong>g their first year after high school, by sex <strong>and</strong><br />
race/ethnicity: 2009—Cont<strong>in</strong>ued<br />
27<br />
Sex <strong>and</strong> race/ethnicity Get a job Start a family Travel<br />
Sex<br />
Do volunteer or<br />
missionary work<br />
Don’t know<br />
Total 42.6 6.8 12.0 8.4 12.8<br />
Male 43.0 7.5 10.1 5.9 13.2<br />
Female 42.3 6.1 14.0 10.8 12.4<br />
Race/ethnicity<br />
White 39.3 5.9 11.3 8.5 12.2<br />
Black 46.4 7.7 11.0 7.0 10.6<br />
Hispanic 47.3 7.8 12.3 7.8 15.2<br />
Asian 38.9 3.6 12.6 10.6 17.3<br />
Native Hawaiian/<br />
Pacific Isl<strong>and</strong>er ‡ ‡ ‡ ‡ ‡<br />
American Indian/<br />
Alaska Native 38.2 9.3 ! 23.5 ‡ 23.6<br />
Two or more races 47.6 9.5 16.4 10.7 10.1<br />
College Knowledge<br />
Race/ethnicity by sex<br />
Male<br />
White 39.0 6.4 9.1 6.2 12.4<br />
Black 46.3 7.7 10.9 4.4 10.6<br />
Hispanic 48.5 9.0 9.5 4.9 16.8<br />
Asian 38.6 4.0 ! 8.5 6.9 17.3<br />
Native Hawaiian/<br />
Pacific Isl<strong>and</strong>er ‡ ‡ ‡ ‡ ‡<br />
American Indian/<br />
Alaska Native 43.2 14.0 ! 30.8 ! ‡ 21.8 !<br />
Two or more races 49.6 11.2 15.1 9.0 10.3<br />
5<br />
Female<br />
White 39.5 5.4 13.6 10.9 12.1<br />
Black 46.4 7.7 11.1 9.1 10.6<br />
Hispanic 46.1 6.5 15.1 10.8 13.6<br />
Asian 39.2 3.3 ! 16.7 14.3 17.3<br />
Native Hawaiian/<br />
Pacific Isl<strong>and</strong>er ‡ ‡ ‡ ‡ ‡<br />
American Indian/<br />
Alaska Native 32.6 ‡ 15.6 ‡ 25.6 !<br />
Two or more races 45.6 7.9 17.7 12.4 10.0<br />
! Interpret data with caution. The coefficient of variation (CV) for this estimate is 30 percent or greater.<br />
‡ Report<strong>in</strong>g st<strong>and</strong>ards not met. Either there are too few cases or the coefficient of variation (CV) is 50 percent or greater.<br />
NOTE: Students could select more than one activity; therefore, detail may not sum to totals. Data weighted by W1STUDENT. Race categories exclude<br />
persons of Hispanic ethnicity.<br />
SOURCE: U.S. Department of <strong>Education</strong>, National Center for <strong>Education</strong> Statistics, High School Longitud<strong>in</strong>al <strong>Study</strong> of 2009, Base-Year Public-Use Data File.<br />
College Knowledge 139
Indicator 28<br />
Steps Toward Postsecondary Enrollment<br />
In 2004, higher percentages of females than males had taken or planned to take<br />
college preparatory <strong>and</strong>/or entrance exams, such as the PSAT, ACT, <strong>and</strong> SAT.<br />
In 2004, some 57 percent of high school seniors had<br />
taken or planned to take the College Board PSAT <strong>and</strong><br />
82 percent had taken or planned to take the SAT or the<br />
ACT. Overall, a higher percentage of females than males<br />
had taken or planned to take these college preparatory<br />
(PSAT) or entrance (SAT or ACT) exams, a pattern that<br />
held for the White <strong>and</strong> Asian subgroups. In addition,<br />
a higher percentage of Hispanic females had taken or<br />
planned to take the SAT or ACT than Hispanic males (75<br />
vs. 68 percent). No measurable differences between males<br />
<strong>and</strong> females were found for other racial/ethnic groups.<br />
Information on students’ performance on ACT <strong>and</strong> SAT<br />
exam<strong>in</strong>ations is presented <strong>in</strong> Indicator 24.<br />
The percentage of high school seniors who had taken or<br />
planned to take college preparatory <strong>and</strong>/or entrance exams<br />
varied across racial/ethnic groups. When asked about the<br />
PSAT, a higher percentage of Asian students (70 percent)<br />
had taken or planned to take the test than all other racial/<br />
ethnic groups, with one exception: due to small sample<br />
sizes, no measurable differences were found between<br />
Asians <strong>and</strong> Native Hawaiian/Pacific Isl<strong>and</strong>ers. A higher<br />
percentage of White students (59 percent) than Black<br />
(54 percent), Hispanic (46 percent), or American Indian/<br />
Alaska Native students (44 percent) had taken or planned<br />
to take the PSAT. Additionally, a measurably higher<br />
percentage of Blacks than Hispanics had taken or planned<br />
to take the PSAT.<br />
<strong>Higher</strong> percentages of Asian students also planned to<br />
take the SAT or ACT compared with all other racial/<br />
ethnic groups, with one exception: due to small sample<br />
sizes, no measurable difference was found between Asians<br />
<strong>and</strong> Native Hawaiian/Pacific Isl<strong>and</strong>ers. The SAT/ACT<br />
pattern for Whites compared with other racial/ethnic<br />
groups differed from the PSAT pattern. For example, no<br />
measurable difference was found between the percentage<br />
of White <strong>and</strong> Black students who had taken or planned<br />
to take the SAT or ACT (84 percent each). Also, a higher<br />
percentage of Black students took or planned to take the<br />
SAT or ACT than Hispanic <strong>and</strong> American Indian/Alaska<br />
Native students (84 vs. 71 <strong>and</strong> 67 percent, respectively).<br />
Among high school seniors <strong>in</strong> 2004 who took or planned<br />
to take the SAT or ACT, the percentages who took or<br />
planned to take various steps to prepare for these tests<br />
varied across types of preparation. Overall, these students<br />
took or planned to take a special course at high school (21<br />
percent), a commercial SAT/ACT preparation course (14<br />
percent), <strong>and</strong>/or private one-to-one tutor<strong>in</strong>g for the SAT/<br />
ACT (11 percent). Additionally, they studied or planned<br />
to study from SAT/ACT preparation books (62 percent),<br />
Figure 28-1.<br />
Percentage of high school seniors who took or planned to take college entrance exam<strong>in</strong>ations, by race/<br />
ethnicity <strong>and</strong> sex: 2004<br />
Percent College Board Prelim<strong>in</strong>ary SAT (PSAT) SAT or the ACT<br />
100<br />
90<br />
80<br />
70<br />
60<br />
50<br />
40<br />
53<br />
60<br />
55<br />
63<br />
53 55<br />
43<br />
48<br />
63<br />
77<br />
36<br />
55 53<br />
59<br />
79<br />
85<br />
80<br />
88<br />
83<br />
85<br />
68<br />
75<br />
83<br />
93<br />
67 68<br />
76<br />
82<br />
30<br />
20<br />
10<br />
0<br />
Total 1 White Black Hispanic Asian American<br />
Indian/<br />
Alaska<br />
Native<br />
Two or<br />
more<br />
races<br />
Total 1 White Black Hispanic Asian American<br />
Indian/<br />
Alaska<br />
Native<br />
Two or<br />
more<br />
races<br />
Race/ethnicity<br />
Male<br />
Female<br />
1<br />
Total <strong>in</strong>cludes other racial/ethnic groups not shown separately <strong>in</strong> the figure.<br />
NOTE: Estimates were weighted by F1QWT. Report<strong>in</strong>g st<strong>and</strong>ards for Native Hawaiian/Pacific Isl<strong>and</strong>er females were not met; therefore, data for Native<br />
Hawaiian/Pacific Isl<strong>and</strong>er males <strong>and</strong> females are not shown <strong>in</strong> the figure. Race categories exclude persons of Hispanic ethnicity.<br />
SOURCE: U.S. Department of <strong>Education</strong>, National Center for <strong>Education</strong> Statistics, <strong>Education</strong> Longitud<strong>in</strong>al <strong>Study</strong> of 2002 (ELS:2002/2004), “Base Year, 2002” <strong>and</strong><br />
“First Follow-up, 2004.”<br />
140 <strong>Higher</strong> <strong>Education</strong>: <strong>Gaps</strong> <strong>in</strong> <strong>Access</strong> <strong>and</strong> <strong>Persistence</strong> <strong>Study</strong>
Figure 28-2.<br />
Percent<br />
Among high school seniors who took or planned to take the SAT or the ACT, the percentage who studied<br />
or planned to study from SAT/ACT preparation books, by race/ethnicity <strong>and</strong> sex: 2004<br />
28<br />
100<br />
90<br />
80<br />
70<br />
60<br />
50<br />
40<br />
30<br />
20<br />
10<br />
0<br />
83<br />
83<br />
74<br />
70<br />
66<br />
69<br />
70<br />
73<br />
53<br />
52<br />
50<br />
48<br />
Total 1 White Black Hispanic Asian Two or more races<br />
Race/ethnicity<br />
Male Female<br />
College Knowledge<br />
5<br />
1<br />
Total <strong>in</strong>cludes other racial/ethnic groups not shown separately <strong>in</strong> the figure.<br />
NOTE: Estimates were weighted by F1QWT. Report<strong>in</strong>g st<strong>and</strong>ards for Native Hawaiians/Pacific Isl<strong>and</strong>ers <strong>and</strong> American Indians/Alaska Natives were not met;<br />
therefore, data for these groups are not shown <strong>in</strong> the figure. Race categories exclude persons of Hispanic ethnicity.<br />
SOURCE: U.S. Department of <strong>Education</strong>, National Center for <strong>Education</strong> Statistics, <strong>Education</strong> Longitud<strong>in</strong>al <strong>Study</strong> of 2002 (ELS:2002/2004), “Base Year, 2002” <strong>and</strong><br />
“First Follow-up, 2004.”<br />
<strong>and</strong> used or planned to use SAT/ACT preparation videos<br />
(4 percent) <strong>and</strong>/or SAT/ACT preparation computer<br />
programs (36 percent). Overall, higher percentages of<br />
females than males prepared or planned to prepare for<br />
the SAT/ACT us<strong>in</strong>g the follow<strong>in</strong>g methods: tak<strong>in</strong>g<br />
commercial preparation courses, study<strong>in</strong>g from<br />
preparation books, <strong>and</strong> us<strong>in</strong>g computer programs.<br />
In 2004, the percentage of students who studied or<br />
planned to study us<strong>in</strong>g SAT/ACT preparation books—the<br />
most frequently reported preparation method—varied<br />
by sex <strong>and</strong> race/ethnicity. A higher percentage of females<br />
than males reported this method of preparation (70<br />
vs. 53 percent), a f<strong>in</strong>d<strong>in</strong>g which held across all racial/<br />
ethnic groups for which data are presented. The largest<br />
differences by sex were found among students of two<br />
or more races (24 percent), followed by Hispanics (22<br />
percent), Whites (17 percent), Blacks (14 percent), <strong>and</strong><br />
Asians (13 percent). By race/ethnicity, higher percentages<br />
of Black <strong>and</strong> Asian students (77 percent each) studied<br />
or planned to study us<strong>in</strong>g SAT/ACT preparation books<br />
than White students (58 percent), Hispanic students (64<br />
percent), <strong>and</strong> students of two or more races (61 percent).<br />
In 2004, about 93 percent of high school seniors planned<br />
to cont<strong>in</strong>ue their education after high school. A higher<br />
percentage of females than males had postsecondary<br />
aspirations (96 vs. 90 percent). This pattern held for<br />
White, Black, Hispanic, <strong>and</strong> American Indian/Alaska<br />
Native males <strong>and</strong> females. Also concern<strong>in</strong>g postsecondary<br />
aspirations, racial/ethnic differences showed that higher<br />
percentages of Blacks (95 percent) <strong>and</strong> Asians (97 percent)<br />
had postsecondary aspirations than did Hispanics (92<br />
percent), <strong>and</strong> higher percentages of Asians (97 percent)<br />
planned to cont<strong>in</strong>ue their education after high school<br />
than did American Indians/Alaska Natives (87 percent).<br />
Among high school seniors with postsecondary<br />
aspirations, 74 percent applied to at least one<br />
postsecondary <strong>in</strong>stitution while <strong>in</strong> high school: 22 percent<br />
applied to only one <strong>in</strong>stitution, 39 percent applied to<br />
two to four <strong>in</strong>stitutions, <strong>and</strong> 13 percent applied to five or<br />
more <strong>in</strong>stitutions. A higher percentage of females than<br />
males applied to at least one postsecondary <strong>in</strong>stitution<br />
while <strong>in</strong> high school (78 vs. 70 percent), a f<strong>in</strong>d<strong>in</strong>g which<br />
held for White, Black, Hispanic, <strong>and</strong> Asian students with<br />
postsecondary aspirations as well. A higher percentage<br />
of Asian students applied to at least one postsecondary<br />
<strong>in</strong>stitution than students of other racial/ethnic groups,<br />
with one exception: due to small sample sizes, no<br />
measurable differences were found between Asian<br />
<strong>and</strong> Native Hawaiian/Pacific Isl<strong>and</strong>er postsecondary<br />
applications. <strong>Higher</strong> percentages of White (76 percent)<br />
<strong>and</strong> Black (74 percent) students applied to at least one<br />
postsecondary <strong>in</strong>stitution than Hispanic (62 percent)<br />
<strong>and</strong> American Indian/Alaska Native students (60 percent).<br />
Among seniors with postsecondary aspirations, a higher<br />
percentage of females (15 percent) than males (11 percent)<br />
applied to five or more postsecondary <strong>in</strong>stitutions while<br />
<strong>in</strong> high school, a f<strong>in</strong>d<strong>in</strong>g which held for White, Hispanic,<br />
<strong>and</strong> Asian students, <strong>and</strong> students of two or more races.<br />
Across racial/ethnic groups, a higher percentage of Asian<br />
students applied to five or more postsecondary <strong>in</strong>stitutions<br />
(32 percent) than students from other groups shown. A<br />
higher percentage of Black students applied to five or<br />
more <strong>in</strong>stitutions than did White <strong>and</strong> Hispanic students<br />
(16 percent vs. 12 <strong>and</strong> 11 percent, respectively).<br />
College Knowledge 141
Technical Notes<br />
In this <strong>in</strong>dicator, “postsecondary <strong>in</strong>stitution” refers to<br />
4-year colleges or universities; 2-year community colleges;<br />
or vocational, technical, or trade schools. The student<br />
questionnaire items did not differentiate between steps<br />
students had already taken <strong>and</strong> steps they planned to<br />
take toward postsecondary education. The <strong>Education</strong><br />
Longitud<strong>in</strong>al <strong>Study</strong> of 2002 <strong>in</strong>cludes students from public<br />
<strong>and</strong> private high schools.<br />
Figure 28-3.<br />
Among high school seniors who planned to cont<strong>in</strong>ue their education after high school, percentage<br />
who applied to at least one <strong>and</strong> to five or more postsecondary <strong>in</strong>stitutions while <strong>in</strong> high school, by race/<br />
ethnicity <strong>and</strong> sex: 2004<br />
Percent Applied to at least one <strong>in</strong>stitution Applied to five or more <strong>in</strong>stitutions<br />
100<br />
90<br />
80<br />
70<br />
60<br />
50<br />
40<br />
30<br />
20<br />
10<br />
0<br />
70<br />
78<br />
72<br />
81<br />
69<br />
78<br />
Total 1 White Black Hispanic Asian American<br />
Indian/<br />
Alaska<br />
Native<br />
58<br />
66<br />
79<br />
91<br />
66<br />
54<br />
75 78 11<br />
Two or<br />
more<br />
races<br />
16<br />
10 14 15 17<br />
Total 1 White Black Hispanic Asian Two or<br />
more<br />
races<br />
8<br />
13<br />
25<br />
39<br />
12<br />
21<br />
Race/ethnicity<br />
Male<br />
Female<br />
1<br />
Total <strong>in</strong>cludes other racial/ethnic groups not shown separately <strong>in</strong> the figure.<br />
NOTE: Estimates were weighted by F1QWT. Report<strong>in</strong>g st<strong>and</strong>ards for Native Hawaiian/Pacific Isl<strong>and</strong>er females who applied to at least one <strong>in</strong>stitution <strong>and</strong><br />
who applied to five or more <strong>in</strong>stitutions <strong>and</strong> American Indians/Alaska Natives who applied to five or more <strong>in</strong>stitutions were not met; therefore, data for these<br />
groups are not shown <strong>in</strong> the figure. Race categories exclude persons of Hispanic ethnicity.<br />
SOURCE: U.S. Department of <strong>Education</strong>, National Center for <strong>Education</strong> Statistics, <strong>Education</strong> Longitud<strong>in</strong>al <strong>Study</strong> of 2002 (ELS:2002/2004), “Base Year, 2002” <strong>and</strong><br />
“First Follow-up, 2004.”<br />
142 <strong>Higher</strong> <strong>Education</strong>: <strong>Gaps</strong> <strong>in</strong> <strong>Access</strong> <strong>and</strong> <strong>Persistence</strong> <strong>Study</strong>
Table 28-1.<br />
Sex <strong>and</strong> race/ethnicity<br />
Sex<br />
Percentage of high school seniors who took or planned to take college preparatory <strong>and</strong>/or entrance<br />
exam<strong>in</strong>ations, by type of exam<strong>in</strong>ation, sex, <strong>and</strong> race/ethnicity: 2004<br />
College Board<br />
Prelim<strong>in</strong>ary SAT (PSAT)<br />
SAT or ACT<br />
Total 56.5 81.9<br />
Male 53.0 78.6<br />
Female 60.0 85.3<br />
Race/ethnicity<br />
White 58.9 84.2<br />
Black 54.0 83.6<br />
Hispanic 45.6 71.3<br />
Asian 70.1 88.0<br />
Native Hawaiian/Pacific Isl<strong>and</strong>er 56.6 72.6<br />
American Indian/Alaska Native 43.7 67.3<br />
Two or more races 56.3 78.9<br />
Race/ethnicity by sex<br />
Male<br />
White 54.9 80.3<br />
Black 53.1 82.7<br />
Hispanic 42.9 67.7<br />
Asian 63.4 83.4<br />
Native Hawaiian/Pacific Isl<strong>and</strong>er 58.1 70.5<br />
American Indian/Alaska Native 36.0 66.5<br />
Two or more races 53.1 76.1<br />
28<br />
College Knowledge<br />
5<br />
Female<br />
White 62.9 88.1<br />
Black 54.9 84.5<br />
Hispanic 48.1 74.7<br />
Asian 77.3 92.8<br />
Native Hawaiian/Pacific Isl<strong>and</strong>er ‡ ‡<br />
American Indian/Alaska Native 54.5 68.2<br />
Two or more races 59.3 81.6<br />
‡ Report<strong>in</strong>g st<strong>and</strong>ards not met (too few cases).<br />
NOTE: Estimates were weighted by F1QWT. Race categories exclude persons of Hispanic ethnicity.<br />
SOURCE: U.S. Department of <strong>Education</strong>, National Center for <strong>Education</strong> Statistics, <strong>Education</strong> Longitud<strong>in</strong>al <strong>Study</strong> of 2002 (ELS:2002/2004), “Base Year,<br />
2002” <strong>and</strong> “First Follow-up, 2004.”<br />
College Knowledge 143
144 <strong>Higher</strong> <strong>Education</strong>: <strong>Gaps</strong> <strong>in</strong> <strong>Access</strong> <strong>and</strong> <strong>Persistence</strong> <strong>Study</strong><br />
Table 28-2.<br />
Sex <strong>and</strong> race/ethnicity<br />
Sex<br />
Among high school seniors who took or planned to take the SAT or the ACT, percentage who took or planned to take various steps to prepare for these<br />
tests, by type of preparation, sex, <strong>and</strong> race/ethnicity: 2004<br />
Took or planned<br />
to take a special<br />
course at<br />
high school<br />
Took or planned<br />
to take commercial<br />
SAT/ACT preparation<br />
course<br />
Took or planned<br />
to take private<br />
one-to-one tutor<strong>in</strong>g<br />
for SAT/ACT<br />
Studied or<br />
planned to study<br />
from SAT/ACT<br />
preparation books<br />
Used or planned to<br />
use SAT/ACT<br />
preparation<br />
video tape<br />
Used or planned<br />
to use SAT/ACT<br />
preparation<br />
computer program<br />
Total 21.4 14.0 10.6 62.2 4.4 36.5<br />
Male 21.7 12.8 9.8 53.1 4.6 32.1<br />
Female 21.1 15.1 11.3 70.2 4.3 40.3<br />
Race/ethnicity<br />
White 19.0 11.9 8.8 58.2 3.4 33.8<br />
Black 29.2 19.2 20.0 76.6 8.1 49.1<br />
Hispanic 24.5 15.1 10.9 64.4 7.6 37.0<br />
Asian 25.7 28.2 10.8 76.8 1.6 37.6<br />
Native Hawaiian/<br />
Pacific Isl<strong>and</strong>er ‡ ‡ ‡ ‡ ‡ ‡<br />
American Indian/<br />
Alaska Native ‡ 12.0 ! ‡ 62.5 ‡ 36.0<br />
Two or more races 24.2 17.8 11.4 61.5 4.1 ! 39.7<br />
Race/ethnicity by sex<br />
Male<br />
White 19.1 11.4 7.5 49.5 3.8 29.0<br />
Black 31.2 17.7 22.0 69.3 9.0 44.8<br />
Hispanic 24.1 11.2 11.5 52.0 4.7 35.9<br />
Asian 22.5 23.3 9.3 70.4 1.6 ! 29.1<br />
Native Hawaiian/<br />
Pacific Isl<strong>and</strong>er ‡ ‡ ‡ ‡ ‡ ‡<br />
American Indian/<br />
Alaska Native ‡ ‡ ‡ ‡ ‡ ‡<br />
Two or more races 27.8 13.6 ‡ 48.4 4.4 ! 37.7<br />
Female<br />
White 18.9 12.2 10.0 66.1 3.0 38.0<br />
Black 27.5 20.5 18.3 83.3 7.2 53.0<br />
Hispanic 24.8 18.1 10.5 74.0 9.8 37.9<br />
Asian 28.8 33.1 12.2 83.2 1.6 ! 46.1<br />
Native Hawaiian/<br />
Pacific Isl<strong>and</strong>er ‡ ‡ ‡ ‡ ‡ ‡<br />
American Indian/<br />
Alaska Native ‡ ‡ ‡ ‡ ‡ ‡<br />
Two or more races 21.2 21.3 15.3 72.8 3.8 ! 41.3<br />
! Interpret data with caution. The coefficient of variation (CV) for this estimate exceeds 30 percent.<br />
‡ Report<strong>in</strong>g st<strong>and</strong>ards not met (too few cases).<br />
NOTE: Estimates were weighted by F1QWT. Race categories exclude persons of Hispanic ethnicity.<br />
SOURCE: U.S. Department of <strong>Education</strong>, National Center for <strong>Education</strong> Statistics, <strong>Education</strong> Longitud<strong>in</strong>al <strong>Study</strong> of 2002 (ELS:2002/2004), “Base Year, 2002” <strong>and</strong> “First Follow-up, 2004.”
Table 28-3.<br />
Sex <strong>and</strong> race/ethnicity<br />
Sex<br />
Among high school seniors who planned to cont<strong>in</strong>ue their education after high school, percentage who<br />
applied to one or more postsecondary <strong>in</strong>stitutions while <strong>in</strong> high school, by sex <strong>and</strong> race/ethnicity: 2004<br />
Seniors who<br />
planned to<br />
cont<strong>in</strong>ue their<br />
education after<br />
high school<br />
At least one<br />
<strong>in</strong>stitution<br />
Seniors who applied to<br />
One<br />
<strong>in</strong>stitution<br />
only<br />
Two to four<br />
<strong>in</strong>stitutions<br />
Five or more<br />
<strong>in</strong>stitutions<br />
Total 93.1 74.2 22.1 38.7 13.4<br />
Male 90.2 69.7 21.3 37.2 11.2<br />
Female 95.9 78.4 22.8 40.2 15.5<br />
Race/ethnicity<br />
White 93.1 76.4 25.0 39.3 12.1<br />
Black 94.6 73.6 15.2 42.7 15.8<br />
Hispanic 91.5 62.4 19.2 32.5 10.6<br />
Asian 97.1 84.9 15.9 37.5 31.5<br />
Native Hawaiian/Pacific Isl<strong>and</strong>er 94.6 63.6 12.6 ! 34.6 ! ‡<br />
American Indian/Alaska Native 87.4 60.4 13.0 ! 34.4 ‡<br />
Two or more races 90.7 76.8 19.4 41.1 16.4<br />
28<br />
College Knowledge<br />
Race/ethnicity by sex<br />
Male<br />
White 90.2 71.5 24.5 36.9 10.1<br />
Black 92.9 69.1 13.2 41.2 14.6<br />
Hispanic 87.7 58.3 16.7 33.3 8.4<br />
Asian 96.0 78.9 16.5 37.9 24.5<br />
Native Hawaiian/Pacific Isl<strong>and</strong>er 97.1 53.2 ! ‡ 28.9 ! ‡<br />
American Indian/Alaska Native 81.4 65.8 16.6 ! 38.7 ‡<br />
Two or more races 87.4 75.4 21.7 41.9 11.7<br />
5<br />
Female<br />
White 96.0 81.0 25.4 41.7 14.0<br />
Black 96.3 77.8 17.0 44.0 16.8<br />
Hispanic 95.0 65.9 21.4 31.9 12.6<br />
Asian 98.3 91.1 15.4 37.0 38.7<br />
Native Hawaiian/Pacific Isl<strong>and</strong>er ‡ ‡ ‡ ‡ ‡<br />
American Indian/Alaska Native 95.8 53.9 ‡ 29.1 ‡<br />
Two or more races 93.9 78.1 17.2 40.3 20.6<br />
! Interpret data with caution. The coefficient of variation (CV) for this estimate exceeds 30 percent.<br />
‡ Report<strong>in</strong>g st<strong>and</strong>ards not met (too few cases).<br />
NOTE: Estimates for percentage of students who planned to cont<strong>in</strong>ue their education after high school were weighted by F1PNLWT, <strong>and</strong> the rema<strong>in</strong><strong>in</strong>g<br />
estimates were weighted by F1QWT. Race categories exclude persons of Hispanic ethnicity.<br />
SOURCE: U.S. Department of <strong>Education</strong>, National Center for <strong>Education</strong> Statistics, <strong>Education</strong> Longitud<strong>in</strong>al <strong>Study</strong> of 2002 (ELS:2002/2004), “Base Year,<br />
2002” <strong>and</strong> “First Follow-up, 2004.”<br />
College Knowledge 145
Indicator 29<br />
Informational Resources<br />
In 2004, the percentage of high school seniors with postsecondary aspirations<br />
who consulted college websites, publications, or search guides for <strong>in</strong>formation<br />
on college entrance requirements was higher for females than males (80 vs.<br />
68 percent).<br />
In 2004, some 93 percent of high school seniors had<br />
postsecondary aspirations. Of these, 85 percent consulted<br />
a school counselor, teacher, or coach for <strong>in</strong>formation<br />
on college entrance requirements. Other <strong>in</strong>formational<br />
resources that seniors consulted <strong>in</strong>cluded parents, sibl<strong>in</strong>gs,<br />
or relatives (70 percent), friends (52 percent), college<br />
websites, publications, or search guides (74 percent),<br />
college representatives (59 percent), <strong>and</strong> school libraries,<br />
public libraries, or college libraries (20 percent). Three<br />
percent of seniors with plans to cont<strong>in</strong>ue their education<br />
Figure 29-1.<br />
Among high school seniors who planned to cont<strong>in</strong>ue their education after high school, percentage<br />
who used <strong>in</strong>formational resources on college entrance requirements, by selected types of <strong>in</strong>formational<br />
resources, race/ethnicity, <strong>and</strong> sex: 2004<br />
Race/ethnicity<br />
83<br />
86<br />
School<br />
counselor,<br />
teacher,<br />
or coach<br />
Parent,<br />
sibl<strong>in</strong>g, or<br />
relative<br />
College<br />
websites,<br />
publications,<br />
or search<br />
guides<br />
White<br />
Black<br />
Hispanic<br />
Asian<br />
American Indian/<br />
Alaska Native<br />
Two or more races<br />
Total 1<br />
White<br />
Black<br />
Hispanic<br />
Asian<br />
American Indian/<br />
Alaska Native<br />
Two or more races<br />
Total 1<br />
White<br />
Black<br />
Hispanic<br />
Asian<br />
American Indian/<br />
Alaska Native<br />
Two or more races<br />
50<br />
55<br />
57<br />
Total 1 0 20 40 60 80 100<br />
64<br />
65<br />
64<br />
83<br />
86<br />
88<br />
87<br />
81<br />
87<br />
84<br />
89<br />
80<br />
78<br />
77<br />
88<br />
67<br />
73<br />
69<br />
74<br />
69<br />
76<br />
68<br />
68<br />
70<br />
69<br />
70<br />
72<br />
73<br />
74<br />
76<br />
75<br />
80<br />
80<br />
78<br />
82<br />
84<br />
85<br />
Percent<br />
Male<br />
Female<br />
1<br />
Total <strong>in</strong>cludes other racial/ethnic groups not shown separately <strong>in</strong> the figure.<br />
NOTE: Estimates were weighted by F1QWT. Report<strong>in</strong>g st<strong>and</strong>ards for Native Hawaiians/Pacific Isl<strong>and</strong>ers were not met; therefore, data for this group are not<br />
shown <strong>in</strong> the figure. Race categories exclude persons of Hispanic ethnicity.<br />
SOURCE: U.S. Department of <strong>Education</strong>, National Center for <strong>Education</strong> Statistics, <strong>Education</strong> Longitud<strong>in</strong>al <strong>Study</strong> of 2002 (ELS:2002/2004), “Base year, 2002” <strong>and</strong><br />
“First Follow-up, 2004.”<br />
146 <strong>Higher</strong> <strong>Education</strong>: <strong>Gaps</strong> <strong>in</strong> <strong>Access</strong> <strong>and</strong> <strong>Persistence</strong> <strong>Study</strong>
did not consult any of these resources for <strong>in</strong>formation on<br />
college entrance requirements.<br />
Overall, among high school seniors with postsecondary<br />
aspirations, a higher percentage of females than males<br />
went to a high school counselor, teacher, or coach for<br />
<strong>in</strong>formation on college entrance requirements (86 vs. 83<br />
percent). Across racial/ethnic groups, a higher percentage<br />
of Native Hawaiian/Pacific Isl<strong>and</strong>er seniors reported go<strong>in</strong>g<br />
to high school staff for college entrance <strong>in</strong>formation than<br />
did Whites, Hispanics, <strong>and</strong> those of two or more races (94<br />
percent vs. 85, 84, <strong>and</strong> 83 percent, respectively).<br />
Among high school seniors with postsecondary<br />
aspirations, a higher percentage of females than males<br />
consulted college websites, publications, or search guides<br />
for <strong>in</strong>formation on college entrance requirements (80<br />
vs. 68 percent). This pattern held for Whites (82 vs. 70<br />
percent), Blacks (80 vs. 64 percent), Hispanics (68 vs. 55<br />
percent), Asians (84 vs. 75 percent), <strong>and</strong> those of two or<br />
more races (85 vs. 70 percent).<br />
An exam<strong>in</strong>ation of overall racial/ethnic group differences<br />
for college websites, publications, or search guides shows<br />
that a lower percentage of Native Hawaiians/Pacific<br />
Isl<strong>and</strong>ers consulted these resources than any other racial/<br />
ethnic group, with the exception of Hispanic students.<br />
Additionally, higher percentages of Whites (76 percent),<br />
Blacks (73 percent), Asians (79 percent), <strong>and</strong> those of two<br />
or more races (78 percent) consulted these resources than<br />
did Hispanics (63 percent).<br />
In 2004, a higher percentage of females than males<br />
consulted college representatives for <strong>in</strong>formation about<br />
college entrance requirements (62 vs. 55 percent). This<br />
pattern was also found for White <strong>and</strong> Hispanic males<br />
<strong>and</strong> females. Overall, a lower percentage of Hispanic<br />
students went to college representatives for <strong>in</strong>formation<br />
on college entrance requirements than did White, Black,<br />
<strong>and</strong> Asian students (53 percent vs. 59, 62, <strong>and</strong> 63 percent,<br />
respectively).<br />
29<br />
College Knowledge<br />
5<br />
College Knowledge 147
148 <strong>Higher</strong> <strong>Education</strong>: <strong>Gaps</strong> <strong>in</strong> <strong>Access</strong> <strong>and</strong> <strong>Persistence</strong> <strong>Study</strong><br />
Table 29-1.<br />
Sex <strong>and</strong> race/ethnicity<br />
Sex<br />
Percentage of high school seniors who planned to cont<strong>in</strong>ue their education after high school <strong>and</strong>, among seniors who planned to cont<strong>in</strong>ue, the<br />
percentage who used <strong>in</strong>formational resources on college entrance requirements, by type of <strong>in</strong>formational resource, sex, <strong>and</strong> race/ethnicity: 2004<br />
Seniors who<br />
planned to<br />
cont<strong>in</strong>ue their<br />
education after<br />
high school<br />
School counselor,<br />
teacher, or<br />
coach<br />
Parent,<br />
sibl<strong>in</strong>g, or<br />
relative<br />
Friend<br />
Type of <strong>in</strong>formational resource<br />
College websites,<br />
publications, or<br />
search guides<br />
College<br />
representatives<br />
School,<br />
public, or<br />
college library<br />
None of these<br />
sources<br />
Total 93.1 84.8 70.1 52.4 74.1 58.7 19.9 2.8<br />
Male 90.2 83.2 67.1 48.1 67.9 55.4 18.5 4.5<br />
Female 95.9 86.3 72.9 56.2 79.8 61.8 21.1 1.3<br />
Race/ethnicity<br />
White 93.1 84.6 71.3 51.1 76.2 59.0 18.0 3.0<br />
Black 94.6 87.4 72.7 53.8 72.5 62.3 30.2 2.0 !<br />
Hispanic 91.5 83.9 61.1 50.4 62.6 53.4 19.1 3.5<br />
Asian 97.1 86.2 72.8 72.3 79.3 62.9 17.9 ‡<br />
Native Hawaiian/<br />
Pacific Isl<strong>and</strong>er 94.6 93.5 74.0 55.4 39.1 ! 52.2 ‡ #<br />
American Indian/<br />
Alaska Native 87.4 79.3 62.2 42.7 73.9 60.1 33.4 ‡<br />
Two or more races 90.7 82.8 69.8 56.9 77.7 56.8 21.1 2.7 !<br />
Race/ethnicity by sex<br />
Male<br />
White 90.2 83.1 68.6 46.5 70.2 56.2 16.6 4.7<br />
Black 92.9 87.6 68.6 52.2 64.2 59.2 29.2 2.7 !<br />
Hispanic 87.7 80.7 56.9 44.8 55.4 46.8 17.8 6.4<br />
Asian 96.0 83.7 72.4 69.9 74.6 59.5 16.1 ‡<br />
Native Hawaiian/<br />
Pacific Isl<strong>and</strong>er ‡ ‡ ‡ ‡ ‡ ‡ ‡ ‡<br />
American Indian/<br />
Alaska Native 81.4 80.4 50.3 29.8 ! 78.4 58.0 35.8 ! ‡<br />
Two or more races 87.4 77.4 65.3 53.4 70.2 51.5 19.2 ‡<br />
Female<br />
White 96.0 86.0 73.8 55.4 81.8 61.5 19.3 1.3<br />
Black 96.3 87.2 76.3 55.2 79.7 64.9 31.1 ‡<br />
Hispanic 95.0 86.5 64.4 54.9 68.3 58.7 20.1 1.2 !<br />
Asian 98.3 88.8 73.2 74.9 84.2 66.5 19.8 ‡<br />
Native Hawaiian/<br />
Pacific Isl<strong>and</strong>er ‡ ‡ ‡ ‡ ‡ ‡ ‡ ‡<br />
American Indian/<br />
Alaska Native 95.8 78.1 76.2 58.0 68.7 62.6 30.6 ! #<br />
Two or more races 93.9 87.8 74.0 60.2 84.7 61.8 22.9 ‡<br />
# Rounds to zero.<br />
! Interpret data with caution. The coefficient of variation (CV) for this estimate is 30 percent or greater.<br />
‡ Report<strong>in</strong>g st<strong>and</strong>ards not met. Either there are too few cases or the coefficient of variation (CV) is 50 percent or greater.<br />
NOTE: Estimates for percentage of students who planned to cont<strong>in</strong>ue their education after high school were weighted by F1PNLWT, <strong>and</strong> the rema<strong>in</strong><strong>in</strong>g estimates were weighted by F1QWT. Race categories exclude<br />
persons of Hispanic ethnicity.<br />
SOURCE: U.S. Department of <strong>Education</strong>, National Center for <strong>Education</strong> Statistics, <strong>Education</strong> Longitud<strong>in</strong>al <strong>Study</strong> of 2002 (ELS:2002/2004), “Base year, 2002” <strong>and</strong> “First Follow-up, 2004.”
29<br />
College Knowledge<br />
5<br />
This page <strong>in</strong>tentionally left blank.<br />
College Knowledge 149
Indicator 30<br />
Postsecondary School Choice Factors<br />
In 2004, among high school seniors with plans to cont<strong>in</strong>ue their education,<br />
higher percentages of females than males reported the availability of courses,<br />
low expenses, the availability of f<strong>in</strong>ancial aid, <strong>and</strong> the academic reputation of a<br />
postsecondary <strong>in</strong>stitution as very important factors <strong>in</strong> their school selection process.<br />
In 2004, among the 93 percent of high school seniors<br />
with postsecondary aspirations, 67 percent reported that<br />
the availability of courses was very important to them<br />
when select<strong>in</strong>g an educational <strong>in</strong>stitution. Seniors with<br />
postsecondary aspirations also reported the follow<strong>in</strong>g<br />
postsecondary characteristics as very important: low<br />
expenses (36 percent), the availability of f<strong>in</strong>ancial aid<br />
(57 percent), academic reputation (58 percent), athletic<br />
program (15 percent), active social life (30 percent),<br />
easy admission (23 percent), <strong>and</strong> racial/ethnic makeup<br />
(14 percent). <strong>Higher</strong> percentages of females than males<br />
considered low expenses, the availability of f<strong>in</strong>ancial<br />
aid, <strong>and</strong> academic reputation to be very important to<br />
their school choice. The reverse was observed (higher<br />
percentages of males than females) regard<strong>in</strong>g the<br />
importance of an <strong>in</strong>stitution’s athletic programs <strong>and</strong><br />
social life.<br />
Concern<strong>in</strong>g the availability of courses, 62 percent of males<br />
reported this factor as very important to their selection<br />
of a postsecondary <strong>in</strong>stitution, compared to 71 percent<br />
of females. Differences between males <strong>and</strong> females were<br />
also found with<strong>in</strong> some racial/ethnic groups, specifically,<br />
Whites, Blacks, <strong>and</strong> Hispanics. For example, 69 percent<br />
of Black males considered the availability of courses to<br />
be a very important school selection factor, compared to<br />
79 percent of Black females. No measurable differences<br />
between males <strong>and</strong> females were found for Asians,<br />
American Indians/Alaska Natives, <strong>and</strong> those of two<br />
or more races. Overall, the percentage of Black seniors<br />
report<strong>in</strong>g the availability of courses as very important<br />
(74 percent) was higher than the percentages of White,<br />
Hispanic, <strong>and</strong> Asian seniors (65 percent each).<br />
Low expenses were reported as a very important factor<br />
<strong>in</strong> the choice of postsecondary <strong>in</strong>stitutions by 33 percent<br />
of males, compared to 38 percent of females. Differences<br />
between males <strong>and</strong> females were also found for Whites<br />
(27 vs. 32 percent), Hispanics (40 vs. 47 percent), <strong>and</strong><br />
students of two or more races (34 vs. 49 percent). Across<br />
racial/ethnic groups, a higher percentage of Blacks<br />
reported low expenses as very important than did Whites,<br />
Hispanics, Asians, American Indians/Alaska Natives,<br />
<strong>and</strong> those of two or more races. Additionally, a higher<br />
Figure 30-1.<br />
Percentage of high school seniors with postsecondary aspirations who reported low postsecondary<br />
school expenses <strong>and</strong> the availability of f<strong>in</strong>ancial aid as very important to their decisions, by race/<br />
ethnicity <strong>and</strong> sex: 2004<br />
Percent Low expenses F<strong>in</strong>ancial aid<br />
100<br />
80<br />
60<br />
40<br />
33<br />
38<br />
53 54<br />
28 32<br />
40<br />
47<br />
34 31<br />
37!<br />
32 34<br />
50 51<br />
63<br />
43<br />
57<br />
72<br />
80<br />
65<br />
76<br />
55 62 57<br />
71<br />
55<br />
68<br />
20<br />
0<br />
Total 1 White Black Hispanic Asian American<br />
Indian/<br />
Alaska<br />
Native<br />
Two or Total 1 White Black Hispanic Asian American Two or<br />
more<br />
Indian/ more<br />
races<br />
Alaska races<br />
Native<br />
Race/ethnicity<br />
Male<br />
Female<br />
! Interpret data with caution. The coefficient of variation (CV) for this estimate is 30 percent or greater.<br />
1<br />
Total <strong>in</strong>cludes other racial/ethnic groups not shown separately <strong>in</strong> the figure.<br />
NOTE: Estimates were weighted by F1QWT. Report<strong>in</strong>g st<strong>and</strong>ards for Native Hawaiian/Pacific Isl<strong>and</strong>er females were not met; therefore, data for Native<br />
Hawaiian/Pacific Isl<strong>and</strong>er males <strong>and</strong> females are not shown <strong>in</strong> the figure. Race categories exclude persons of Hispanic ethnicity.<br />
SOURCE: U.S. Department of <strong>Education</strong>, National Center for <strong>Education</strong> Statistics, <strong>Education</strong> Longitud<strong>in</strong>al <strong>Study</strong> of 2002 (ELS:2002/2004), “Base Year, 2002” <strong>and</strong><br />
“First Follow-up, 2004.”<br />
150 <strong>Higher</strong> <strong>Education</strong>: <strong>Gaps</strong> <strong>in</strong> <strong>Access</strong> <strong>and</strong> <strong>Persistence</strong> <strong>Study</strong>
Figure 30-2.<br />
Percentage of high school seniors with postsecondary aspirations who reported postsecondary<br />
<strong>in</strong>stitution’s athletic program <strong>and</strong> active social life as very important, by race/ethnicity <strong>and</strong> sex: 2004<br />
30<br />
Percent Athletic program Social life<br />
100<br />
80<br />
60<br />
40<br />
20<br />
0<br />
19<br />
11<br />
15<br />
10<br />
36<br />
18<br />
21<br />
11<br />
15<br />
7<br />
25<br />
11<br />
Total 1 White Black Hispanic Asian Two or<br />
more<br />
races<br />
Total 1 White Black Hispanic Asian American<br />
Indian/<br />
Alaska<br />
Native<br />
Two or<br />
more<br />
races<br />
Race/ethnicity<br />
Male<br />
33<br />
27<br />
31 28<br />
42<br />
Female<br />
30<br />
34<br />
22<br />
33<br />
23<br />
40<br />
15!<br />
39<br />
30<br />
College Knowledge<br />
5<br />
! Interpret data with caution. The coefficient of variation (CV) for this estimate is 30 percent or greater.<br />
1<br />
Total <strong>in</strong>cludes other racial/ethnic groups not shown separately <strong>in</strong> the figure.<br />
NOTE: Estimates were weighted by F1QWT. Report<strong>in</strong>g st<strong>and</strong>ards for American Indian/Alaska Native females <strong>and</strong> for Native Hawaiians/Pacific Isl<strong>and</strong>ers who<br />
reported athletic programs as very important were not met; therefore, data for American Indian/Alaska Native <strong>and</strong> Native Hawaiian/Pacific Isl<strong>and</strong>er males<br />
<strong>and</strong> females are not shown <strong>in</strong> the figure. Race categories exclude persons of Hispanic ethnicity.<br />
SOURCE: U.S. Department of <strong>Education</strong>, National Center for <strong>Education</strong> Statistics, <strong>Education</strong> Longitud<strong>in</strong>al <strong>Study</strong> of 2002 (ELS:2002/2004), “Base Year, 2002” <strong>and</strong><br />
“First Follow-up, 2004.”<br />
percentage of Hispanic high school seniors than White<br />
<strong>and</strong> Asian high school seniors reported this factor as very<br />
important (44 percent vs. 30 <strong>and</strong> 33 percent, respectively).<br />
The availability of f<strong>in</strong>ancial aid also varied <strong>in</strong> importance<br />
by sex <strong>and</strong> race/ethnicity. Overall, a higher percentage<br />
of females (63 percent) than males (51 percent) reported<br />
this factor as very important <strong>in</strong> 2004. With<strong>in</strong> racial/<br />
ethnic groups, a similar pattern was found for Whites<br />
(57 vs. 43 percent), Blacks (80 vs. 72 percent), Hispanics<br />
(76 vs. 65 percent), <strong>and</strong> those of two or more races<br />
(68 vs. 55 percent). Differences across racial/ethnic groups<br />
<strong>in</strong>clude a higher percentage of Blacks than seniors <strong>in</strong><br />
all other racial/ethnic groups report<strong>in</strong>g the availability<br />
of f<strong>in</strong>ancial aid as very important, as well as a higher<br />
percentage of Hispanics than Whites, Asians, Native<br />
Hawaiians/Pacific Isl<strong>and</strong>ers, <strong>and</strong> those of two or more<br />
races.<br />
Academic reputation was also among the factors that<br />
a higher percentage of females than males (63 vs.<br />
52 percent) reported as very important <strong>in</strong> the choice of<br />
a postsecondary <strong>in</strong>stitution <strong>in</strong> 2004. A similar pattern<br />
was found for Whites (63 vs. 49 percent), Blacks (72 vs.<br />
60 percent), <strong>and</strong> Asians (72 vs. 62 percent). Across racial/<br />
ethnic groups, higher percentages of both Blacks <strong>and</strong><br />
Asians cited an <strong>in</strong>stitution’s academic reputation as a very<br />
important factor than did Whites, Hispanics, <strong>and</strong> those<br />
of two or more races.<br />
A higher percentage of males than females rated other<br />
school choice factors as very important <strong>in</strong> their selection<br />
of postsecondary <strong>in</strong>stitutions. For example, among seniors<br />
with postsecondary aspirations, 15 percent thought an<br />
<strong>in</strong>stitution’s athletic program was very important <strong>and</strong><br />
30 percent thought an <strong>in</strong>stitution’s social life was very<br />
important. However, higher percentages of males than<br />
females reported athletic programs (19 vs. 11 percent) <strong>and</strong><br />
social life (33 vs. 27 percent) as very important. A similar<br />
pattern was found for Whites, Blacks, Hispanics, Asians,<br />
<strong>and</strong> those of two or more races for an <strong>in</strong>stitution’s athletic<br />
programs <strong>and</strong> for Whites, Blacks, Hispanics, Asians, <strong>and</strong><br />
American Indians/Alaska Natives for its social life.<br />
Differences were also found across racial/ethnic groups<br />
for an <strong>in</strong>stitution’s athletic programs <strong>and</strong> social life. A<br />
higher percentage of Blacks (26 percent) reported athletic<br />
programs as a very important factor than did Whites<br />
(12 percent), Hispanics (15 percent), Asians (11 percent),<br />
<strong>and</strong> those of two or more races (17 percent). The<br />
percentage of Hispanic seniors who reported this factor<br />
as very important was also higher than the percentages<br />
of Whites <strong>and</strong> Asians. Similarly, a higher percentage of<br />
Blacks (35 percent) reported an <strong>in</strong>stitution’s social life<br />
as a very important factor than did Whites (30 percent),<br />
Hispanics (28 percent), <strong>and</strong> Asians (28 percent).<br />
Two other postsecondary school choice factors—easy<br />
admission <strong>and</strong> racial/ethnic makeup—were reported as<br />
very important by 23 percent <strong>and</strong> 14 percent, respectively,<br />
of seniors with college aspirations. Although no significant<br />
differences were found between males <strong>and</strong> females overall<br />
or between males <strong>and</strong> females with<strong>in</strong> each racial/ethnic<br />
group, differences were observed across race/ethnicity.<br />
College Knowledge 151
For example, a lower percentage of Whites (17 percent)<br />
reported easy admission as a very important factor than<br />
did Blacks (41 percent), Hispanics (31 percent), Asians<br />
(21 percent), <strong>and</strong> those of two or more races (27 percent).<br />
In addition, the percentage of Blacks report<strong>in</strong>g easy<br />
admission as very important was higher than that of<br />
Hispanics, Asians, <strong>and</strong> those of two or more races,<br />
<strong>and</strong> the percentage of Hispanics report<strong>in</strong>g it as very<br />
important was higher than that of Asians. Concern<strong>in</strong>g<br />
an <strong>in</strong>stitution’s racial/ethnic makeup, a lower percentage<br />
of Whites (8 percent) reported this factor as very<br />
important than did Blacks (31 percent), Hispanics<br />
(19 percent), Asians (19 percent), <strong>and</strong> those of two or<br />
more races (20 percent). In addition, the percentage<br />
of Blacks who reported racial/ethnic makeup as very<br />
important was higher than the percentages of students<br />
of all other races/ethnicities.<br />
152 <strong>Higher</strong> <strong>Education</strong>: <strong>Gaps</strong> <strong>in</strong> <strong>Access</strong> <strong>and</strong> <strong>Persistence</strong> <strong>Study</strong>
Table 30-1.<br />
Sex <strong>and</strong> race/ethnicity<br />
Sex<br />
Percentage of high school seniors with postsecondary aspirations who reported select school choice factors as very important, by school choice factor,<br />
sex, <strong>and</strong> race/ethnicity: 2004<br />
Seniors who<br />
planned to<br />
cont<strong>in</strong>ue their<br />
education after<br />
high school<br />
Availability<br />
of courses<br />
Low<br />
expenses<br />
Select school choice factors among seniors with postsecondary aspirations<br />
F<strong>in</strong>ancial aid<br />
Reputation<br />
of <strong>in</strong>stitution<br />
Athletic<br />
program<br />
Active<br />
social life<br />
Easy<br />
admission<br />
Total 93.1 66.6 35.6 57.4 57.9 14.8 30.1 22.9 13.9<br />
Male 90.2 62.5 33.2 50.9 51.9 19.0 33.5 22.8 13.8<br />
Female 95.9 70.5 37.7 63.5 63.4 10.8 27.1 22.9 14.0<br />
Race/ethnicity<br />
White 93.1 65.2 29.6 50.0 56.4 12.3 29.5 17.1 8.4<br />
Black 94.6 74.4 53.8 76.2 66.4 26.2 35.4 40.8 31.1<br />
Hispanic 91.5 65.5 43.6 70.7 53.6 15.3 27.7 30.7 18.7<br />
Racial/<br />
ethnic<br />
makeup<br />
Asian 97.1 65.1 32.6 58.4 67.0 10.7 27.7 20.7 19.1<br />
Native Hawaiian/<br />
Pacific Isl<strong>and</strong>er 94.6 68.9 39.7 46.1 54.1 ‡ 28.9 ! ‡ ‡<br />
American Indian/<br />
Alaska Native 87.4 66.9 34.7 63.1 62.8 19.0 ! 28.6 27.2 15.2 !<br />
Two or more races 90.7 69.0 42.3 62.0 57.3 17.5 34.1 27.1 19.8<br />
Race/ethnicity by sex<br />
Male<br />
White 90.2 60.7 27.5 43.0 49.4 15.0 31.2 16.8 8.0<br />
Black 92.9 69.0 53.3 71.6 60.0 35.6 41.8 41.1 33.5<br />
Hispanic 87.7 61.9 39.7 64.8 50.4 20.6 34.2 30.8 19.0<br />
Asian 96.0 63.3 33.7 55.2 62.3 14.8 32.6 21.3 18.0<br />
Native Hawaiian/<br />
Pacific Isl<strong>and</strong>er 97.1 75.2 35.1 ! 41.5 ! 55.9 ‡ ‡ ‡ ‡<br />
American Indian/<br />
Alaska Native 81.4 68.2 37.0 ! 56.9 63.4 31.7 39.9 36.0 13.9 !<br />
Two or more races 87.4 67.0 34.4 55.2 55.0 25.2 39.0 31.9 19.8<br />
College Knowledge 153<br />
Female<br />
White 96.0 69.4 31.7 56.6 62.9 9.8 28.0 17.5 8.8<br />
Black 96.3 79.4 54.3 80.3 72.3 17.7 29.6 40.6 28.9<br />
Hispanic 95.0 68.5 46.8 75.7 56.3 10.9 22.3 30.7 18.4<br />
Asian 98.3 67.1 31.4 61.7 71.7 6.6 22.8 20.2 20.2<br />
Native Hawaiian/<br />
Pacific Isl<strong>and</strong>er ‡ ‡ ‡ ‡ ‡ ‡ ‡ ‡ ‡<br />
American Indian/<br />
Alaska Native 95.8 65.5 32.2 70.5 62.0 ‡ 14.9 ! 16.2 ! 16.7 !<br />
Two or more races 93.9 70.8 49.5 68.0 59.3 10.7 29.8 22.9 19.9<br />
! Interpret data with caution. The coefficient of variation (CV) for this estimate is 30 percent or greater.<br />
‡ Report<strong>in</strong>g st<strong>and</strong>ards not met. Either there are too few cases or the coefficient of variation (CV) is 50 percent or greater.<br />
NOTE: Estimates for percentage of students who planned to cont<strong>in</strong>ue their education after high school were weighted by F1PNLWT, <strong>and</strong> the rema<strong>in</strong><strong>in</strong>g estimates were weighted by F1QWT. Race categories exclude<br />
persons of Hispanic ethnicity.<br />
SOURCE: U.S. Department of <strong>Education</strong>, National Center for <strong>Education</strong> Statistics, <strong>Education</strong> Longitud<strong>in</strong>al <strong>Study</strong> of 2002 (ELS:2002/2004), “Base Year, 2002” <strong>and</strong> “First Follow-up, 2004.”<br />
5<br />
College Knowledge<br />
30
Indicator 31<br />
F<strong>in</strong>ancial Aid Considerations<br />
Among 2004 high school seniors, there were differences by race/ethnicity <strong>and</strong><br />
sex <strong>in</strong> the percentages of students who had applied for college admission <strong>and</strong><br />
f<strong>in</strong>ancial aid by 2006. A higher percentage of females than males had applied<br />
to college (87 vs. 79 percent), <strong>and</strong> a higher percentage of Black college<br />
applicants had applied for f<strong>in</strong>ancial aid than Whites, Hispanics, <strong>and</strong> those of two<br />
or more races.<br />
By 2006, some 83 percent of students who were high<br />
school seniors <strong>in</strong> 2004 had applied to college. A lower<br />
percentage of males applied to college than females<br />
(79 vs. 87 percent)—a pattern that held for Whites<br />
(81 vs. 88 percent), Blacks (77 vs. 85 percent), <strong>and</strong><br />
Hispanics (73 vs. 82 percent). Racial/ethnic differences<br />
were also found overall. For example, a lower percentage<br />
of Blacks (81 percent) <strong>and</strong> Hispanics (78 percent) had<br />
applied to college by 2006 than Whites (85 percent),<br />
Asians (91 percent), <strong>and</strong> Native Hawaiians/Pacific<br />
Isl<strong>and</strong>ers (91 percent).<br />
Among these college applicants, 73 percent had also<br />
applied for f<strong>in</strong>ancial aid by 2006, with a lower percentage<br />
of male than female aid applicants (69 vs. 76 percent).<br />
Similarly, there was a lower percentage of male than<br />
female aid applicants among Whites (68 vs. 76 percent),<br />
Blacks (77 vs. 84 percent), Asians (72 vs. 80 percent),<br />
<strong>and</strong> American Indians/Alaska Natives (46 vs. 83 percent).<br />
No measurable differences were found between Hispanic<br />
males <strong>and</strong> females or between males <strong>and</strong> females of two<br />
or more races. Overall racial/ethnic group differences were<br />
also found. For example, a higher percentage of Blacks<br />
(81 percent) applied for aid than did Whites (72 percent),<br />
Hispanics (70 percent), or those of two or more races<br />
(72 percent).<br />
College applicants who did not apply for f<strong>in</strong>ancial<br />
aid cited various reasons for not do<strong>in</strong>g so, <strong>in</strong>clud<strong>in</strong>g<br />
the ability to pay for education without f<strong>in</strong>ancial aid<br />
(55 percent), the perception that they would not qualify<br />
for aid (40 percent), be<strong>in</strong>g offered aid without apply<strong>in</strong>g<br />
(11 percent), the difficulty of the aid application process<br />
(10 percent), an <strong>in</strong>ability to repay loans (9 percent), a<br />
desire not to report f<strong>in</strong>ancial <strong>in</strong>formation (5 percent), <strong>and</strong><br />
other reasons (24 percent).<br />
Among male <strong>and</strong> female college applicants who did not<br />
apply for f<strong>in</strong>ancial aid, no measurable difference was<br />
found between the percentages of males <strong>and</strong> females<br />
who reported not apply<strong>in</strong>g for aid because of an <strong>in</strong>ability<br />
to repay loans. While similar percentages were also<br />
observed for males <strong>and</strong> females of various racial/ethnic<br />
groups, overall differences by race/ethnicity were found.<br />
Figure 31-1.<br />
Percentage of 2004 high school seniors who had applied to college by 2006, by race/ethnicity <strong>and</strong> sex:<br />
2006<br />
Percent<br />
100<br />
80<br />
79<br />
87<br />
81<br />
88<br />
77<br />
85<br />
73<br />
82<br />
89<br />
94<br />
67<br />
84<br />
83<br />
84<br />
60<br />
40<br />
20<br />
0<br />
Total 1 White Black Hispanic Asian American Indian/<br />
Alaska Native<br />
Race/ethnicity<br />
Two or<br />
more races<br />
Male<br />
Female<br />
1<br />
Total <strong>in</strong>cludes other racial/ethnic groups not shown separately <strong>in</strong> the figure.<br />
NOTE: Estimates were weighted by F2F1WT. Report<strong>in</strong>g st<strong>and</strong>ards for Native Hawaiians/Pacific Isl<strong>and</strong>ers were not met; therefore, data for this group are not<br />
shown <strong>in</strong> the figure. Race categories exclude persons of Hispanic ethnicity.<br />
SOURCE: U.S. Department of <strong>Education</strong>, National Center for <strong>Education</strong> Statistics, <strong>Education</strong> Longitud<strong>in</strong>al <strong>Study</strong> of 2002 (ELS:2002/2006), “Base-year (2002) to<br />
Second Follow-up (2006).”<br />
154 <strong>Higher</strong> <strong>Education</strong>: <strong>Gaps</strong> <strong>in</strong> <strong>Access</strong> <strong>and</strong> <strong>Persistence</strong> <strong>Study</strong>
Figure 31-2.<br />
Percent<br />
Among 2004 high school seniors who had applied to college by 2006, percentage who applied for<br />
f<strong>in</strong>ancial aid, by race/ethnicity <strong>and</strong> sex: 2006<br />
31<br />
100<br />
80<br />
60<br />
40<br />
20<br />
0<br />
69<br />
76<br />
68<br />
76 77<br />
84<br />
Total 1 White Black Hispanic Asian American Indian/<br />
Alaska Native<br />
67<br />
Race/ethnicity<br />
Male<br />
72 72<br />
Female<br />
80<br />
46<br />
83<br />
69<br />
74<br />
Two or<br />
more races<br />
College Knowledge<br />
5<br />
1<br />
Total <strong>in</strong>cludes other racial/ethnic groups not shown separately <strong>in</strong> the figure.<br />
NOTE: Estimates were weighted by F2F1WT. Report<strong>in</strong>g st<strong>and</strong>ards for Native Hawaiians/Pacific Isl<strong>and</strong>ers were not met; therefore, data for this group are not<br />
shown <strong>in</strong> the figure. Race categories exclude persons of Hispanic ethnicity.<br />
SOURCE: U.S. Department of <strong>Education</strong>, National Center for <strong>Education</strong> Statistics, <strong>Education</strong> Longitud<strong>in</strong>al <strong>Study</strong> of 2002 (ELS:2002/2006), “Base-year (2002) to<br />
Second Follow-up (2006).”<br />
For example, the percentage of White college applicants<br />
cit<strong>in</strong>g an <strong>in</strong>ability to repay loans as a reason for not<br />
apply<strong>in</strong>g for aid was lower than the percentages of Blacks<br />
<strong>and</strong> Hispanics cit<strong>in</strong>g this reason (6 percent vs. 18 <strong>and</strong><br />
19 percent). In addition, compared with Blacks, higher<br />
percentages of Whites <strong>and</strong> Asians did not apply for<br />
f<strong>in</strong>ancial aid because they thought they would not qualify<br />
for aid <strong>and</strong> because they did not need aid to pay for their<br />
college education.<br />
College Knowledge 155
Table 31-1. Among 2004 high school seniors who had applied to college by 2006, percentage who applied for<br />
f<strong>in</strong>ancial aid, <strong>and</strong> among those who did not apply, percentage who reported various reasons for not<br />
do<strong>in</strong>g so, by sex <strong>and</strong> race/ethnicity: 2006<br />
Reasons for not apply<strong>in</strong>g for f<strong>in</strong>ancial aid<br />
Sex <strong>and</strong> race/ethnicity<br />
Among high<br />
school seniors,<br />
the percent<br />
who applied<br />
to college<br />
by 2006<br />
Among college<br />
applicants,<br />
the percent<br />
who applied<br />
for f<strong>in</strong>ancial<br />
aid by 2006<br />
I or my family<br />
were able<br />
to pay for<br />
education<br />
without<br />
f<strong>in</strong>ancial aid<br />
I or my family<br />
thought that<br />
I would not<br />
qualify for aid<br />
I was offered<br />
aid without<br />
apply<strong>in</strong>g<br />
Total 83.3 72.8 55.3 40.5 11.5<br />
Sex<br />
Male 79.5 68.6 57.3 36.6 12.7<br />
Female 86.9 76.5 52.9 45.1 10.1<br />
Race/ethnicity<br />
White 84.6 71.9 62.7 42.1 10.4<br />
Black 81.2 80.6 37.3 31.0 17.2<br />
Hispanic 77.5 69.8 35.8 39.8 11.8<br />
Asian 91.0 75.8 58.8 49.6 10.7<br />
Native Hawaiian/Pacific Isl<strong>and</strong>er 90.9 57.3 ‡ ‡ ‡<br />
American Indian/Alaska Native 75.2 65.4 ‡ ‡ ‡<br />
Two or more races 83.7 71.7 51.4 32.1 11.0 !<br />
Race/ethnicity by sex<br />
Male<br />
White 80.7 67.6 64.9 38.1 10.7<br />
Black 77.4 76.6 39.5 35.2 24.7<br />
Hispanic 72.9 66.7 38.0 31.1 13.8<br />
Asian 88.7 71.8 59.7 47.9 12.3 !<br />
Native Hawaiian/Pacific Isl<strong>and</strong>er ‡ ‡ ‡ ‡ ‡<br />
American Indian/Alaska Native 67.4 46.1 ‡ ‡ ‡<br />
Two or more races 83.4 69.0 48.4 24.8 ! ‡<br />
Female<br />
White 88.4 75.7 60.2 46.8 10.1<br />
Black 84.6 83.9 34.8 26.1 8.3 !<br />
Hispanic 81.8 72.3 33.5 48.5 9.7<br />
Asian 93.5 79.7 57.5 52.0 8.4 !<br />
Native Hawaiian/Pacific Isl<strong>and</strong>er ‡ ‡ ‡ ‡ ‡<br />
American Indian/Alaska Native 84.0 82.8 ‡ ‡ ‡<br />
Two or more races 84.0 74.3 54.8 40.5 13.5 !<br />
See notes at end of table.<br />
156 <strong>Higher</strong> <strong>Education</strong>: <strong>Gaps</strong> <strong>in</strong> <strong>Access</strong> <strong>and</strong> <strong>Persistence</strong> <strong>Study</strong>
Table 31-1. Among 2004 high school seniors who had applied to college by 2006, percentage who applied for<br />
f<strong>in</strong>ancial aid, <strong>and</strong> among those who did not apply, percentage who reported various reasons for not<br />
do<strong>in</strong>g so, by sex <strong>and</strong> race/ethnicity: 2006—Cont<strong>in</strong>ued<br />
Reasons for not apply<strong>in</strong>g for f<strong>in</strong>ancial aid<br />
Sex <strong>and</strong> race/ethnicity<br />
The aid<br />
application<br />
process was<br />
too difficult<br />
I or my family<br />
could not afford<br />
to pay back a loan<br />
I or my family<br />
did not want to<br />
report f<strong>in</strong>ancial<br />
<strong>in</strong>formation<br />
Other<br />
reason<br />
Total 10.3 9.0 4.8 24.4<br />
Sex<br />
Male 10.7 8.2 4.4 25.4<br />
Female 9.8 9.9 5.3 23.1<br />
Race/ethnicity<br />
White 9.1 5.6 4.1 20.6<br />
Black 10.5 17.5 4.9 ! 34.0<br />
Hispanic 14.0 18.7 7.1 34.2<br />
Asian 14.8 5.7 9.6 23.1<br />
Native Hawaiian/Pacific Isl<strong>and</strong>er ‡ ‡ ‡ ‡<br />
American Indian/Alaska Native ‡ ‡ ‡ ‡<br />
Two or more races 12.0 ! 9.3 ! ‡ 27.9<br />
Race/ethnicity by sex<br />
Male<br />
White 9.5 5.3 4.0 21.7<br />
Black 9.9 ! 17.3 4.5 ! 32.5<br />
Hispanic 16.2 16.2 3.9 ! 36.1<br />
Asian 13.8 7.1 ! 12.1 26.1<br />
Native Hawaiian/Pacific Isl<strong>and</strong>er ‡ ‡ ‡ ‡<br />
American Indian/Alaska Native ‡ ‡ ‡ ‡<br />
Two or more races 10.5 ! ‡ ‡ 32.4<br />
31<br />
College Knowledge<br />
5<br />
Female<br />
White 8.6 6.0 4.2 19.3<br />
Black 11.2 ! 17.8 ‡ 35.7<br />
Hispanic 11.7 21.1 10.2 32.2<br />
Asian 16.2 ‡ 6.2 ! 19.0<br />
Native Hawaiian/Pacific Isl<strong>and</strong>er ‡ ‡ ‡ ‡<br />
American Indian/Alaska Native ‡ ‡ ‡ ‡<br />
Two or more races ‡ 13.6 ! ‡ 22.6 !<br />
! Interpret data with caution. The coefficient of variation (CV) for this estimate is 30 percent or greater.<br />
‡ Report<strong>in</strong>g st<strong>and</strong>ards not met. Either there are too few cases or the coefficient of variation (CV) is 50 percent or greater.<br />
NOTE: Estimates were weighted by F2F1WT. Race categories exclude persons of Hispanic ethnicity.<br />
SOURCE: U.S. Department of <strong>Education</strong>, National Center for <strong>Education</strong> Statistics, <strong>Education</strong> Longitud<strong>in</strong>al <strong>Study</strong> of 2002 (ELS:2002/2006), “Base-year<br />
(2002) to Second Follow-up (2006).”<br />
College Knowledge 157
Indicator 32<br />
Participation <strong>in</strong> College Preparatory <strong>and</strong> Awareness<br />
Programs<br />
In 2004, among high school seniors with postsecondary aspirations, there<br />
was no significant difference <strong>in</strong> participation between males <strong>and</strong> females <strong>in</strong><br />
college preparatory <strong>and</strong> awareness programs, a f<strong>in</strong>d<strong>in</strong>g which held for all racial/<br />
ethnic groups.<br />
A number of college preparatory <strong>and</strong> awareness programs<br />
exist throughout the country to provide <strong>in</strong>formation to<br />
secondary school students about postsecondary education<br />
opportunities. Activities <strong>and</strong> services that these programs<br />
provide can <strong>in</strong>clude career exploration <strong>and</strong> aptitude<br />
assessment, exposure to college campuses, <strong>in</strong>formation<br />
on student f<strong>in</strong>ancial assistance, assistance <strong>in</strong> complet<strong>in</strong>g<br />
college admissions <strong>and</strong> f<strong>in</strong>ancial aid applications,<br />
assistance <strong>in</strong> prepar<strong>in</strong>g for college entrance exams, <strong>and</strong><br />
mentor<strong>in</strong>g programs.<br />
In 2004, some 23 percent of seniors with postsecondary<br />
aspirations reported participat<strong>in</strong>g <strong>in</strong> programs to help<br />
prepare for college. Overall, there were no significant<br />
differences between the percentages for males <strong>and</strong> females<br />
(23 percent each), a pattern which held for all racial/<br />
ethnic groups.<br />
However, a higher percentage of Black students (34<br />
percent) reported participat<strong>in</strong>g <strong>in</strong> these programs than<br />
did White (20 percent), Hispanic (25 percent), <strong>and</strong> Asian<br />
students (25 percent), with the same pattern found among<br />
male <strong>and</strong> female students. Additionally, among female<br />
students, a lower percentage of Whites participated than<br />
did Asians <strong>and</strong> those of two or more races (20 vs. 26 <strong>and</strong><br />
31 percent, respectively).<br />
Figure 32-1.<br />
Among high school seniors with postsecondary aspirations, the percentage who reported participat<strong>in</strong>g <strong>in</strong><br />
college preparatory <strong>and</strong> awareness programs, by race/ethnicity <strong>and</strong> sex: 2004<br />
Percent<br />
100<br />
80<br />
60<br />
40<br />
20<br />
23 23<br />
21 20<br />
33<br />
35<br />
25 24 24<br />
26<br />
20!<br />
37<br />
31 31<br />
0<br />
Total 1 White Black Hispanic Asian American Indian/<br />
Alaska Native<br />
Race/ethnicity<br />
Two or<br />
more races<br />
Male<br />
Female<br />
! Interpret data with caution. The coefficient of variation (CV) for this estimate exceeds 30 percent.<br />
1<br />
Total <strong>in</strong>cludes other racial/ethnic groups not shown separately <strong>in</strong> the figure.<br />
NOTE: Estimates were weighted by F1QWT. Report<strong>in</strong>g st<strong>and</strong>ards for Native Hawaiians/Pacific Isl<strong>and</strong>ers were not met; therefore, data for this group are not<br />
shown <strong>in</strong> the figure. Race categories exclude persons of Hispanic ethnicity.<br />
SOURCE: U.S. Department of <strong>Education</strong>, National Center for <strong>Education</strong> Statistics, <strong>Education</strong> Longitud<strong>in</strong>al <strong>Study</strong> of 2002 (ELS:2002/2004), “First Follow-up, 2004.”<br />
158 <strong>Higher</strong> <strong>Education</strong>: <strong>Gaps</strong> <strong>in</strong> <strong>Access</strong> <strong>and</strong> <strong>Persistence</strong> <strong>Study</strong>
Table 32-1.<br />
Among high school seniors with postsecondary aspirations, the percentage who reported participat<strong>in</strong>g <strong>in</strong><br />
college preparatory <strong>and</strong> awareness programs, by race/ethnicity <strong>and</strong> sex: 2004<br />
Sex Total White Black Hispanic Asian<br />
Sex<br />
Native<br />
Hawaiian/<br />
Pacific<br />
Isl<strong>and</strong>er<br />
American<br />
Indian/<br />
Alaska<br />
Native<br />
Total 23.4 20.4 34.0 24.7 25.3 29.8 ! 27.5 30.6<br />
Male 23.5 20.9 32.8 25.1 24.3 ‡ 19.7 ! 30.6<br />
Two or<br />
more<br />
races<br />
Female 23.3 19.8 35.2 24.3 26.3 ‡ 36.7 30.6<br />
! Interpret data with caution. The coefficient of variation (CV) for this estimate is 30 percent or greater.<br />
‡ Report<strong>in</strong>g st<strong>and</strong>ards not met (too few cases).<br />
NOTE: Estimates were weighted by F1QWT. Race categories exclude persons of Hispanic ethnicity.<br />
SOURCE: U.S. Department of <strong>Education</strong>, National Center for <strong>Education</strong> Statistics, <strong>Education</strong> Longitud<strong>in</strong>al <strong>Study</strong> of 2002 (ELS:2002/2004), “First Follow-up,<br />
2004.”<br />
32<br />
College Knowledge<br />
5<br />
College Knowledge 159
Chapter 6<br />
Postsecondary <strong>Education</strong><br />
33. Enrollment Rates for 18- to 24-Year-Olds.............................................................................. 162<br />
34 Entry Into Postsecondary <strong>Education</strong>................................................................................... 170<br />
35. Price of Attendance <strong>and</strong> F<strong>in</strong>ancial Aid............................................................................... 176<br />
36. Enrollment Intensity............................................................................................................... 180<br />
37. <strong>Persistence</strong> <strong>and</strong> Atta<strong>in</strong>ment................................................................................................. 184<br />
38. Reasons for Leav<strong>in</strong>g............................................................................................................. 188<br />
39. Remedial Coursework <strong>and</strong> Other Academic Experiences................................................ 192<br />
40. Academic <strong>and</strong> Social Integration....................................................................................... 196<br />
41. College Student Employment.............................................................................................. 202<br />
42. Graduation Rates <strong>and</strong> Degrees Conferred......................................................................... 206<br />
160 <strong>Higher</strong> <strong>Education</strong>: <strong>Gaps</strong> <strong>in</strong> <strong>Access</strong> <strong>and</strong> <strong>Persistence</strong> <strong>Study</strong>
Chapter 6 <strong>in</strong>vestigates male <strong>and</strong> female differences (across <strong>and</strong> with<strong>in</strong> racial/ethnic groups) on a variety of<br />
postsecondary enrollment, persistence, <strong>and</strong> atta<strong>in</strong>ment <strong>in</strong>dicators. These measures <strong>in</strong>clude pathways to postsecondary<br />
education, price of attendance <strong>and</strong> f<strong>in</strong>ancial aid, enrollment <strong>in</strong>tensity, reasons for leav<strong>in</strong>g without complet<strong>in</strong>g a degree<br />
or certificate program, remedial coursetak<strong>in</strong>g, academic <strong>and</strong> social <strong>in</strong>tegration, <strong>and</strong> college student employment.<br />
Lower rates of persistence <strong>and</strong> atta<strong>in</strong>ment have been associated with a number of precollegiate <strong>and</strong> collegiate factors<br />
(NCES 2008). For example, Pascarella <strong>and</strong> Terenz<strong>in</strong>i (2005) discuss a consistent f<strong>in</strong>d<strong>in</strong>g <strong>in</strong> the literature that delayed<br />
entry <strong>in</strong>to postsecondary education after high school is associated with lower likelihoods of college persistence <strong>and</strong><br />
degree atta<strong>in</strong>ment. Another study by NCES lists delayed entry as one of the seven major risk factors for college<br />
persistence <strong>and</strong> atta<strong>in</strong>ment (Berkner, Cuccaro-Alam<strong>in</strong>, <strong>and</strong> McCormick 1996). Other factors associated with<br />
lower student persistence <strong>in</strong>clude weak academic preparation for college, part-time enrollment <strong>and</strong> <strong>in</strong>terruptions <strong>in</strong><br />
enrollment cont<strong>in</strong>uity, low levels of <strong>in</strong>teraction with faculty <strong>and</strong> little participation <strong>in</strong> school activities, work<strong>in</strong>g more<br />
than 15 hours a week while enrolled, <strong>and</strong> beg<strong>in</strong>n<strong>in</strong>g at a 2-year community college <strong>in</strong>stead of a 4-year <strong>in</strong>stitution.<br />
Studies that show some of these associations <strong>in</strong>clude Whitaker <strong>and</strong> Pascarella (1994), which exam<strong>in</strong>ed degree<br />
atta<strong>in</strong>ment 14 years after graduat<strong>in</strong>g from high school. They found that first attend<strong>in</strong>g a 2-year postsecondary<br />
<strong>in</strong>stitution was negatively associated with degree atta<strong>in</strong>ment, after controll<strong>in</strong>g for precollege differences <strong>in</strong> student<br />
background characteristics (e.g., gender, race/ethnicity, age, socioeconomic status, high school achievement, <strong>and</strong><br />
<strong>in</strong>volvement <strong>in</strong> extracurricular activities). Studies on stopp<strong>in</strong>g out (temporarily <strong>in</strong>terrupt<strong>in</strong>g enrollment) have shown<br />
students with <strong>in</strong>terruptions <strong>in</strong> enrollment <strong>in</strong>tensity take longer to complete a degree program <strong>and</strong> that stopp<strong>in</strong>g out is<br />
associated with a reduced likelihood of degree completion (G<strong>and</strong>erton <strong>and</strong> Santos 1995; Horn 1998; also see Pascarella<br />
<strong>and</strong> Terenz<strong>in</strong>i 2005 for a comprehensive review of the research on positive <strong>and</strong> negative associations between student<br />
characteristics <strong>and</strong> college persistence <strong>and</strong> atta<strong>in</strong>ment).<br />
Other factors that have been associated with postsecondary persistence <strong>and</strong> degree atta<strong>in</strong>ment <strong>in</strong>clude price of<br />
attendance, f<strong>in</strong>ancial aid, <strong>and</strong> remedial coursetak<strong>in</strong>g. For example, Wei <strong>and</strong> Horn (2009) showed that be<strong>in</strong>g a Pell<br />
Grant 5 recipient was associated with a shorter time to degree than be<strong>in</strong>g a nonrecipient, after controll<strong>in</strong>g for several<br />
related variables simultaneously (e.g., parent’s education, undergraduate risk characteristics, <strong>and</strong> type of <strong>in</strong>stitution).<br />
Regard<strong>in</strong>g remedial coursework, f<strong>in</strong>d<strong>in</strong>gs have been mixed. For example, studies exam<strong>in</strong><strong>in</strong>g the experiences of a<br />
national cohort of 12th-graders as they transitioned to postsecondary <strong>in</strong>stitutions <strong>in</strong> 1992 found that tak<strong>in</strong>g remedial<br />
courses was related to lower likelihoods of earn<strong>in</strong>g a postsecondary degree or complet<strong>in</strong>g a certificate program<br />
(NCES 2003; Adelman 2004). However, other studies show that remediation programs may help <strong>in</strong>crease the<br />
likelihood of persistence over the long term (2 to 6 years) <strong>and</strong> degree atta<strong>in</strong>ment as well (Braley <strong>and</strong> Ogden 1997;<br />
Weissman et al. 1997).<br />
5<br />
The Pell Grant program is the largest federal need-based grant program available to undergraduate students. In order to qualify for a Pell Grant, a<br />
student must demonstrate f<strong>in</strong>ancial need.<br />
Postsecondary <strong>Education</strong> 161
Indicator 33<br />
Enrollment Rates for 18- to 24-Year-Olds<br />
In 2010, a lower percentage of 18- to 24-year-old males than females were<br />
enrolled <strong>in</strong> college or graduate school (39 vs. 47 percent). A higher percentage<br />
of 18- to 24-year-old males than females were still enrolled <strong>in</strong> high school <strong>in</strong><br />
2010 (10 vs. 8 percent).<br />
In 2010, some 9 percent of 18- to 24-year-olds were<br />
still enrolled <strong>in</strong> high school, 43 percent were enrolled <strong>in</strong><br />
college or graduate school, <strong>and</strong> another 7 percent had<br />
completed an associate’s, bachelor’s, or higher degree<br />
<strong>and</strong> were no longer enrolled. In the same year, about 10<br />
percent of 18- to 24-year-olds were not currently enrolled<br />
<strong>in</strong> school <strong>and</strong> had not earned a high school credential<br />
(either a diploma or an equivalency credential such as a<br />
General <strong>Education</strong>al Development [GED] certificate).<br />
A higher percentage of male than female 18- to 24-yearolds<br />
were still enrolled <strong>in</strong> high school <strong>in</strong> 2010 (10 vs.<br />
8 percent). This pattern was also observed for Whites<br />
(9 vs. 7 percent), Blacks (13 vs. 10 percent), Asians (7<br />
vs. 6 percent), Native Hawaiians/Pacific Isl<strong>and</strong>ers (10<br />
vs. 4 percent), <strong>and</strong> persons of two or more races (12<br />
vs. 9 percent). Overall, higher percentages of Black (12<br />
percent), American Indian (10 percent), <strong>and</strong> Hispanic (10<br />
percent) young adults <strong>and</strong> young adults of two or more<br />
races (11 percent) were still enrolled <strong>in</strong> high school than<br />
Whites (8 percent) or Asians (7 percent). The percentage<br />
of Blacks still enrolled <strong>in</strong> high school was also higher<br />
than the percentages of Hispanics <strong>and</strong> Native Hawaiians/<br />
Pacific Isl<strong>and</strong>ers (both 7 percent).<br />
In 2010, a higher percentage of male than female 18- to<br />
24-year-olds were not enrolled <strong>in</strong> school <strong>and</strong> had not<br />
completed high school (12 vs. 8 percent). This pattern<br />
was also found for Whites (7 vs. 5 percent), Blacks (15<br />
vs. 9 percent), Hispanics (24 vs. 16 percent), Asians (4<br />
vs. 3 percent), American Indians (21 vs. 15 percent), <strong>and</strong><br />
persons of two or more races (9 vs. 6 percent). Differences<br />
<strong>in</strong> high school completion were also found across racial/<br />
ethnic groups. <strong>Higher</strong> percentages of Hispanics (20<br />
percent), American Indians (18 percent), Alaska Natives<br />
(16 percent), <strong>and</strong> Blacks (12 percent) were not currently<br />
enrolled <strong>in</strong> school <strong>and</strong> had not completed high school<br />
compared to persons of two or more races (7 percent),<br />
Native Hawaiians/Pacific Isl<strong>and</strong>ers (6 percent), Whites<br />
(6 percent), <strong>and</strong> Asians (3 percent). The percentage of<br />
Hispanics who had not completed high school was also<br />
higher than the percentages of Blacks <strong>and</strong> American<br />
Indians.<br />
In 2010, a lower percentage of male than female 18- to<br />
24-year-olds were enrolled <strong>in</strong> either college or graduate<br />
school (39 vs. 47 percent). This pattern was also observed<br />
for Whites (43 vs. 51 percent), Blacks (31 vs. 43 percent),<br />
Hispanics (26 vs. 36 percent), American Indians (24 vs.<br />
33 percent), <strong>and</strong> persons of two or more races (40 vs. 49<br />
percent). The percentage of 18- to 24-year-olds enrolled<br />
<strong>in</strong> college or graduate school differed across racial/ethnic<br />
groups. A higher percentage of Asians (66 percent) than<br />
all other racial/ethnic groups were enrolled <strong>in</strong> college or<br />
graduate school. Whites had higher college or graduate<br />
school enrollment rates (47 percent) than persons of<br />
two or more races (45 percent), <strong>and</strong> both of these racial/<br />
ethnic groups had higher enrollment rates than Native<br />
Hawaiians/Pacific Isl<strong>and</strong>ers (39 percent), Blacks (37<br />
percent), Hispanics (31 percent), American Indians (28<br />
percent), <strong>and</strong> Alaska Natives (19 percent). College or<br />
graduate school enrollment rates were higher for Blacks<br />
than for Hispanics; <strong>in</strong> addition, Blacks, Hispanics, <strong>and</strong><br />
Native Hawaiians/Pacific Isl<strong>and</strong>ers had higher college or<br />
graduate school enrollment rates than American Indians<br />
<strong>and</strong> Alaska Natives.<br />
Hispanics born outside of the United States may not<br />
have had access to the same educational opportunities<br />
as Hispanics born with<strong>in</strong> the United States. Therefore,<br />
exam<strong>in</strong><strong>in</strong>g high school completion <strong>and</strong> college or graduate<br />
school enrollment rates by nativity helps highlight the<br />
experiences of young adults who may not have attended<br />
primary or secondary school <strong>in</strong> the United States. In<br />
2010, over one-third of Hispanics born outside of the<br />
United States (36 percent) had not completed high school<br />
<strong>and</strong> were not currently enrolled compared to 13 percent<br />
of Hispanics born with<strong>in</strong> the United States. In addition,<br />
a lower percentage of Hispanics born outside the United<br />
States were enrolled <strong>in</strong> college or graduate school than<br />
162 <strong>Higher</strong> <strong>Education</strong>: <strong>Gaps</strong> <strong>in</strong> <strong>Access</strong> <strong>and</strong> <strong>Persistence</strong> <strong>Study</strong>
Figure 33-1.<br />
Percentage distribution of 18- to 24-year-olds <strong>in</strong> the household <strong>and</strong> group quarters population, by race/<br />
ethnicity, sex, <strong>and</strong> school enrollment status: 2010<br />
33<br />
Race/ethnicity<br />
Total 1<br />
Male<br />
12 10 34 39<br />
2 4<br />
Female<br />
8 8 29 47<br />
2 6<br />
White<br />
Male<br />
Female<br />
7 9 34 43<br />
5 7 26 51<br />
2 6<br />
2 8<br />
Black<br />
Male<br />
Female<br />
15 13 38 31<br />
9 10 34 43<br />
12<br />
1 3<br />
Hispanic<br />
Male<br />
Female<br />
24 10 36 26<br />
16 10 34 36<br />
12<br />
2 3<br />
Asian<br />
Male<br />
4 7 15 65 1 8<br />
American<br />
Indian<br />
Alaska<br />
Native 2<br />
Two or<br />
more<br />
races<br />
Female<br />
Male<br />
Female<br />
Male<br />
Female<br />
Male<br />
Female<br />
3 6 13 67 1 10<br />
1! 1!<br />
21 11 43 24<br />
1! 1!<br />
15 10 40 33<br />
19 11 53 17<br />
13 8! 57 21<br />
9 12 34 40<br />
1 4<br />
6 9 29 49<br />
2 5<br />
0 20 40 60 80 100<br />
Percent<br />
Less than high school completion, not enrolled<br />
Enrolled <strong>in</strong> high school<br />
Enrolled <strong>in</strong> college or graduate school<br />
Associate’s degree, not enrolled<br />
Postsecondary <strong>Education</strong><br />
High school completion, not enrolled 3<br />
Bachelor’s degree or higher, not enrolled<br />
! Interpret data with caution. The coefficient of variation (CV) for this estimate is 30 percent or greater.<br />
1<br />
Total <strong>in</strong>cludes other racial/ethnic groups not shown separately <strong>in</strong> the figure.<br />
2<br />
The percentages of Alaska Natives with associate’s degrees <strong>and</strong> bachelor’s degrees or higher round to zero.<br />
3<br />
Includes equivalent credential, <strong>in</strong>clud<strong>in</strong>g a General <strong>Education</strong>al Development (GED) certificate. Young adults who reported complet<strong>in</strong>g some college but<br />
no degree are <strong>in</strong>cluded <strong>in</strong> this category.<br />
NOTE: Report<strong>in</strong>g st<strong>and</strong>ards for the percentage of Native Hawaiian/Pacific Isl<strong>and</strong>er males with a bachelor’s degree or higher were not met; therefore, data<br />
for Native Hawaiians/Pacific Isl<strong>and</strong>ers are not shown <strong>in</strong> the figure. Detail may not sum to totals because of round<strong>in</strong>g. Race categories exclude persons of<br />
Hispanic ethnicity.<br />
SOURCE: U.S. Department of Commerce, Census Bureau, American Community Survey, 2010.<br />
6<br />
Hispanics born with<strong>in</strong> the United States (17 vs. 37<br />
percent).<br />
A higher percentage of 18- to 24-year-olds were enrolled<br />
either <strong>in</strong> college or graduate school <strong>in</strong> 2010 than <strong>in</strong><br />
2006 (43 vs. 40 percent). This f<strong>in</strong>d<strong>in</strong>g was also true for<br />
males (39 vs. 36 percent) <strong>and</strong> females (47 vs. 44 percent).<br />
The percentage of those enrolled <strong>in</strong> either college or<br />
graduate school were higher <strong>in</strong> 2010 than <strong>in</strong> 2006 for<br />
Asians (66 vs. 62 percent), Whites (47 vs. 44 percent),<br />
Native Hawaiians/Pacific Isl<strong>and</strong>ers (39 vs. 31 percent),<br />
Blacks (37 vs. 32 percent), Hispanics (31 vs. 25 percent),<br />
<strong>and</strong> American Indians (28 vs. 24 percent). Asian, White,<br />
Native Hawaiian/Pacific Isl<strong>and</strong>er, Black, <strong>and</strong> Hispanic<br />
males <strong>and</strong> Asian, White, Black, Hispanic, <strong>and</strong> American<br />
Indian females also had higher college or graduate school<br />
enrollment rates <strong>in</strong> 2010 than <strong>in</strong> 2006.<br />
Postsecondary <strong>Education</strong> 163
Technical Notes<br />
Born with<strong>in</strong> the United States refers to the 50 states,<br />
the District of Columbia, Puerto Rico, Guam, the U.S.<br />
Virg<strong>in</strong> Isl<strong>and</strong>s, the Northern Marianas, <strong>and</strong> those born<br />
abroad of American parents. The American Community<br />
Survey <strong>in</strong>cludes non<strong>in</strong>stitutionalized <strong>and</strong> <strong>in</strong>stitutionalized<br />
group quarters. Non<strong>in</strong>stitutionalized group quarters<br />
<strong>in</strong>clude college <strong>and</strong> university hous<strong>in</strong>g, military quarters,<br />
facilities for workers <strong>and</strong> religious groups, <strong>and</strong> temporary<br />
shelters for the homeless. Institutionalized group quarters<br />
<strong>in</strong>clude adult <strong>and</strong> juvenile correctional facilities, nurs<strong>in</strong>g<br />
facilities, <strong>and</strong> other health care facilities.<br />
Figure 33-2.<br />
Percentage of 18- to 24-year-olds <strong>in</strong> the household <strong>and</strong> group quarters population enrolled <strong>in</strong> college or<br />
graduate school, by race/ethnicity <strong>and</strong> sex: 2010<br />
Percent<br />
100<br />
80<br />
65 67<br />
60<br />
40<br />
20<br />
39<br />
47<br />
43<br />
51<br />
31<br />
43<br />
26<br />
36<br />
35<br />
43<br />
24<br />
33<br />
17<br />
21<br />
40<br />
49<br />
0<br />
Total 1 White Black Hispanic Asian Native<br />
Hawaiian/<br />
Pacific Isl<strong>and</strong>er<br />
American<br />
Indian<br />
Alaska<br />
Native<br />
Two or more<br />
races<br />
Race/ethnicity<br />
Male<br />
Female<br />
1<br />
Total <strong>in</strong>cludes other racial/ethnic groups not shown separately <strong>in</strong> the figure.<br />
NOTE: Race categories exclude persons of Hispanic ethnicity.<br />
SOURCE: U.S. Department of Commerce, Census Bureau, American Community Survey, 2010.<br />
164 <strong>Higher</strong> <strong>Education</strong>: <strong>Gaps</strong> <strong>in</strong> <strong>Access</strong> <strong>and</strong> <strong>Persistence</strong> <strong>Study</strong>
33<br />
This page <strong>in</strong>tentionally left blank.<br />
Postsecondary <strong>Education</strong><br />
6<br />
Postsecondary <strong>Education</strong> 165
166 <strong>Higher</strong> <strong>Education</strong>: <strong>Gaps</strong> <strong>in</strong> <strong>Access</strong> <strong>and</strong> <strong>Persistence</strong> <strong>Study</strong><br />
Table 33-1.<br />
Number <strong>and</strong> percentage of 18- to 24-year-olds <strong>in</strong> the household <strong>and</strong> group quarters population, by school enrollment status, sex, race/ethnicity, <strong>and</strong><br />
nativity: 2010<br />
Sex, race/ethnicity, <strong>and</strong> nativity<br />
Sex<br />
Number<br />
Total<br />
Percentage<br />
distribution<br />
Percentage<br />
enrolled<br />
<strong>in</strong> high<br />
school<br />
Percentage<br />
enrolled <strong>in</strong><br />
college or<br />
graduate<br />
school<br />
Percentage<br />
with less<br />
than high<br />
school<br />
completion<br />
Percentage<br />
with high<br />
school<br />
completion<br />
only 1<br />
Not currently enrolled <strong>in</strong> school<br />
Percentage<br />
with some<br />
college<br />
Percentage with an associate’s<br />
degree or higher<br />
Total<br />
Percentage<br />
with an<br />
associate’s<br />
degree<br />
Percentage<br />
with a<br />
bachelor’s<br />
degree or<br />
higher<br />
Total 2 30,871,200 100.0 8.9 42.9 9.8 21.0 10.3 7.1 1.8 5.2<br />
Male 15,797,100 51.2 9.6 38.6 11.8 23.8 10.3 6.0 1.7 4.3<br />
Female 15,074,100 48.8 8.1 47.5 7.7 18.1 10.4 8.3 2.0 6.3<br />
Race/ethnicity<br />
White 17,596,900 57.0 7.8 46.9 6.0 19.6 10.6 9.1 2.3 6.8<br />
Black 4,451,300 14.4 11.7 36.6 12.3 24.4 11.4 3.6 1.2 2.4<br />
Hispanic 6,212,100 20.1 10.0 31.1 20.2 25.3 9.8 3.7 1.4 2.3<br />
Asian 1,497,300 4.9 6.9 66.0 3.1 8.1 6.0 9.9 1.2 8.7<br />
Native Hawaiian/Pacific Isl<strong>and</strong>er 63,600 0.2 7.1 39.1 5.8 32.2 11.4 4.5 2.5 ! 2.1 !<br />
American Indian/Alaska Native 3 251,400 0.8 10.2 28.7 17.2 29.7 11.8 2.5 1.2 1.3<br />
American Indian 200,900 0.7 10.4 28.3 17.6 29.3 11.9 2.5 1.3 1.3<br />
Alaska Native 17,300 0.1 10.1 18.6 16.5 47.2 7.6 ! # # #<br />
Two or more races 731,400 2.4 10.6 44.7 7.4 20.6 11.0 5.7 1.2 4.5<br />
Race/ethnicity by sex<br />
Male<br />
White 8,955,800 56.7 8.6 43.0 7.0 22.9 10.9 7.7 2.2 5.5<br />
Black 2,215,200 14.0 13.2 30.6 15.3 27.4 10.4 3.1 1.0 2.1<br />
Hispanic 3,302,200 20.9 10.3 26.4 24.4 26.9 9.2 2.8 1.1 1.7<br />
Asian 761,200 4.8 7.4 65.3 3.7 8.8 6.0 8.7 1.2 7.5<br />
Native Hawaiian/Pacific Isl<strong>and</strong>er 32,600 0.2 9.6 34.9 5.8 34.1 11.1 4.6 ! 3.2 ! ‡<br />
American Indian/Alaska Native 3 127,700 0.8 10.7 24.5 19.6 32.2 10.6 2.4 1.2 ! 1.2 !<br />
American Indian 99,000 0.6 10.6 23.5 20.7 32.3 10.5 2.4 1.3 ! 1.1 !<br />
Alaska Native 9,500 0.1 11.4 16.6 19.3 47.8 4.9 ! # # #<br />
Two or more races 369,500 2.3 12.0 40.1 8.8 22.6 11.5 5.0 0.9 4.1<br />
See notes at end of table.
Table 33-1.<br />
Number <strong>and</strong> percentage of 18- to 24-year-olds <strong>in</strong> the household <strong>and</strong> group quarters population, by school enrollment status, sex, race/ethnicity, <strong>and</strong><br />
nativity: 2010—Cont<strong>in</strong>ued<br />
Sex, race/ethnicity, <strong>and</strong> nativity<br />
Number<br />
Total<br />
Percentage<br />
distribution<br />
Percentage<br />
enrolled<br />
<strong>in</strong> high<br />
school<br />
Percentage<br />
enrolled <strong>in</strong><br />
college or<br />
graduate<br />
school<br />
Percentage<br />
with less<br />
than high<br />
school<br />
completion<br />
Percentage<br />
with high<br />
school<br />
completion<br />
only 1<br />
Not currently enrolled <strong>in</strong> school<br />
Percentage<br />
with some<br />
college<br />
Percentage with an associate’s<br />
degree or higher<br />
Total<br />
Percentage<br />
with an<br />
associate’s<br />
degree<br />
Percentage<br />
with a<br />
bachelor’s<br />
degree or<br />
higher<br />
Total 2 30,871,200 100.0 8.9 42.9 9.8 21.0 10.3 7.1 1.8 5.2<br />
Race/ethnicity by sex<br />
Female<br />
Nativity<br />
White 8,641,100 57.3 7.1 51.0 5.0 16.2 10.2 10.5 2.4 8.1<br />
Black 2,236,100 14.8 10.1 42.7 9.3 21.4 12.5 4.1 1.3 2.8<br />
Hispanic 2,910,000 19.3 9.7 36.3 15.5 23.4 10.4 4.7 1.7 3.0<br />
Asian 736,000 4.9 6.4 66.7 2.6 7.3 5.9 11.2 1.3 9.8<br />
Native Hawaiian/Pacific Isl<strong>and</strong>er 30,900 0.2 4.5 ! 43.5 5.7 ! 30.3 11.6 4.5 1.7 ! 2.8 !<br />
American Indian/Alaska Native 3 123,800 0.8 9.7 32.9 14.7 27.1 12.9 2.7 1.2 1.5 !<br />
American Indian 101,900 0.7 10.2 32.9 14.6 26.4 13.2 2.6 1.3 1.4 !<br />
Alaska Native 7,800 0.1 8.5 ! 21.0 13.0 46.4 11.0 ! # # #<br />
Two or more races 361,900 2.4 9.2 49.3 5.9 18.6 10.5 6.4 1.6 4.9<br />
Hispanic or Lat<strong>in</strong>o<br />
Born with<strong>in</strong> the United States 4 4,271,500 68.8 11.2 37.5 12.9 23.7 10.8 4.0 1.5 2.5<br />
Born outside of the United States 1,940,600 31.2 7.4 17.0 36.4 28.7 7.6 2.9 1.0 1.9<br />
# Rounds to zero.<br />
! Interpret data with caution. The coefficient of variation (CV) for this estimate is 30 percent or greater.<br />
‡ Report<strong>in</strong>g st<strong>and</strong>ards not met. The coefficient of variation (CV) is 50 percent or greater.<br />
1<br />
Includes equivalent credential, <strong>in</strong>clud<strong>in</strong>g a General <strong>Education</strong>al Development (GED) certificate.<br />
2<br />
Total <strong>in</strong>cludes other racial/ethnic groups not shown separately <strong>in</strong> the table.<br />
3<br />
Includes persons report<strong>in</strong>g American Indian only, Alaska Native only, <strong>and</strong> persons from American Indian <strong>and</strong>/or Alaska Native tribes specified or not specified.<br />
4<br />
Includes the 50 states, District of Columbia, Puerto Rico, Guam, the U.S. Virg<strong>in</strong> Isl<strong>and</strong>s, <strong>and</strong> the Northern Marianas. Also <strong>in</strong>cludes those born abroad of American parents.<br />
NOTE: Race categories exclude persons of Hispanic ethnicity. Detail may not sum to totals because of round<strong>in</strong>g.<br />
SOURCE: U.S. Department of Commerce, Census Bureau, American Community Survey, 2010.<br />
Postsecondary <strong>Education</strong> 167<br />
6<br />
Postsecondary <strong>Education</strong><br />
33
168 <strong>Higher</strong> <strong>Education</strong>: <strong>Gaps</strong> <strong>in</strong> <strong>Access</strong> <strong>and</strong> <strong>Persistence</strong> <strong>Study</strong><br />
Table 33-2.<br />
Number <strong>and</strong> percentage of 18- to 24-year-olds <strong>in</strong> the household <strong>and</strong> group quarters population, by school enrollment status, sex, race/ethnicity, <strong>and</strong><br />
nativity: 2006<br />
Sex, race/ethnicity, <strong>and</strong> nativity<br />
Sex<br />
Number<br />
Total<br />
Percentage<br />
distribution<br />
Percentage<br />
enrolled<br />
<strong>in</strong> high<br />
school<br />
Percentage<br />
enrolled <strong>in</strong><br />
college or<br />
graduate<br />
school<br />
Percentage<br />
with less<br />
than high<br />
school<br />
completion<br />
Percentage<br />
with high<br />
school<br />
completion<br />
only 1<br />
Not currently enrolled <strong>in</strong> school<br />
Percentage<br />
with some<br />
college<br />
Percentage with an associate’s<br />
degree or higher<br />
Total<br />
Percentage<br />
with an<br />
associate’s<br />
degree<br />
Percentage<br />
with a<br />
bachelor’s<br />
degree or<br />
higher<br />
Total 2 29,632,500 100.0 9.5 39.7 11.2 23.2 9.2 7.1 2.1 5.0<br />
Male 15,289,800 51.6 10.2 35.6 13.3 26.0 9.1 5.9 1.9 4.0<br />
Female 14,342,700 48.4 8.7 44.2 9.0 20.2 9.4 8.5 2.3 6.1<br />
Race/ethnicity<br />
White 18,053,600 60.9 8.6 44.2 7.2 21.7 9.7 8.6 2.5 6.1<br />
Black 4,138,100 14.0 12.8 32.4 13.6 27.2 9.7 4.4 1.7 2.7<br />
Hispanic 5,270,700 17.8 9.7 25.4 24.8 28.3 7.9 3.8 1.6 2.2<br />
Asian 1,265,700 4.3 7.8 62.1 3.4 10.0 5.7 10.9 1.4 9.5<br />
Native Hawaiian/Pacific Isl<strong>and</strong>er 51,800 0.2 12.0 31.4 8.8 31.0 10.9 5.9 3.2 2.6 !<br />
American Indian/Alaska Native 3 254,500 0.9 14.0 24.6 17.9 30.2 10.3 3.0 1.7 1.3<br />
American Indian 209,400 0.7 13.4 24.1 17.9 30.8 10.8 3.0 1.9 1.1<br />
Alaska Native 14,200 0.1 27.2 14.7 20.4 30.5 4.7 ! 2.4 ! ‡ ‡<br />
Two or more races 505,500 1.7 11.4 43.2 8.6 21.3 10.1 5.3 1.7 3.6<br />
Race/ethnicity by sex<br />
Male<br />
White 9,266,100 60.6 9.4 40.3 8.3 25.0 9.8 7.2 2.3 4.9<br />
Black 2,086,000 13.6 14.0 27.7 16.7 29.0 9.1 3.4 1.5 1.9<br />
Hispanic 2,843,800 18.6 9.6 20.7 29.2 30.2 7.2 3.1 1.3 1.8<br />
Asian 640,600 4.2 8.2 60.5 3.9 11.5 6.4 9.5 1.2 8.3<br />
Native Hawaiian/Pacific Isl<strong>and</strong>er 28,200 0.2 12.6 25.6 9.6 32.8 10.5 8.9 4.7 ! 4.2 !<br />
American Indian/Alaska Native 3 127,900 0.8 15.7 21.4 20.2 30.7 9.5 2.5 1.3 ! 1.2<br />
American Indian 102,000 0.7 16.2 20.9 19.7 30.9 10.0 2.4 1.7 ! 0.7 !<br />
Alaska Native 7,500 0.1 23.7 11.4 ! 24.2 ! 37.0 ‡ ‡ # ‡<br />
Two or more races 245,300 1.6 13.2 39.1 10.2 22.2 10.8 4.3 1.7 2.6<br />
See notes at end of table.
Table 33-2.<br />
Number <strong>and</strong> percentage of 18- to 24-year-olds <strong>in</strong> the household <strong>and</strong> group quarters population, by school enrollment status, sex, race/ethnicity, <strong>and</strong><br />
nativity: 2006—Cont<strong>in</strong>ued<br />
Sex, race/ethnicity, <strong>and</strong> nativity<br />
Number<br />
Total<br />
Percentage<br />
distribution<br />
Percentage<br />
enrolled<br />
<strong>in</strong> high<br />
school<br />
Percentage<br />
enrolled <strong>in</strong><br />
college or<br />
graduate<br />
school<br />
Percentage<br />
with less<br />
than high<br />
school<br />
completion<br />
Percentage<br />
with high<br />
school<br />
completion<br />
only 1<br />
Not currently enrolled <strong>in</strong> school<br />
Percentage<br />
with some<br />
college<br />
Percentage with an associate’s<br />
degree or higher<br />
Total<br />
Percentage<br />
with an<br />
associate’s<br />
degree<br />
Percentage<br />
with a<br />
bachelor’s<br />
degree or<br />
higher<br />
Total 2 29,632,500 100.0 9.5 39.7 11.2 23.2 9.2 7.1 2.1 5.0<br />
Race/ethnicity by sex<br />
Female<br />
Nativity<br />
White 8,787,500 61.3 7.8 48.2 6.1 18.1 9.7 10.1 2.6 7.5<br />
Black 2,052,000 14.3 11.5 37.2 10.4 25.3 10.3 5.4 1.8 3.6<br />
Hispanic 2,426,900 16.9 9.8 30.9 19.8 26.1 8.7 4.7 1.9 2.8<br />
Asian 625,100 4.4 7.3 63.8 2.9 8.5 5.1 12.3 1.6 10.7<br />
Native Hawaiian/Pacific Isl<strong>and</strong>er 23,600 0.2 11.2 38.2 8.0 28.9 11.4 2.2 ! 1.5 ! ‡<br />
American Indian/Alaska Native 3 126,600 0.9 12.3 27.9 15.5 29.6 11.2 3.4 2.0 1.4 !<br />
American Indian 107,300 0.8 10.8 27.1 16.3 30.6 11.7 3.5 2.1 ! 1.4 !<br />
Alaska Native 6,700 0.1 31.2 18.4 ! 16.2 ! 23.3 6.8 ! 4.0 ! ‡ ‡<br />
Two or more races 260,200 1.8 9.7 47.1 7.0 20.5 9.5 6.2 1.6 4.5<br />
Hispanic<br />
Born with<strong>in</strong> the United States 4 3,166,800 60.1 10.9 33.1 15.2 27.3 9.4 4.1 1.8 2.4<br />
Born outside of the United States 2,103,900 39.9 7.9 13.8 39.4 29.9 5.7 3.3 1.3 2.1<br />
# Rounds to zero.<br />
! Interpret data with caution. The coefficient of variation (CV) for this estimate is 30 percent or greater.<br />
‡ Report<strong>in</strong>g st<strong>and</strong>ards not met. Either there are too few cases or the coefficient of variation (CV) is 50 percent or greater.<br />
1<br />
Includes equivalent credential, <strong>in</strong>clud<strong>in</strong>g a General <strong>Education</strong>al Development (GED) certificate.<br />
2<br />
Total <strong>in</strong>cludes other racial/ethnic groups not shown separately <strong>in</strong> the table.<br />
3<br />
Includes persons report<strong>in</strong>g American Indian only, Alaska Native only, <strong>and</strong> persons from American Indian <strong>and</strong>/or Alaska Native tribes specified or not specified.<br />
4<br />
Includes the 50 states, District of Columbia, Puerto Rico, Guam, the U.S. Virg<strong>in</strong> Isl<strong>and</strong>s, <strong>and</strong> the Northern Marianas. Also <strong>in</strong>cludes those born abroad of American parents.<br />
NOTE: Race categories exclude persons of Hispanic ethnicity. Detail may not sum to totals because of round<strong>in</strong>g.<br />
SOURCE: U.S. Department of Commerce, Census Bureau, American Community Survey, 2006.<br />
Postsecondary <strong>Education</strong> 169<br />
6<br />
Postsecondary <strong>Education</strong><br />
33
Indicator 34<br />
Entry Into Postsecondary <strong>Education</strong><br />
Among 2004 high school graduates, a higher percentage of females (83 percent)<br />
than males (76 percent) had ever attended a postsecondary <strong>in</strong>stitution by<br />
2006. <strong>Higher</strong> percentages of females also enrolled immediately <strong>in</strong> a postsecondary<br />
<strong>in</strong>stitution (74 percent) <strong>and</strong> enrolled <strong>in</strong> moderately or highly selective <strong>in</strong>stitutions<br />
(41 percent) than did males (67 <strong>and</strong> 36 percent, respectively).<br />
By 2006, about 80 percent of 2004 high school graduates<br />
had ever attended a postsecondary <strong>in</strong>stitution. Among<br />
the graduat<strong>in</strong>g class, 71 percent enrolled immediately<br />
after graduation from high school, <strong>and</strong> 9 percent<br />
delayed enrollment. A higher percentage of females<br />
(83 percent) than males (76 percent) had ever attended<br />
a postsecondary <strong>in</strong>stitution by 2006—a pattern that<br />
was also observed among White (85 vs. 78 percent,<br />
respectively) Hispanic (76 vs. 68 percent, respectively),<br />
<strong>and</strong> Asian (92 vs. 88 percent, respectively) high school<br />
graduates. The percentage of females with immediate<br />
postsecondary enrollment (74 percent) was higher than<br />
that of males (67 percent). This pattern held for White,<br />
Hispanic, <strong>and</strong> Asian students as well.<br />
Overall racial/ethnic differences were also found. For<br />
example, the percentages of Black <strong>and</strong> Hispanic graduates<br />
who had ever attended a postsecondary <strong>in</strong>stitution by<br />
2006 were lower than those of Whites <strong>and</strong> Asians (76<br />
<strong>and</strong> 73 percent vs. 82 <strong>and</strong> 90 percent, respectively). A<br />
similar pattern was found among these groups concern<strong>in</strong>g<br />
immediate postsecondary enrollment. In addition, lower<br />
percentages of American Indian/Alaska Native students<br />
than Asian students had ever attended a postsecondary<br />
<strong>in</strong>stitution (70 vs. 90 percent), <strong>and</strong> lower percentages of<br />
American Indian/Alaska Native students had enrolled <strong>in</strong><br />
postsecondary education immediately after high school<br />
graduation (52 percent) than did their Asian <strong>and</strong> White<br />
counterparts (85 <strong>and</strong> 74 percent, respectively).<br />
Postsecondary <strong>in</strong>stitutions <strong>in</strong>clude 4-year <strong>in</strong>stitutions,<br />
2-year <strong>in</strong>stitutions, <strong>and</strong> less-than 2-year <strong>in</strong>stitutions.<br />
Among 2004 high school graduates, 48 percent first<br />
attended a 4-year <strong>in</strong>stitution, 30 percent first attended a<br />
2-year <strong>in</strong>stitution, <strong>and</strong> 2 percent first attended a less-than<br />
2-year <strong>in</strong>stitution. Overall, female high school graduates<br />
first attended 4-year <strong>in</strong>stitutions at a higher rate than<br />
males (50 percent vs. 46 percent, respectively). This<br />
pattern by sex was also observed among White <strong>and</strong> Asian<br />
high school graduates. No measurable differences by sex<br />
were found among Black, Hispanic, or American Indian/<br />
Alaska Native graduates or among high school graduates<br />
of two or more races. Across racial/ethnic groups overall,<br />
Blacks (44 percent), Hispanics (29 percent), <strong>and</strong> American<br />
Figure 34-1.<br />
Percentage of 2004 high school graduates who immediately enrolled <strong>in</strong> first postsecondary <strong>in</strong>stitution, by<br />
race/ethnicity <strong>and</strong> sex: 2006<br />
Percent<br />
100<br />
80<br />
60<br />
40<br />
67<br />
74<br />
70<br />
79<br />
61<br />
64<br />
54<br />
62<br />
82<br />
89<br />
62<br />
74<br />
45<br />
59<br />
68 67<br />
20<br />
0<br />
Total White Black Hispanic Asian Native<br />
Hawaiian/<br />
Pacific Isl<strong>and</strong>er<br />
Race/ethnicity<br />
American<br />
Indian/<br />
Alaska Native<br />
Two or more<br />
races<br />
Male<br />
Female<br />
NOTE: Race categories exclude persons of Hispanic ethnicity.<br />
SOURCE: U.S. Department of <strong>Education</strong>, National Center for <strong>Education</strong> Statistics, <strong>Education</strong> Longitud<strong>in</strong>al <strong>Study</strong> of 2002 (ELS:2002), “Second Follow-up, 2006.”<br />
170 <strong>Higher</strong> <strong>Education</strong>: <strong>Gaps</strong> <strong>in</strong> <strong>Access</strong> <strong>and</strong> <strong>Persistence</strong> <strong>Study</strong>
Figure 34-2.<br />
Percent<br />
100<br />
Percentage of 2004 high school graduates who first attended a 4-year postsecondary <strong>in</strong>stitution, by race/<br />
ethnicity <strong>and</strong> sex: 2006<br />
34<br />
80<br />
66<br />
60<br />
40<br />
46<br />
50 49<br />
55<br />
43 44<br />
27<br />
32<br />
57<br />
25!<br />
44<br />
46<br />
53<br />
20<br />
0<br />
Total 1 White Black Hispanic Asian American Indian/<br />
Alaska Native<br />
Two or more<br />
races<br />
Race/ethnicity<br />
Male<br />
Female<br />
! Interpret data with caution. The coefficient of variation (CV) for this estimate is 30 percent or greater.<br />
1<br />
Total <strong>in</strong>cludes other racial/ethnic groups not shown separately <strong>in</strong> the figure.<br />
NOTE: Report<strong>in</strong>g st<strong>and</strong>ards for Native Hawaiians/Pacific Isl<strong>and</strong>ers were not met; therefore, data for this group are not shown <strong>in</strong> the figure. Race categories<br />
exclude persons of Hispanic ethnicity.<br />
SOURCE: U.S. Department of <strong>Education</strong>, National Center for <strong>Education</strong> Statistics, <strong>Education</strong> Longitud<strong>in</strong>al <strong>Study</strong> of 2002 (ELS:2002/2006), “Base-year (2002) to<br />
Second Follow-up (2006).”<br />
Figure 34-3.<br />
Percent<br />
100<br />
80<br />
60<br />
40<br />
20<br />
36<br />
Percentage of 2004 high school graduates who first attended a moderately or highly selective<br />
postsecondary <strong>in</strong>stitution, by race/ethnicity <strong>and</strong> sex: 2006<br />
41 42<br />
49<br />
23 24<br />
15<br />
21<br />
49<br />
57<br />
42<br />
28!<br />
21!<br />
30!<br />
37 36<br />
Postsecondary <strong>Education</strong><br />
6<br />
0<br />
Total White Black Hispanic Asian Native<br />
Hawaiian/<br />
Pacific Isl<strong>and</strong>er<br />
Race/ethnicity<br />
American<br />
Indian/<br />
Alaska Native<br />
Two or more<br />
races<br />
Male<br />
Female<br />
! Interpret data with caution. The coefficient of variation (CV) for this estimate is 30 percent or greater.<br />
NOTE: The moderately or highly selective categories correspond to 25th percentile ACT-equivalent scores of students who were accepted to the<br />
<strong>in</strong>stitution. Race categories exclude persons of Hispanic ethnicity.<br />
SOURCE: U.S. Department of <strong>Education</strong>, National Center for <strong>Education</strong> Statistics, <strong>Education</strong> Longitud<strong>in</strong>al <strong>Study</strong> of 2002 (ELS:2002/2006), “Base-year<br />
(2002) to Second Follow-up (2006).”<br />
Postsecondary <strong>Education</strong> 171
Indians/Alaska Natives (35 percent) first attended 4-year<br />
<strong>in</strong>stitutions at lower rates than Whites (52 percent) <strong>and</strong><br />
Asians (61 percent). However, Black high school graduates<br />
first attended 4-year <strong>in</strong>stitutions at a higher rate than their<br />
Hispanic counterparts.<br />
Among the 2004 high school graduat<strong>in</strong>g class, some 16<br />
percent of graduates first attended a highly selective 4-year<br />
<strong>in</strong>stitution by 2006. Twenty-three percent first attended a<br />
moderately selective 4-year <strong>in</strong>stitution, 6 percent attended<br />
an <strong>in</strong>clusive 4-year <strong>in</strong>stitution, <strong>and</strong> 4 percent attended a<br />
4-year <strong>in</strong>stitution of unknown selectivity. The percentage<br />
of males attend<strong>in</strong>g moderately or highly selective 4-year<br />
Technical Notes<br />
Respondents are considered to have immediate<br />
enrollment if they reported that they enrolled <strong>in</strong> their<br />
first postsecondary <strong>in</strong>stitution <strong>in</strong> December 2004 or<br />
earlier. Respondents are considered to have delayed<br />
enrollment if they reported that they enrolled <strong>in</strong> their<br />
first postsecondary <strong>in</strong>stitution <strong>in</strong> January 2005 or later.<br />
The selectivity of <strong>in</strong>stitutions is def<strong>in</strong>ed accord<strong>in</strong>g to<br />
the def<strong>in</strong>ition used <strong>in</strong> NCES’s Integrated Postsecondary<br />
<strong>in</strong>stitutions (36 percent) was lower than the percentage of<br />
females (41 percent) who did. This pattern by sex held for<br />
Whites (42 vs. 49 percent, respectively), Hispanics (15 vs.<br />
21 percent, respectively), <strong>and</strong> Asians (49 vs. 57 percent,<br />
respectively). Across racial/ethnic groups, Black <strong>and</strong><br />
Hispanic students attended moderately or highly selective<br />
4-year <strong>in</strong>stitutions (23 <strong>and</strong> 18 percent, respectively) at<br />
lower percentages than did Whites, Asians, <strong>and</strong> those of<br />
two or more races (45, 53, <strong>and</strong> 37 percent, respectively).<br />
Black students attended moderately or highly selective<br />
4-year <strong>in</strong>stitutions at a higher percentage than did<br />
Hispanic students.<br />
<strong>Education</strong> Data System, which is based on the 2005<br />
Carnegie Classification of Institutions. The “<strong>in</strong>clusive,”<br />
“moderately selective,” <strong>and</strong> “highly selective” categories<br />
correspond to 25th percentile ACT-equivalent scores of<br />
students who were accepted to the <strong>in</strong>stitution. The score<br />
ranges for the categories are less than 18, between 18 <strong>and</strong><br />
21, <strong>and</strong> greater than 21 po<strong>in</strong>ts, respectively.<br />
172 <strong>Higher</strong> <strong>Education</strong>: <strong>Gaps</strong> <strong>in</strong> <strong>Access</strong> <strong>and</strong> <strong>Persistence</strong> <strong>Study</strong>
Table 34-1.<br />
Sex <strong>and</strong> race/ethnicity<br />
Sex<br />
Percentage of academic year 2004 high school graduates, by the tim<strong>in</strong>g of first postsecondary<br />
enrollment, sex, <strong>and</strong> race/ethnicity: 2006<br />
Ever attended a<br />
postsecondary<br />
<strong>in</strong>stitution<br />
Immediate<br />
enrollment <strong>in</strong><br />
postsecondary<br />
education 1<br />
Delayed<br />
enrollment <strong>in</strong><br />
postsecondary<br />
education 2<br />
Nonenrollee, or still<br />
enrolled <strong>in</strong> high<br />
school<br />
Total 79.8 70.6 9.2 20.2<br />
Male 76.4 66.9 9.5 23.6<br />
Female 83.0 74.0 8.9 17.0<br />
34<br />
Race/ethnicity<br />
White 81.9 74.4 7.5 18.1<br />
Black 76.3 62.5 13.8 23.7<br />
Hispanic 72.6 58.4 14.1 27.4<br />
Asian 90.0 85.2 4.8 10.0<br />
Native Hawaiian/Pacific Isl<strong>and</strong>er 74.4 66.5 6.8 25.6 !<br />
American Indian/Alaska Native 69.6 52.1 17.5 ! 30.4<br />
Two or more races 74.0 67.2 6.8 26.0<br />
Race/ethnicity by sex<br />
Male<br />
White 78.3 69.9 8.4 21.7<br />
Black 73.7 61.1 12.6 26.3<br />
Hispanic 68.2 53.9 14.3 31.8<br />
Asian 87.9 82.0 5.8 12.1<br />
Native Hawaiian/Pacific Isl<strong>and</strong>er 65.1 62.0 3.1 34.9 !<br />
American Indian/Alaska Native 62.5 45.3 17.3 ! 37.5 !<br />
Two or more races 72.4 67.8 4.6 ! 27.6<br />
Female<br />
White 85.4 78.7 6.7 14.6<br />
Black 78.6 63.7 14.9 21.4<br />
Hispanic 76.2 62.2 14.0 23.8<br />
Asian 92.3 88.6 3.7 7.7<br />
Native Hawaiian/Pacific Isl<strong>and</strong>er 89.2 74.4 13.4 ‡<br />
American Indian/Alaska Native 76.4 58.6 17.8 23.6 !<br />
Two or more races 75.7 66.7 8.9 24.3<br />
! Interpret data with caution. The coefficient of variation (CV) for this estimate is 30 percent or greater.<br />
‡ Report<strong>in</strong>g st<strong>and</strong>ards not met. Either there are too few cases or the coefficient of variation (CV) is 50 percent or greater.<br />
1<br />
Students report<strong>in</strong>g that they enrolled <strong>in</strong> their first postsecondary <strong>in</strong>stitution by December 2004 or earlier.<br />
2<br />
Students report<strong>in</strong>g that they enrolled <strong>in</strong> their first postsecondary <strong>in</strong>stitution by January 2005 or later.<br />
NOTE: Estimates were weighted by F2F1WT. Race categories exclude persons of Hispanic ethnicity. Detail may not sum to totals because of round<strong>in</strong>g.<br />
SOURCE: U.S. Department of <strong>Education</strong>, National Center for <strong>Education</strong> Statistics, <strong>Education</strong> Longitud<strong>in</strong>al <strong>Study</strong> of 2002 (ELS:2002), “Second Follow-up,<br />
2006.”<br />
Postsecondary <strong>Education</strong><br />
6<br />
Postsecondary <strong>Education</strong> 173
Table 34-2.<br />
Percentage of academic year 2004 high school graduates, by the level of postsecondary <strong>in</strong>stitution first<br />
attended, sex, <strong>and</strong> race/ethnicity: 2006<br />
Sex <strong>and</strong> race/ethnicity 4-year <strong>in</strong>stitution 2-year <strong>in</strong>stitution<br />
Sex<br />
Less-than-2-year<br />
<strong>in</strong>stitution<br />
Nonenrollee or<br />
still enrolled <strong>in</strong><br />
high school<br />
Total 48.1 29.7 2.0 20.3<br />
Male 45.6 29.1 1.7 23.7<br />
Female 50.4 30.2 2.3 17.1<br />
Race/ethnicity<br />
White 52.3 28.1 1.5 18.1<br />
Black 43.5 29.6 3.1 23.8<br />
Hispanic 29.3 39.6 3.4 27.7<br />
Asian 61.4 27.8 0.8 ! 10.0<br />
Native Hawaiian/Pacific Isl<strong>and</strong>er 45.6 24.8 ! ‡ 26.8 !<br />
American Indian/Alaska Native 34.5 32.3 ‡ 30.4<br />
Two or more races 49.5 22.1 2.4 ! 26.0<br />
Race/ethnicity by sex<br />
Male<br />
White 49.5 27.6 1.2 21.7<br />
Black 43.1 27.9 2.6 26.4<br />
Hispanic 26.5 38.2 3.2 32.1<br />
Asian 57.3 30.0 ‡ 12.1<br />
Native Hawaiian/Pacific Isl<strong>and</strong>er ‡ ‡ ‡ ‡<br />
American Indian/Alaska Native 25.2 ! 33.6 ! ‡ 37.5 !<br />
Two or more races 45.6 24.7 ‡ 27.6<br />
Female<br />
White 55.0 28.5 1.8 14.6<br />
Black 43.9 31.0 3.6 21.5<br />
Hispanic 31.7 40.7 3.6 24.0<br />
Asian 65.8 25.4 1.0 ! 7.8<br />
Native Hawaiian/Pacific Isl<strong>and</strong>er ‡ ‡ ‡ ‡<br />
American Indian/Alaska Native 43.5 31.1 ‡ 23.6 !<br />
Two or more races 53.3 19.5 2.8 ! 24.3<br />
! Interpret data with caution. The coefficient of variation (CV) for this estimate is 30 percent or greater.<br />
‡ Report<strong>in</strong>g st<strong>and</strong>ards not met. Either there are too few cases or the coefficient of variation (CV) is 50 percent or greater.<br />
NOTE: Estimates were weighted by F2F1WT. Race categories exclude persons of Hispanic ethnicity. Detail may not sum to totals because of round<strong>in</strong>g.<br />
SOURCE: U.S. Department of <strong>Education</strong>, National Center for <strong>Education</strong> Statistics, <strong>Education</strong> Longitud<strong>in</strong>al <strong>Study</strong> of 2002 (ELS:2002), “Second Follow-up,<br />
2006.”<br />
174 <strong>Higher</strong> <strong>Education</strong>: <strong>Gaps</strong> <strong>in</strong> <strong>Access</strong> <strong>and</strong> <strong>Persistence</strong> <strong>Study</strong>
Table 34-3.<br />
Sex <strong>and</strong> race/ethnicity<br />
Sex<br />
Percentage of academic year 2004 high school graduates, by the selectivity of the first postsecondary<br />
<strong>in</strong>stitution attended, sex, <strong>and</strong> race/ethnicity: 2006<br />
Moderately<br />
or highly<br />
selective<br />
Highly<br />
elective<br />
4-year <strong>in</strong>stitution<br />
Moderately<br />
selective<br />
Inclusive<br />
Unknown<br />
selectivity<br />
Less-than-<br />
4-year<br />
<strong>in</strong>stitution<br />
Nonenrollee<br />
or still<br />
enrolled <strong>in</strong><br />
high school<br />
Total 38.3 15.8 22.5 5.8 4.0 31.7 20.2<br />
Male 35.6 15.2 20.4 5.6 4.4 30.7 23.7<br />
Female 40.9 16.4 24.4 5.9 3.6 32.6 17.1<br />
34<br />
Race/ethnicity<br />
White 45.2 19.0 26.1 3.7 3.4 29.6 18.1<br />
Black 23.4 5.7 17.7 16.6 3.5 32.7 23.8<br />
Hispanic 17.9 6.4 11.5 5.1 6.4 43.0 27.6<br />
Asian 53.0 33.3 19.7 4.8 3.6 28.6 10.0<br />
Native Hawaiian/<br />
Pacific Isl<strong>and</strong>er 37.1 ‡ 27.4 ‡ # 27.6 26.8 !<br />
American Indian/<br />
Alaska Native 25.5 ‡ 18.0 ‡ ‡ 35.1 30.4<br />
Two or more races 36.5 13.8 22.7 7.3 5.7 24.5 26.0<br />
Race/ethnicity by sex<br />
Male<br />
White 41.6 18.0 23.6 4.0 3.8 28.8 21.7<br />
Black 22.6 5.8 16.8 16.8 3.7 30.4 26.4<br />
Hispanic 14.7 5.9 8.8 4.1 7.9 41.3 31.9<br />
Asian 49.1 29.4 19.7 3.9 4.3 30.6 12.1<br />
Native Hawaiian/<br />
Pacific Isl<strong>and</strong>er 41.9 ‡ ‡ ‡ ‡ ‡ ‡<br />
American Indian/<br />
Alaska Native 20.6 ! ‡ 16.6 ! ‡ ‡ 37.3 ! 37.5 !<br />
Two or more races 37.1 16.1 21.0 4.4 ! 4.1 ! 26.7 27.6<br />
Female<br />
White 48.5 20.0 28.6 3.5 3.0 30.3 14.6<br />
Black 24.2 5.7 18.5 16.4 3.2 34.7 21.4<br />
Hispanic 20.6 6.8 13.7 5.9 5.2 44.5 23.9<br />
Asian 57.2 37.5 19.7 5.7 3.0 26.4 7.8<br />
Native Hawaiian/<br />
Pacific Isl<strong>and</strong>er 28.4 ! ‡ ‡ ‡ ‡ ‡ ‡<br />
American Indian/<br />
Alaska Native 30.3 ! ‡ 19.3 ! ‡ ‡ 32.9 23.6 !<br />
Two or more races 35.9 11.5 24.4 10.1 7.4 ! 22.3 24.3<br />
# Rounds to zero.<br />
! Interpret data with caution. The coefficient of variation (CV) for this estimate is 30 percent or greater.<br />
‡ Report<strong>in</strong>g st<strong>and</strong>ards not met. Either there are too few cases or the coefficient of variation (CV) is 50 percent or greater.<br />
NOTE: Estimates were weighted by F2F1WT. The selectivity of <strong>in</strong>stitutions is def<strong>in</strong>ed accord<strong>in</strong>g to the def<strong>in</strong>ition used <strong>in</strong> NCES’s Integrated Postsecondary<br />
<strong>Education</strong> Data System, which is based on the 2005 Carnegie Classification of Institutions. The “<strong>in</strong>clusive,” “moderately selective,” <strong>and</strong> “highly selective”<br />
categories correspond to 25th percentile ACT-equivalent scores of students who were accepted to the <strong>in</strong>stitution. The score ranges for the categories<br />
are less than 18, between 18 <strong>and</strong> 21, <strong>and</strong> greater than 21 po<strong>in</strong>ts, respectively. Race categories exclude persons of Hispanic ethnicity. Detail may not<br />
sum to totals because of round<strong>in</strong>g.<br />
SOURCE: U.S. Department of <strong>Education</strong>, National Center for <strong>Education</strong> Statistics, <strong>Education</strong> Longitud<strong>in</strong>al <strong>Study</strong> of 2002 (ELS:2002), “Second Follow-up,<br />
2006.”<br />
Postsecondary <strong>Education</strong><br />
6<br />
Postsecondary <strong>Education</strong> 175
Indicator 35<br />
Price of Attendance <strong>and</strong> F<strong>in</strong>ancial Aid<br />
In 2007–08, the average annual total price of attendance for undergraduates who<br />
attended full time, full year at one <strong>in</strong>stitution was not measurably different for males<br />
<strong>and</strong> females. A higher percentage of female than male undergraduates (82 vs.<br />
77 percent) received f<strong>in</strong>ancial aid. Among students who received f<strong>in</strong>ancial aid,<br />
the average amount of total aid was not measurably different between males <strong>and</strong><br />
females.<br />
The total price of attend<strong>in</strong>g a postsecondary <strong>in</strong>stitution<br />
<strong>in</strong>cludes tuition <strong>and</strong> fees, books <strong>and</strong> materials, <strong>and</strong> an<br />
allowance for liv<strong>in</strong>g expenses. In 2007–08, the annual<br />
average was $22,400 for the total price of attendance for<br />
undergraduates who attended full time, full year at one<br />
<strong>in</strong>stitution. 6 In 2007–08, the average annual total price<br />
of attendance for full-time, full-year undergraduates was<br />
not measurably different for males <strong>and</strong> females overall or<br />
with<strong>in</strong> racial/ethnic groups.<br />
The average annual total price of attendance for fulltime,<br />
full-year undergraduates varied by race/ethnicity<br />
<strong>in</strong> 2007–08. The average price was higher for Asians<br />
($23,800), Native Hawaiians/Pacific Isl<strong>and</strong>ers ($22,900),<br />
students of two or more races ($22,800), Whites<br />
($22,700), <strong>and</strong> Blacks ($22,000) than for Hispanics<br />
($20,000) <strong>and</strong> American Indians/Alaska Natives<br />
($19,100). In addition, the average price was higher for<br />
Asians than for Whites <strong>and</strong> Blacks.<br />
6<br />
With<strong>in</strong> this <strong>in</strong>dicator, “undergraduates who attended full time, full year<br />
at one <strong>in</strong>stitution” was shortened to “full-time, full-year undergraduates.”<br />
Most students <strong>and</strong> their families did not pay the full<br />
price of attendance at postsecondary <strong>in</strong>stitutions. In<br />
2007–08, approximately 80 percent of all full-time,<br />
full-year undergraduates <strong>and</strong> their families received<br />
f<strong>in</strong>ancial aid to defray their expenses. Among students<br />
who received f<strong>in</strong>ancial aid, the average amount of total aid<br />
was approximately $12,900 annually. A higher percentage<br />
of female than male students received f<strong>in</strong>ancial aid<br />
(82 vs. 77 percent). The same pattern also was observed<br />
for White, Hispanic, <strong>and</strong> Asian males <strong>and</strong> females. For<br />
example, about 89 percent of Hispanic females received<br />
f<strong>in</strong>ancial aid, compared with 82 percent of Hispanic<br />
males. However, among the students who received aid, the<br />
average amount of total aid was not measurably different<br />
for males <strong>and</strong> females overall or with<strong>in</strong> each racial/ethnic<br />
group.<br />
The percentage of full-time, full-year undergraduates who<br />
received f<strong>in</strong>ancial aid <strong>and</strong> the average amount received<br />
varied by race/ethnicity <strong>in</strong> 2007–08. The percentage<br />
of Asian students receiv<strong>in</strong>g f<strong>in</strong>ancial aid (68 percent)<br />
Figure 35-1.<br />
Average annual total price of attendance for undergraduates who attended full time, full year at one<br />
<strong>in</strong>stitution, by race/ethnicity <strong>and</strong> sex: Academic year 2007–08<br />
Race/ethnicity<br />
$22,400<br />
$22,300<br />
Total 1 $0 $10,000 $20,000 $30,000<br />
White<br />
Black<br />
Hispanic<br />
Asian<br />
$19,900<br />
$20,200<br />
$22,800<br />
$22,700<br />
$22,100<br />
$22,000<br />
$23,500<br />
$24,100<br />
Native Hawaiian/<br />
Pacific Isl<strong>and</strong>er<br />
American Indian/<br />
Alaska Native<br />
$20,900<br />
$19,300<br />
$18,900<br />
$24,800<br />
Two or more races<br />
$22,800<br />
$22,900<br />
Total price<br />
Male<br />
Female<br />
1<br />
Total <strong>in</strong>cludes other racial/ethnic groups not shown separately <strong>in</strong> the figure.<br />
NOTE: The total price of attendance for a postsecondary <strong>in</strong>stitution <strong>in</strong>cludes tuition <strong>and</strong> fees, books <strong>and</strong> supplies, room <strong>and</strong> board, <strong>and</strong> transportation <strong>and</strong><br />
personal expenses. Race categories exclude persons of Hispanic ethnicity.<br />
SOURCE: U.S. Department of <strong>Education</strong>, National Center for <strong>Education</strong> Statistics, 2007–08 National Postsecondary Student Aid <strong>Study</strong> (NPSAS:08).<br />
176 <strong>Higher</strong> <strong>Education</strong>: <strong>Gaps</strong> <strong>in</strong> <strong>Access</strong> <strong>and</strong> <strong>Persistence</strong> <strong>Study</strong>
Figure 35-2.<br />
Percentage of undergraduates attend<strong>in</strong>g full time, full year at one <strong>in</strong>stitution who received f<strong>in</strong>ancial aid,<br />
by race/ethnicity <strong>and</strong> sex: Academic year 2007–08<br />
35<br />
Race/ethnicity<br />
77<br />
82<br />
Total 1 0 20 40 60 80 100<br />
White<br />
Black<br />
Hispanic<br />
Asian<br />
64<br />
72<br />
75<br />
80<br />
82<br />
91<br />
93<br />
89<br />
Native Hawaiian/<br />
Pacific Isl<strong>and</strong>er<br />
American Indian/<br />
Alaska Native<br />
Two or more races<br />
78<br />
81<br />
83<br />
86<br />
88<br />
85<br />
Male<br />
Percent<br />
Female<br />
1<br />
Total <strong>in</strong>cludes other racial/ethnic groups not shown separately <strong>in</strong> the figure.<br />
NOTE: F<strong>in</strong>ancial aid <strong>in</strong>cludes all types of aid from any source except parents, friends, or relatives. Parent Loans for Undergraduate Students (PLUS) are also<br />
<strong>in</strong>cluded. Race categories exclude persons of Hispanic ethnicity.<br />
SOURCE: U.S. Department of <strong>Education</strong>, National Center for <strong>Education</strong> Statistics, 2007–08 National Postsecondary Student Aid <strong>Study</strong> (NPSAS:08).<br />
was lower than the percentage of students from any<br />
other racial/ethnic group receiv<strong>in</strong>g it. The percentages<br />
of Black (92 percent), American Indian/Alaska Native<br />
(87 percent), <strong>and</strong> Hispanic (86 percent) undergraduates<br />
<strong>and</strong> undergraduates of two or more races (84 percent)<br />
receiv<strong>in</strong>g f<strong>in</strong>ancial aid were higher than the percentage<br />
of Whites receiv<strong>in</strong>g aid (78 percent). In addition, the<br />
percentage of Black students receiv<strong>in</strong>g f<strong>in</strong>ancial aid<br />
was higher than the percentages of Hispanic students,<br />
students of two or more races, <strong>and</strong> Native Hawaiian/<br />
Pacific Isl<strong>and</strong>er students (80 percent) receiv<strong>in</strong>g aid.<br />
Among undergraduates who received f<strong>in</strong>ancial aid,<br />
the average amount of total aid received was lower<br />
for American Indians/Alaska Natives ($10,800) <strong>and</strong><br />
Hispanics ($11,500) than for students of any other racial/<br />
ethnic group; <strong>in</strong> addition, the average amount for Blacks<br />
($13,600) was higher than that for Whites ($13,000).<br />
In 2007–08, about 53 percent of full-time, full-year<br />
undergraduates received student loans to pay for their<br />
expenses; among students who received student loans,<br />
the average annual amount of total student loans was<br />
$8,000. A higher percentage of females than males<br />
received student loans (55 vs. 50 percent). The same<br />
pattern also was observed for White <strong>and</strong> Black males <strong>and</strong><br />
females. For example, 72 percent of Black females received<br />
student loans, compared with 65 percent of Black males.<br />
However, among students who took out student loans, the<br />
average amount of total student loans was not measurably<br />
different between males <strong>and</strong> females overall or with<strong>in</strong><br />
each racial/ethnic group.<br />
In 2007–08, the percentage of full-time, full-year<br />
undergraduates who received student loans <strong>and</strong> the<br />
average amount received varied by race/ethnicity.<br />
Specifically, the percentage of students who received<br />
student loans was higher for Blacks (70 percent) than for<br />
students of any other racial/ethnic group. In addition, the<br />
percentage of students of two or more races who received<br />
student loans (58 percent) was higher than the percentages<br />
of White (52 percent) <strong>and</strong> Hispanic (49 percent) students<br />
receiv<strong>in</strong>g them. Among students who took out student<br />
loans, the average annual amounts of total student loans<br />
were higher for Whites ($8,100) <strong>and</strong> Blacks ($8,000) than<br />
for Asians ($7,400); no measurable differences were found<br />
among other racial/ethnic groups.<br />
Postsecondary <strong>Education</strong><br />
6<br />
Postsecondary <strong>Education</strong> 177
Technical Notes<br />
F<strong>in</strong>ancial aid amounts are averages for those who<br />
received the specified type of aid. Full-time, full-year<br />
undergraduates were enrolled full time for 9 or more<br />
months from July 1, 2007, to June 30, 2008. Months<br />
did not have to be contiguous, <strong>and</strong> students did not have<br />
to be enrolled for a full month <strong>in</strong> order to be considered<br />
enrolled for that month. “Full time” is usually def<strong>in</strong>ed<br />
as 12 or more credit hours. “Total aid” <strong>in</strong>cludes all types<br />
of f<strong>in</strong>ancial aid from any source, except parents, friends,<br />
or relatives. Parent Loans for Undergraduate Students<br />
(PLUS) are also <strong>in</strong>cluded <strong>in</strong> “total aid,” but are excluded<br />
from “total student loans.” “Total grants” <strong>in</strong>cludes grants,<br />
scholarships, or tuition waivers from federal, state,<br />
<strong>in</strong>stitutional, or private sources, <strong>in</strong>clud<strong>in</strong>g employers.<br />
“Total student loans” <strong>in</strong>cludes federal, state, <strong>in</strong>stitutional,<br />
<strong>and</strong> private (alternative) loans. Estimates presented <strong>in</strong>clude<br />
dependent <strong>and</strong> <strong>in</strong>dependent undergraduates.<br />
178 <strong>Higher</strong> <strong>Education</strong>: <strong>Gaps</strong> <strong>in</strong> <strong>Access</strong> <strong>and</strong> <strong>Persistence</strong> <strong>Study</strong>
Table 35-1.<br />
Sex <strong>and</strong> race/ethnicity<br />
Sex<br />
Average annual tuition <strong>and</strong> fees, price of attendance, <strong>and</strong> f<strong>in</strong>ancial aid for undergraduates who attended full time, full year at one <strong>in</strong>stitution, by sex <strong>and</strong><br />
race/ethnicity: Academic year 2007–08<br />
Percent of<br />
undergraduates<br />
who attended<br />
full time/full<br />
year at one<br />
<strong>in</strong>stitution<br />
Average<br />
annual tuition<br />
<strong>and</strong> fees<br />
Average<br />
annual total<br />
price of<br />
attendance<br />
Percent of<br />
full-time/fullyear<br />
students<br />
receiv<strong>in</strong>g aid<br />
F<strong>in</strong>ancial aid<br />
Total aid Total grants Total student loans<br />
Average<br />
annual<br />
amount for<br />
those receiv<strong>in</strong>g<br />
aid<br />
Percent of<br />
full-time/fullyear<br />
students<br />
receiv<strong>in</strong>g<br />
grants<br />
Average<br />
annual<br />
amount for<br />
those receiv<strong>in</strong>g<br />
grants<br />
Percent of<br />
full-time/fullyear<br />
students<br />
receiv<strong>in</strong>g loans<br />
Average<br />
annual<br />
amount for<br />
those receiv<strong>in</strong>g<br />
loans<br />
Total 1 35.4 $10,300 $22,400 80.1 $12,900 65.3 $7,200 53.1 $8,000<br />
Male 36.2 10,500 22,400 77.0 13,000 61.3 7,300 50.3 8,100<br />
Female 34.8 10,200 22,300 82.5 12,800 68.5 7,200 55.2 8,000<br />
Race/ethnicity<br />
White 37.6 10,900 22,700 77.8 13,000 61.6 7,200 52.3 8,100<br />
Black 29.4 9,100 22,000 92.0 13,600 79.7 7,100 69.8 8,000<br />
Hispanic 31.2 8,100 20,000 86.0 11,500 74.9 6,600 49.3 7,900<br />
Asian 37.5 11,700 23,800 68.0 12,900 55.6 9,100 36.4 7,400<br />
Native Hawaiian/Pacific Isl<strong>and</strong>er 28.8 10,400 22,900 80.2 13,400 68.3 6,000 51.9 8,700<br />
American Indian/Alaska Native 29.1 8,000 19,100 86.7 10,800 77.3 6,700 47.9 7,100<br />
Two or more races 38.7 10,400 22,800 83.5 13,700 68.3 8,300 57.8 7,600<br />
Race/ethnicity by sex<br />
Male<br />
White 38.2 11,000 22,800 75.2 13,200 58.2 7,300 50.3 8,200<br />
Black 29.2 9,700 22,100 90.6 13,900 77.0 7,700 65.0 8,100<br />
Hispanic 31.8 8,000 19,900 82.3 11,300 70.0 6,500 46.4 7,800<br />
Asian 40.0 11,600 23,500 63.9 12,600 50.4 8,300 36.9 7,200<br />
Native Hawaiian/Pacific<br />
Isl<strong>and</strong>er 31.0 8,300 20,900 82.9 12,500 72.8 5,200 50.9 9,400<br />
American Indian/Alaska Native 28.3 7,800 19,300 85.7 10,500 73.7 6,400 43.2 7,100<br />
Two or more races 38.2 10,300 22,800 81.0 13,600 68.1 7,900 53.3 7,700<br />
Postsecondary <strong>Education</strong> 179<br />
Female<br />
White 37.1 10,700 22,700 79.9 12,900 64.5 7,200 54.0 8,100<br />
Black 29.6 8,800 22,000 92.8 13,400 81.2 6,800 72.5 7,900<br />
Hispanic 30.8 8,200 20,200 88.7 11,500 78.3 6,600 51.3 8,000<br />
Asian 35.4 11,800 24,100 72.0 13,100 60.8 9,600 35.9 7,600<br />
Native Hawaiian/Pacific<br />
Isl<strong>and</strong>er 27.1 12,200 24,800 77.7 14,400 64.2 6,800 52.7 8,100<br />
American Indian/Alaska Native 29.8 8,200 18,900 87.5 11,000 80.2 6,900 51.6 7,200<br />
Two or more races 39.1 10,500 22,900 85.2 13,800 68.5 8,500 60.9 7,600<br />
1<br />
Total <strong>in</strong>cludes other racial/ethnic groups not shown separately <strong>in</strong> the table.<br />
NOTE: Amounts are averages for those who received the specified type of aid. Full-time/full-year students were enrolled full time for 9 or more months from July 1, 2007 to June 30, 2008. Months did not have to be<br />
contiguous, <strong>and</strong> students did not have to be enrolled for a full month <strong>in</strong> order to be considered enrolled for that month. “Full time” is usually def<strong>in</strong>ed as 12 or more credit hours. The total price of attendance for a<br />
postsecondary <strong>in</strong>stitution <strong>in</strong>cludes tuition <strong>and</strong> fees, books <strong>and</strong> supplies, room <strong>and</strong> board, <strong>and</strong> transportation <strong>and</strong> personal expenses. “Total aid” <strong>in</strong>cludes all types of f<strong>in</strong>ancial aid from any source except parents,<br />
friends, or relatives. Parent Loans for Undergraduate Students (PLUS) are also <strong>in</strong>cluded <strong>in</strong> “total aid,” but are excluded from “total student loans.” “Total grants” <strong>in</strong>cludes grants, scholarships, or tuition waivers<br />
from federal, state, <strong>in</strong>stitutional, or private sources, <strong>in</strong>clud<strong>in</strong>g employers. “Total student loans” <strong>in</strong>cludes federal, state, <strong>in</strong>stitutional, <strong>and</strong> private (alternative) loans. Estimates presented <strong>in</strong>clude dependent <strong>and</strong><br />
<strong>in</strong>dependent undergraduates. Race categories exclude persons of Hispanic ethnicity. Detail may not sum to totals because of round<strong>in</strong>g.<br />
SOURCE: U.S. Department of <strong>Education</strong>, National Center for <strong>Education</strong> Statistics, 2007–08 National Postsecondary Student Aid <strong>Study</strong> (NPSAS:08).<br />
6<br />
Postsecondary <strong>Education</strong><br />
35
Indicator 36<br />
Enrollment Intensity<br />
In 2007–08, a higher percentage of male than female undergraduates enrolled<br />
as full-time students (49 vs. 47 percent). The percentage of male undergraduates<br />
(35 percent) who enrolled as part-time students was not measurably different from<br />
that of females (36 percent).<br />
Dur<strong>in</strong>g the 2007–08 academic year, 48 percent of<br />
undergraduates were full-time students, 35 percent were<br />
part-time students, <strong>and</strong> 17 percent enrolled on a mixed<br />
full-time <strong>and</strong> part-time basis. The attendance patterns of<br />
undergraduates varied accord<strong>in</strong>g to students’ sex <strong>and</strong> race/<br />
ethnicity.<br />
In 2007–08, a higher percentage of males than females<br />
enrolled as full-time students (49 vs. 47 percent). The<br />
percentage of undergraduates who enrolled on a full-time<br />
basis was higher for White males than for White females<br />
(51 vs. 48 percent). With<strong>in</strong> other racial/ethnic groups,<br />
no measurable differences were observed between the<br />
percentages of males <strong>and</strong> females who enrolled on a fulltime<br />
basis.<br />
Lower percentages of Black (45 percent), Hispanic<br />
(45 percent), <strong>and</strong> Native Hawaiian/Pacific Isl<strong>and</strong>er<br />
(37 percent) undergraduates enrolled as full-time<br />
students than Asian (48 percent), White (49 percent),<br />
<strong>and</strong> undergraduates of two or more races (52 percent).<br />
In addition, the full-time percentage was higher for<br />
Hispanics <strong>and</strong> Blacks than for Native Hawaiians/Pacific<br />
Isl<strong>and</strong>ers. This overall pattern of full-time enrollment by<br />
race/ethnicity also was observed for male undergraduates.<br />
Among female undergraduates, lower percentages of<br />
Blacks <strong>and</strong> Hispanics (44 percent each) enrolled on a<br />
full-time basis than Whites (48 percent) <strong>and</strong> students of<br />
two or more races (51 percent).<br />
No measurable differences were found between the<br />
percentages of male (35 percent) <strong>and</strong> female (36 percent)<br />
undergraduates who enrolled on a part-time basis; nor<br />
were measurable differences observed between males <strong>and</strong><br />
females with<strong>in</strong> racial/ethnic groups.<br />
<strong>Higher</strong> percentages of Native Hawaiians/Pacific Isl<strong>and</strong>ers<br />
(40 percent), Blacks (38 percent), <strong>and</strong> Hispanics<br />
(37 percent) enrolled as part-time students than did<br />
Whites (34 percent), Asians (34 percent), <strong>and</strong> students<br />
of two or more races (31 percent). The same pattern<br />
of part-time enrollment was also observed for male<br />
undergraduates, with the exception that no measurable<br />
differences were observed between Native Hawaiian/<br />
Pacific Isl<strong>and</strong>er males <strong>and</strong> White or Asian males.<br />
Specifically, among male undergraduates, 39 percent of<br />
Blacks <strong>and</strong> 38 percent of Hispanics enrolled on a parttime<br />
basis, compared with 34 percent of Whites,<br />
Figure 36-1.<br />
Percentage of undergraduate students who always attended their undergraduate <strong>in</strong>stitutions full time, by<br />
race/ethnicity <strong>and</strong> sex: Academic year 2007–08<br />
Percent<br />
100<br />
80<br />
60<br />
40<br />
49 47<br />
51 48 46 44 45 44<br />
50<br />
46<br />
34<br />
40<br />
49<br />
43<br />
53 51<br />
20<br />
0<br />
Total 1 White Black Hispanic Asian Native<br />
Hawaiian/<br />
Pacific Isl<strong>and</strong>er<br />
Race/ethnicity<br />
American<br />
Indian/<br />
Alaska Native<br />
Two or more<br />
races<br />
Male<br />
Female<br />
1<br />
Total <strong>in</strong>cludes other racial/ethnic groups not shown separately <strong>in</strong> the figure.<br />
NOTE: Undergraduates <strong>in</strong> this <strong>in</strong>dicator are those enrolled <strong>in</strong> 4-year, 2-year, <strong>and</strong> less-than-2-year <strong>in</strong>stitutions <strong>in</strong> the 50 states, District of Columbia, <strong>and</strong> Puerto<br />
Rico. Full-time students refers to those who were enrolled full time dur<strong>in</strong>g the entire enrollment duration, which could be less than the full academic year (e.g.,<br />
just one term or semester). Race categories exclude persons of Hispanic ethnicity. Data weighted by WTA000.<br />
SOURCE: U.S. Department of <strong>Education</strong>, National Center for <strong>Education</strong> Statistics, 2007–08 National Postsecondary Student Aid <strong>Study</strong> (NPSAS:08).<br />
180 <strong>Higher</strong> <strong>Education</strong>: <strong>Gaps</strong> <strong>in</strong> <strong>Access</strong> <strong>and</strong> <strong>Persistence</strong> <strong>Study</strong>
Figure 36-2.<br />
Percent<br />
100<br />
Percentage of undergraduate students who always attended their undergraduate <strong>in</strong>stitutions part time,<br />
by race/ethnicity <strong>and</strong> sex: Academic year 2007–08<br />
36<br />
80<br />
60<br />
40<br />
35 36<br />
34<br />
35 39 38 38 37<br />
32<br />
35 40 41<br />
38 40<br />
29<br />
32<br />
20<br />
0<br />
Total 1 White Black Hispanic Asian Native<br />
Hawaiian/<br />
Pacific Isl<strong>and</strong>er<br />
American<br />
Indian/<br />
Alaska Native<br />
Two or more<br />
races<br />
Race/ethnicity<br />
Male<br />
Female<br />
1<br />
Total <strong>in</strong>cludes other racial/ethnic groups not shown separately <strong>in</strong> the figure.<br />
NOTE: Undergraduates <strong>in</strong> this <strong>in</strong>dicator are those enrolled <strong>in</strong> 4-year, 2-year, <strong>and</strong> less-than-2-year <strong>in</strong>stitutions <strong>in</strong> the 50 states, District of Columbia, <strong>and</strong> Puerto<br />
Rico. Part-time students refers to students who were enrolled part time dur<strong>in</strong>g the entire enrollment duration. Race categories exclude persons of Hispanic<br />
ethnicity. Data weighted by WTA000.<br />
SOURCE: U.S. Department of <strong>Education</strong>, National Center for <strong>Education</strong> Statistics, 2007–08 National Postsecondary Student Aid <strong>Study</strong> (NPSAS:08).<br />
32 percent of Asians, <strong>and</strong> 29 percent of students of<br />
two or more races. In addition, the percentages of male<br />
undergraduates who enrolled on a part-time basis were<br />
higher for Native Hawaiians/Pacific Isl<strong>and</strong>ers (40 percent)<br />
<strong>and</strong> Whites than for male students of two or more races.<br />
Among female undergraduates, a higher percentage of<br />
Blacks enrolled on a part-time basis (38 percent) than<br />
Whites (35 percent) <strong>and</strong> students of two or more races<br />
(32 percent); <strong>and</strong> a higher percentage of Hispanics<br />
enrolled part-time (37 percent) than students of two more<br />
races.<br />
Technical Notes<br />
Undergraduates <strong>in</strong> this <strong>in</strong>dicator are those enrolled <strong>in</strong><br />
4-year, 2-year, <strong>and</strong> less-than-2-year <strong>in</strong>stitutions <strong>in</strong> the 50<br />
states, District of Columbia, <strong>and</strong> Puerto Rico. Full-time<br />
students refers to those who enrolled full time dur<strong>in</strong>g their<br />
entire enrollment duration. The enrollment duration could<br />
be less than the full academic year (e.g., just one term or<br />
semester). Part-time students refers to students who always<br />
Both overall <strong>and</strong> by race/ethnicity, the percentages of<br />
undergraduates who enrolled as full-time students or<br />
part-time students did not measurably change from<br />
2003–04 to 2007–08. However, the percentage of male<br />
undergraduates enrolled on a full-time basis was higher<br />
<strong>in</strong> 2003–04 than <strong>in</strong> 2007–08 (52 vs. 49 percent); <strong>and</strong> the<br />
percentage of males enrolled as part-time students was<br />
lower <strong>in</strong> 2003–04 than <strong>in</strong> 2007–08 (33 vs. 35 percent).<br />
The percentages of female students who enrolled as either<br />
full-time or part-time students did not measurably change<br />
from 2003–04 to 2007–08.<br />
enrolled part time dur<strong>in</strong>g the entire enrollment duration.<br />
Mixed full-time <strong>and</strong> part-time enrollment <strong>in</strong>tensity <strong>in</strong>dicates<br />
a change <strong>in</strong> students’ enrollment status dur<strong>in</strong>g the<br />
enrollment duration, regardless of whether they started as<br />
part-time students <strong>and</strong> subsequently changed to full-time<br />
students or vice versa.<br />
Postsecondary <strong>Education</strong><br />
6<br />
Postsecondary <strong>Education</strong> 181
Table 36-1.<br />
Sex <strong>and</strong> race/ethnicity<br />
Sex<br />
Percentage distribution of undergraduate postsecondary students, by enrollment <strong>in</strong>tensity, sex, <strong>and</strong><br />
race/ethnicity: Academic years 2003–04 <strong>and</strong> 2007–08<br />
Always<br />
full-time<br />
2003–04 2007–08<br />
Mixed fulltime<br />
<strong>and</strong><br />
part-time<br />
Always<br />
part-time<br />
Always<br />
full-time<br />
Mixed fulltime<br />
<strong>and</strong><br />
part-time<br />
Always<br />
part-time<br />
Total 1 48.8 16.1 35.1 47.7 16.9 35.4<br />
Male 51.7 15.7 32.6 49.1 16.0 34.8<br />
Female 46.7 16.4 36.9 46.6 17.6 35.8<br />
Race/ethnicity<br />
White 50.5 15.7 33.8 49.1 16.5 34.4<br />
Black 47.3 15.6 37.1 44.6 17.1 38.4<br />
Hispanic 43.3 17.5 39.2 44.6 18.0 37.4<br />
Asian 48.4 19.0 32.6 47.8 18.6 33.5<br />
Native Hawaiian/Pacific Isl<strong>and</strong>er 39.3 16.8 44.0 37.4 22.2 40.4<br />
American Indian/Alaska Native 47.8 13.1 39.2 45.8 15.0 39.2<br />
Two or more races 48.6 16.4 35.0 51.6 17.5 30.8<br />
Race/ethnicity by sex<br />
Male<br />
White 53.4 15.1 31.5 50.6 15.7 33.7<br />
Black 50.8 14.8 34.4 45.8 15.5 38.7<br />
Hispanic 44.9 17.4 37.7 45.3 16.4 38.3<br />
Asian 50.6 19.2 30.3 49.8 18.3 32.0<br />
Native Hawaiian/<br />
Pacific Isl<strong>and</strong>er 39.8 21.3 38.9 34.2 26.2 39.6<br />
American Indian/Alaska Native 52.4 11.1 ! 36.5 49.0 13.2 37.8<br />
Two or more races 51.8 18.9 29.3 53.3 18.0 28.8<br />
Female<br />
White 48.2 16.1 35.6 47.9 17.1 35.0<br />
Black 45.3 16.1 38.6 43.9 18.0 38.2<br />
Hispanic 42.1 17.6 40.2 44.2 19.0 36.7<br />
Asian 46.4 18.9 34.7 46.2 19.0 34.8<br />
Native Hawaiian/<br />
Pacific Isl<strong>and</strong>er 38.9 13.0 48.1 40.0 19.0 41.0<br />
American Indian/Alaska Native 45.0 14.2 40.8 43.2 16.5 40.3<br />
Two or more races 46.3 14.6 39.1 50.5 17.3 32.2<br />
! Interpret data with caution. The coefficient of variation (CV) for this estimate is 30 percent or greater.<br />
1<br />
Total <strong>in</strong>cludes other racial/ethnic groups not shown separately <strong>in</strong> the table.<br />
NOTE: Undergraduates <strong>in</strong> this <strong>in</strong>dicator are those enrolled <strong>in</strong> 4-year, 2-year, <strong>and</strong> less-than-2-year <strong>in</strong>stitutions <strong>in</strong> the 50 states, District of Columbia, <strong>and</strong><br />
Puerto Rico. Always full-time students refers to those who were enrolled full time dur<strong>in</strong>g the entire enrollment duration, which could be less than the full<br />
academic year (e.g., just one term or semester). Always part-time students refers to students who were enrolled part time dur<strong>in</strong>g the entire enrollment<br />
duration. Mixed full-time <strong>and</strong> part-time enrollment <strong>in</strong>tensity <strong>in</strong>dicates a change <strong>in</strong> enrollment status dur<strong>in</strong>g the enrollment duration, regardless of<br />
whether they started as part-time students <strong>and</strong> subsequently changed to full-time students or vice versa. Race categories exclude persons of Hispanic<br />
ethnicity. Detail may not sum to totals because of round<strong>in</strong>g. Data weighted by WTA000.<br />
SOURCE: U.S. Department of <strong>Education</strong>, National Center for <strong>Education</strong> Statistics, 2003–04 <strong>and</strong> 2007–08 National Postsecondary Student Aid <strong>Study</strong><br />
(NPSAS:04 <strong>and</strong> NPSAS:08).<br />
182 <strong>Higher</strong> <strong>Education</strong>: <strong>Gaps</strong> <strong>in</strong> <strong>Access</strong> <strong>and</strong> <strong>Persistence</strong> <strong>Study</strong>
36<br />
This page <strong>in</strong>tentionally left blank.<br />
Postsecondary <strong>Education</strong><br />
6<br />
Postsecondary <strong>Education</strong> 183
Indicator 37<br />
<strong>Persistence</strong> <strong>and</strong> Atta<strong>in</strong>ment<br />
Of students beg<strong>in</strong>n<strong>in</strong>g postsecondary education <strong>in</strong> 2003–04, a lower percentage<br />
of males than females had obta<strong>in</strong>ed a degree by June 2009 (46 vs. 52 percent).<br />
A higher percentage of males than females had no degree <strong>and</strong> were no longer<br />
enrolled <strong>in</strong> a postsecondary <strong>in</strong>stitution (37 vs. 35 percent).<br />
Approximately 49 percent of 2003–04 beg<strong>in</strong>n<strong>in</strong>g<br />
postsecondary students had atta<strong>in</strong>ed some type of<br />
postsecondary degree (i.e., certificate, associate’s degree, or<br />
bachelor’s degree) by June 2009. About 31 percent of these<br />
students had atta<strong>in</strong>ed bachelor’s degrees, <strong>and</strong> 9 percent<br />
each had atta<strong>in</strong>ed either a certificate or an associate’s<br />
degree. Among the rema<strong>in</strong><strong>in</strong>g 51 percent who had not<br />
atta<strong>in</strong>ed a postsecondary degree as of June 2009, about<br />
15 percent were still enrolled <strong>in</strong> a postsecondary<br />
<strong>in</strong>stitution, <strong>and</strong> 36 percent were no longer enrolled.<br />
Overall, a lower percentage of 2003–04 beg<strong>in</strong>n<strong>in</strong>g<br />
postsecondary male students than female students<br />
had atta<strong>in</strong>ed some type of postsecondary degree (i.e.,<br />
certificate, associate’s, or bachelor’s) by June 2009 (46 vs.<br />
52 percent). Although this pattern was also observed for<br />
White males <strong>and</strong> females (51 vs. 57 percent) <strong>and</strong> Asian<br />
males <strong>and</strong> females (48 vs. 68 percent), no measurable<br />
differences by sex were found for other racial/ethnic<br />
groups. The overall percentages of males <strong>and</strong> females<br />
who had atta<strong>in</strong>ed bachelor’s degrees were similar;<br />
however, a lower percentage of Asian males than<br />
Asian females had atta<strong>in</strong>ed a bachelor’s degree by June<br />
2009 (39 vs. 53 percent). No other measurable differences<br />
were found between females <strong>and</strong> males across racial/<br />
ethnic groups <strong>in</strong> bachelor’s degree atta<strong>in</strong>ment.<br />
The percentages of students who had atta<strong>in</strong>ed a bachelor’s<br />
degree or who had atta<strong>in</strong>ed any postsecondary degree<br />
by June 2009 varied across racial/ethnic groups. The<br />
percentages of Black (17 percent), Hispanic (17 percent),<br />
<strong>and</strong> American Indian/Alaska Native students<br />
(14 percent) <strong>and</strong> students of two or more races<br />
(28 percent) who atta<strong>in</strong>ed bachelor’s degrees were lower<br />
than the percentages of White (36 percent) <strong>and</strong> Asian<br />
students (46 percent) who atta<strong>in</strong>ed a bachelor’s degree.<br />
The patterns of bachelor’s degree atta<strong>in</strong>ment that were<br />
observed among racial/ethnic groups were also observed<br />
among racial/ethnic groups <strong>in</strong> the atta<strong>in</strong>ment of any type<br />
of postsecondary degree (i.e., certificate, associate’s, or<br />
bachelor’s).<br />
Figure 37-1.<br />
Percentage of 2003–04 full-time, beg<strong>in</strong>n<strong>in</strong>g postsecondary students who first attended a 4-year <strong>in</strong>stitution<br />
<strong>and</strong> atta<strong>in</strong>ed a bachelor’s degree by June 2009, by race/ethnicity <strong>and</strong> sex: 2009<br />
Percent<br />
100<br />
84<br />
80<br />
60<br />
64<br />
72<br />
69<br />
77<br />
48<br />
53<br />
46<br />
56<br />
66<br />
63<br />
68<br />
40<br />
20<br />
0<br />
Total 1 White Black Hispanic Asian Two or more races<br />
Race/ethnicity<br />
Male<br />
Female<br />
1<br />
Total <strong>in</strong>cludes other racial/ethnic groups not shown separately <strong>in</strong> the figure.<br />
NOTE: Estimates <strong>in</strong>clude students enrolled <strong>in</strong> Title IV eligible postsecondary <strong>in</strong>stitutions <strong>in</strong> the 50 states, the District of Columbia, <strong>and</strong> Puerto Rico. Report<strong>in</strong>g<br />
st<strong>and</strong>ards for Native Hawaiians/Pacific Isl<strong>and</strong>ers <strong>and</strong> American Indians/Alaska Natives were not met; therefore, data for these groups are not shown <strong>in</strong> the<br />
figure. Data weighted by WTA000. Race categories exclude persons of Hispanic ethnicity.<br />
SOURCE: U.S. Department of <strong>Education</strong>, National Center for <strong>Education</strong> Statistics, 2003–04 Beg<strong>in</strong>n<strong>in</strong>g Postsecondary Students Longitud<strong>in</strong>al <strong>Study</strong>, Second<br />
Follow-up (BPS:04/06/09).<br />
184 <strong>Higher</strong> <strong>Education</strong>: <strong>Gaps</strong> <strong>in</strong> <strong>Access</strong> <strong>and</strong> <strong>Persistence</strong> <strong>Study</strong>
Among males, the percentages of Black (17 percent) <strong>and</strong><br />
Hispanic (16 percent) students who atta<strong>in</strong>ed bachelor’s<br />
degrees were lower than the percentages of White students<br />
(35 percent), Asian students (39 percent), <strong>and</strong> students of<br />
two or more races (27 percent) who atta<strong>in</strong>ed bachelor’s<br />
degrees. The percentages of American Indian/Alaska<br />
Native students (20 percent) <strong>and</strong> students of two or more<br />
races atta<strong>in</strong><strong>in</strong>g bachelor’s degrees were also lower than<br />
the percentage of Asian students atta<strong>in</strong><strong>in</strong>g bachelor’s<br />
degrees. In terms of overall degree atta<strong>in</strong>ment among<br />
males, the percentages of Black (35 percent) <strong>and</strong> Hispanic<br />
(38 percent) males atta<strong>in</strong><strong>in</strong>g any postsecondary degree<br />
were lower than the percentages of White (51 percent)<br />
<strong>and</strong> Asian (48 percent) males atta<strong>in</strong><strong>in</strong>g any postsecondary<br />
degree. The racial/ethnic patterns of differences <strong>in</strong><br />
the atta<strong>in</strong>ment of any postsecondary degree that were<br />
observed among males were also observed among females.<br />
Overall, the percentage of 2003–04 beg<strong>in</strong>n<strong>in</strong>g<br />
postsecondary male students who did not persist <strong>in</strong> their<br />
education (i.e., had no degree <strong>and</strong> were no longer enrolled<br />
<strong>in</strong> a postsecondary <strong>in</strong>stitution by June 2009) was higher<br />
than that of their female peers (37 vs. 35 percent). This<br />
pattern was also observed between White males <strong>and</strong><br />
White females. However, no measurable differences were<br />
observed between males <strong>and</strong> females of any other racial/<br />
ethnic group.<br />
The percentages of students who did not persist <strong>in</strong><br />
postsecondary education through June 2009 varied across<br />
racial/ethnic groups. Some 23 percent of Asian students<br />
did not persist <strong>in</strong> postsecondary education, which was<br />
lower than the percentages of nonpersist<strong>in</strong>g Black<br />
(43 percent), American Indian/Alaska Native (43 percent),<br />
Hispanic (42 percent), <strong>and</strong> White students (33 percent)<br />
<strong>and</strong> of nonpersist<strong>in</strong>g students of two or more races<br />
(34 percent). The percentages of White students <strong>and</strong><br />
students of two or more races who did not persist<br />
were also lower than the percentages of Black <strong>and</strong><br />
Hispanic students. No other measurable differences<br />
<strong>in</strong> the percentages of students who did not persist <strong>in</strong><br />
postsecondary education were observed across racial/<br />
ethnic groups.<br />
Among males, 24 percent of Asian students did not persist<br />
<strong>in</strong> postsecondary education, which was lower than the<br />
percentages of nonpersist<strong>in</strong>g males who were Black (45<br />
percent), Hispanic (44 percent), White (35 percent), <strong>and</strong><br />
of two or more races (41 percent). A lower percentage<br />
of White males than of Black <strong>and</strong> Hispanic males did<br />
not persist <strong>in</strong> postsecondary education. The overall male<br />
patterns of differences <strong>in</strong> postsecondary persistence among<br />
racial/ethnic groups were similar for females. In addition,<br />
the percentage of nonpersist<strong>in</strong>g females was lower for<br />
those of two or more races (29 percent) than for Black<br />
females (42 percent) <strong>and</strong> lower for Asian females<br />
(22 percent) than for American Indian/Alaska Native<br />
females (50 percent).<br />
For the subgroup of 2003–04 full-time beg<strong>in</strong>n<strong>in</strong>g<br />
postsecondary students who first attended a 4-year<br />
<strong>in</strong>stitution, a lower percentage of males than females<br />
had atta<strong>in</strong>ed a bachelor’s degree by June 2009 (64 vs. 72<br />
percent). Across racial/ethnic groups, the percentages of<br />
Black (51 percent) <strong>and</strong> Hispanic (52 percent) full-time<br />
students at 4-year <strong>in</strong>stitutions who atta<strong>in</strong>ed bachelor’s<br />
degrees were lower than the percentages of students of two<br />
or more races (66 percent), White students (73 percent),<br />
<strong>and</strong> Asian students (76 percent) who atta<strong>in</strong>ed bachelor’s<br />
degrees. The same patterns of atta<strong>in</strong>ment across race/<br />
ethnicity were observed among both males <strong>and</strong> females,<br />
with a few exceptions. The percentages of Black males <strong>and</strong><br />
males of two or more races atta<strong>in</strong><strong>in</strong>g bachelor’s degrees<br />
were not measurably different, <strong>and</strong> the percentages of<br />
Black <strong>and</strong> Hispanic females who atta<strong>in</strong>ed bachelor’s<br />
degrees were not measurably different from the percentage<br />
of females of two or more races who atta<strong>in</strong>ed bachelor’s<br />
degrees.<br />
37<br />
Postsecondary <strong>Education</strong><br />
6<br />
Technical Notes<br />
Estimates <strong>in</strong>clude students enrolled <strong>in</strong> Title IV eligible<br />
postsecondary <strong>in</strong>stitutions <strong>in</strong> the 50 states, the District of<br />
Columbia, <strong>and</strong> Puerto Rico.<br />
Postsecondary <strong>Education</strong> 185
Table 37-1.<br />
Sex <strong>and</strong> race/ethnicity<br />
Percentage distribution of persistence <strong>and</strong> atta<strong>in</strong>ment by June 2009 of 2003–04 beg<strong>in</strong>n<strong>in</strong>g postsecondary<br />
students by highest degree atta<strong>in</strong>ed, sex, <strong>and</strong> race/ethnicity: 2009<br />
Total<br />
No degree,<br />
not enrolled<br />
<strong>Persistence</strong> <strong>and</strong> atta<strong>in</strong>ment by June 2009<br />
No degree,<br />
still enrolled Total Certificate<br />
Highest degree atta<strong>in</strong>ed<br />
Associate’s<br />
degree<br />
Bachelor’s<br />
degree<br />
Total 1 100.0 35.6 15.0 49.3 9.4 9.3 30.6<br />
Sex<br />
Male 100.0 37.1 16.4 46.4 7.3 9.1 30.0<br />
Female 100.0 34.5 14.0 51.5 11.0 9.5 31.1<br />
Race/ethnicity<br />
White 100.0 33.4 12.7 54.0 7.7 10.1 36.2<br />
Black 100.0 42.7 20.4 36.8 12.4 7.7 16.7<br />
Hispanic 100.0 42.2 17.0 40.8 15.6 8.3 16.8<br />
Asian 100.0 23.1 18.9 57.9 4.5 7.7 45.7<br />
Native Hawaiian/<br />
Pacific Isl<strong>and</strong>er 100.0 29.8 ! ‡ 46.4 ! ‡ ‡ 38.8 !<br />
American Indian/<br />
Alaska Native 100.0 42.5 19.5 38.0 12.8 ! 10.8 ! 14.4<br />
Two or more races 100.0 33.7 19.4 46.9 9.2 9.9 27.8<br />
Race/ethnicity by sex<br />
Male<br />
White 100.0 35.3 14.1 50.6 6.1 9.5 35.0<br />
Black 100.0 44.5 20.2 35.3 9.4 9.3 16.6<br />
Hispanic 100.0 43.7 18.8 37.5 13.0 8.1 16.3<br />
Asian 100.0 24.2 27.5 48.3 3.3 ! 6.3 38.7<br />
Native Hawaiian/<br />
Pacific Isl<strong>and</strong>er 100.0 ‡ ‡ ‡ ‡ ‡ ‡<br />
American Indian/<br />
Alaska Native 100.0 31.6 ! ‡ 46.3 18.0 ! ‡ 20.2 !<br />
Two or more races 100.0 40.7 18.5 40.7 ‡ 10.1 ! 26.5<br />
Female<br />
White 100.0 31.9 11.5 56.6 9.0 10.5 37.1<br />
Black 100.0 41.7 20.5 37.7 14.1 6.8 16.8<br />
Hispanic 100.0 41.1 15.9 43.0 17.3 8.5 17.1<br />
Asian 100.0 22.1 10.1 67.9 5.7 9.3 52.9<br />
Native Hawaiian/<br />
Pacific Isl<strong>and</strong>er 100.0 ‡ ‡ ‡ ‡ ‡ ‡<br />
American Indian/<br />
Alaska Native 100.0 49.5 17.9 ! 32.7 9.4 ! ‡ 10.7 !<br />
Two or more races 100.0 28.9 20.0 51.1 12.6 9.8 28.7<br />
! Interpret data with caution. The coefficient of variation (CV) for this estimate is 30 percent or greater.<br />
‡ Report<strong>in</strong>g st<strong>and</strong>ards not met. Either there are too few cases or the coefficient of variation (CV) is 50 percent or greater.<br />
1<br />
Total <strong>in</strong>cludes other racial/ethnic groups not shown separately <strong>in</strong> the table.<br />
NOTE: Estimates <strong>in</strong>clude students enrolled <strong>in</strong> Title IV eligible postsecondary <strong>in</strong>stitutions <strong>in</strong> the 50 states, the District of Columbia, <strong>and</strong> Puerto Rico. Detail<br />
may not sum to totals because of round<strong>in</strong>g. Data weighted by WTA000. Race categories exclude persons of Hispanic ethnicity.<br />
SOURCE: U.S. Department of <strong>Education</strong>, National Center for <strong>Education</strong> Statistics, 2003–04 Beg<strong>in</strong>n<strong>in</strong>g Postsecondary Students Longitud<strong>in</strong>al <strong>Study</strong>,<br />
Second Follow-up (BPS:04/06/09).<br />
186 <strong>Higher</strong> <strong>Education</strong>: <strong>Gaps</strong> <strong>in</strong> <strong>Access</strong> <strong>and</strong> <strong>Persistence</strong> <strong>Study</strong>
Table 37-2.<br />
Sex <strong>and</strong> race/ethnicity<br />
Percentage of 2003–04 full-time, beg<strong>in</strong>n<strong>in</strong>g postsecondary students who first attended a 4-year <strong>in</strong>stitution<br />
<strong>and</strong> percentage distribution of their persistence <strong>and</strong> atta<strong>in</strong>ment status by June 2009, by sex <strong>and</strong> race/<br />
ethnicity: 2009<br />
<strong>Persistence</strong> <strong>and</strong> atta<strong>in</strong>ment by 2009<br />
Highest degree atta<strong>in</strong>ed<br />
Total<br />
No degree,<br />
not enrolled<br />
No degree,<br />
still enrolled Total Certificate<br />
Associate’s<br />
degree<br />
Bachelor’s<br />
degree<br />
Total 1 100.0 19.7 6.7 73.7 1.1 3.9 68.7<br />
Sex<br />
Male 100.0 21.9 8.1 69.9 0.7 ! 4.9 64.3<br />
Female 100.0 17.9 5.5 76.6 1.4 3.1 72.1<br />
37<br />
Race/ethnicity<br />
White 100.0 17.0 4.8 78.2 1.0 4.1 73.1<br />
Black 100.0 31.0 12.5 56.5 2.3 ! 3.3 ! 50.9<br />
Hispanic 100.0 30.2 12.6 57.2 1.4 ! 4.1 ! 51.7<br />
Asian 100.0 12.8 9.1 78.1 # 2.3 ! 75.8<br />
Native Hawaiian/<br />
Pacific Isl<strong>and</strong>er 100.0 ‡ ‡ ‡ ‡ ‡ ‡<br />
American Indian/<br />
Alaska Native 100.0 ‡ ‡ ‡ ‡ ‡ ‡<br />
Two or more races 100.0 20.9 8.1 ! 79.2 ‡ ‡ 65.6<br />
Race/ethnicity by sex<br />
Male<br />
White 100.0 19.8 5.8 74.4 0.5 ! 5.1 68.8<br />
Black 100.0 33.9 14.2 51.9 ‡ 3.7 ! 47.7<br />
Hispanic 100.0 31.8 16.1 52.2 ‡ 4.5 ! 45.6<br />
Asian 100.0 16.2 13.6 70.2 # 4.5 ! 65.7<br />
Native Hawaiian/<br />
Pacific Isl<strong>and</strong>er 100.0 ‡ ‡ ‡ ‡ ‡ ‡<br />
American Indian/<br />
Alaska Native 100.0 ‡ ‡ ‡ ‡ ‡ ‡<br />
Two or more races 100.0 18.1 ! 9.6 ! 72.3 ‡ ‡ 62.8<br />
Female<br />
White 100.0 14.8 4.0 81.2 1.3 ! 3.3 76.6<br />
Black 100.0 29.2 11.4 59.4 3.4 ! 3.0 ! 53.0<br />
Hispanic 100.0 29.1 10.1 60.8 1.0 ! ‡ 56.1<br />
Asian 100.0 9.8 ! 5.2 ! 84.9 # ‡ 84.4<br />
Native Hawaiian/<br />
Pacific Isl<strong>and</strong>er 100.0 ‡ ‡ ‡ ‡ ‡ ‡<br />
American Indian/<br />
Alaska Native 100.0 ‡ ‡ ‡ ‡ ‡ ‡<br />
Two or more races 100.0 23.0 ! 7.0 ! 70.0 ‡ ‡ 67.5<br />
# Rounds to zero.<br />
! Interpret data with caution. The coefficient of variation (CV) for this estimate is 30 percent or greater.<br />
‡ Report<strong>in</strong>g st<strong>and</strong>ards not met. Either there are too few cases or the coefficient of variation (CV) is 50 percent or greater.<br />
1<br />
Total <strong>in</strong>cludes other racial/ethnic groups not shown separately <strong>in</strong> the table.<br />
NOTE: Estimates <strong>in</strong>clude students enrolled <strong>in</strong> Title IV eligible postsecondary <strong>in</strong>stitutions <strong>in</strong> the 50 states, the District of Columbia, <strong>and</strong> Puerto Rico. Detail<br />
may not sum to totals because of round<strong>in</strong>g. Data weighted by WTA000. Race categories exclude persons of Hispanic ethnicity.<br />
SOURCE: U.S. Department of <strong>Education</strong>, National Center for <strong>Education</strong> Statistics, 2003–04 Beg<strong>in</strong>n<strong>in</strong>g Postsecondary Students Longitud<strong>in</strong>al <strong>Study</strong>,<br />
Second Follow-up (BPS:04/06/09).<br />
Postsecondary <strong>Education</strong><br />
6<br />
Postsecondary <strong>Education</strong> 187
Indicator 38<br />
Reasons for Leav<strong>in</strong>g<br />
A higher percentage of 2003–04 beg<strong>in</strong>n<strong>in</strong>g postsecondary male students than<br />
female students left college by 2004 without complet<strong>in</strong>g a degree or certificate<br />
program (17 vs.15 percent). Among students who left without complet<strong>in</strong>g, a higher<br />
percentage of males than females reported f<strong>in</strong>ancial reasons for leav<strong>in</strong>g (40 vs. 23<br />
percent).<br />
About 16 percent of students who began at a postsecondary<br />
<strong>in</strong>stitution <strong>in</strong> 2003–04 had left college by<br />
2004 without complet<strong>in</strong>g a degree or certificate program.<br />
A higher percentage of male than female students left<br />
college without complet<strong>in</strong>g (17 vs. 15 percent). The same<br />
pattern was observed between White males <strong>and</strong> White<br />
females (17 vs. 14 percent); however, no measurable<br />
differences were found between males <strong>and</strong> females with<strong>in</strong><br />
other racial/ethnic groups.<br />
The percentage of 2003–04 beg<strong>in</strong>n<strong>in</strong>g postsecondary<br />
students who left college by 2004 without complet<strong>in</strong>g a<br />
degree or certificate program varied by race/ethnicity. A<br />
lower percentage of White students left college without<br />
complet<strong>in</strong>g a degree or certificate program (15 percent)<br />
than did Hispanic (18 percent) <strong>and</strong> Black students (20<br />
percent). In addition, the percentage of Asian students<br />
who left college without complet<strong>in</strong>g (10 percent) was<br />
lower than the percentages of students of two or more<br />
races (16 percent), White, Hispanic, <strong>and</strong> Black students.<br />
Among male 2003–04 beg<strong>in</strong>n<strong>in</strong>g postsecondary students,<br />
a lower percentage of White students than Black students<br />
left by 2004 without complet<strong>in</strong>g (17 vs. 22 percent);<br />
<strong>and</strong> the percentage of Asian students who left without<br />
complet<strong>in</strong>g (9 percent) was lower than the percentages of<br />
White students, Hispanic students (19 percent), students<br />
of two or more races (20 percent), <strong>and</strong> Black students.<br />
Among females, a lower percentage of White students (14<br />
percent) than Hispanic students (17 percent) <strong>and</strong> Black<br />
students (20 percent) left without complet<strong>in</strong>g; <strong>and</strong> the<br />
percentage of Asian students who left without complet<strong>in</strong>g<br />
(12 percent) was lower than the correspond<strong>in</strong>g percentage<br />
of Black students.<br />
Among 2003–04 beg<strong>in</strong>n<strong>in</strong>g postsecondary students who<br />
left <strong>in</strong> 2004 without complet<strong>in</strong>g a degree or certificate<br />
program, 31 percent reported that they left their<br />
<strong>in</strong>stitution due to f<strong>in</strong>ancial reasons. A higher percentage<br />
of males than females reported f<strong>in</strong>ancial reasons for<br />
leav<strong>in</strong>g (40 vs. 23 percent). In addition, the percentage<br />
differences between males <strong>and</strong> females who left due<br />
to f<strong>in</strong>ancial reasons followed a similar pattern with<strong>in</strong><br />
the racial/ethnic groups of White students, Hispanic<br />
students, <strong>and</strong> students of two or more races. For example,<br />
Figure 38-1.<br />
Percentage of 2003–04 beg<strong>in</strong>n<strong>in</strong>g postsecondary students who left school by 2004 without complet<strong>in</strong>g a<br />
program, by race/ethnicity <strong>and</strong> sex: 2004<br />
Percent<br />
60<br />
50<br />
40<br />
30<br />
20<br />
10<br />
17<br />
15<br />
17<br />
14<br />
22<br />
20 19 17<br />
9<br />
12<br />
17!<br />
15!<br />
20<br />
14<br />
0<br />
Total 1 White Black Hispanic Asian American Indian/ Two or more<br />
Alaska Native races<br />
Race/ethnicity<br />
Male<br />
Female<br />
! Interpret data with caution. The coefficient of variation (CV) for this estimate is 30 percent or greater.<br />
1<br />
Total <strong>in</strong>cludes other racial/ethnic groups not shown separately <strong>in</strong> the figure.<br />
NOTE: Report<strong>in</strong>g st<strong>and</strong>ards for Native Hawaiians/Pacific Isl<strong>and</strong>ers were not met; therefore, data for this group are not shown <strong>in</strong> the figure. Race categories<br />
exclude persons of Hispanic ethnicity. Data weighted by WTA000.<br />
SOURCE: U.S. Department of <strong>Education</strong>, National Center for <strong>Education</strong> Statistics, 2003–04 Beg<strong>in</strong>n<strong>in</strong>g Postsecondary Students Longitud<strong>in</strong>al <strong>Study</strong>, First Follow-up<br />
(BPS:04/06).<br />
188 <strong>Higher</strong> <strong>Education</strong>: <strong>Gaps</strong> <strong>in</strong> <strong>Access</strong> <strong>and</strong> <strong>Persistence</strong> <strong>Study</strong>
Figure 38-2.<br />
Percent<br />
60<br />
Percentage of 2003–04 beg<strong>in</strong>n<strong>in</strong>g postsecondary students who left school by 2004 without complet<strong>in</strong>g a<br />
program <strong>and</strong> reported f<strong>in</strong>ancial reasons for leav<strong>in</strong>g, by race/ethnicity <strong>and</strong> sex: 2004<br />
59<br />
56<br />
38<br />
50<br />
40<br />
40<br />
36<br />
33<br />
30<br />
20<br />
23<br />
26<br />
26<br />
18<br />
16!<br />
10<br />
0<br />
Total 1 White Black Hispanic Two or more races<br />
Race/ethnicity<br />
Male<br />
Female<br />
! Interpret data with caution. The coefficient of variation (CV) for this estimate is 30 percent or greater..<br />
1<br />
Total <strong>in</strong>cludes other racial/ethnic groups not shown separately <strong>in</strong> the figure.<br />
NOTE: Report<strong>in</strong>g st<strong>and</strong>ards for Asians, Native Hawaiians/Pacific Isl<strong>and</strong>ers, <strong>and</strong> American Indians/Alaska Natives were not met; therefore, data for these groups<br />
are not shown <strong>in</strong> the figure. Race categories exclude persons of Hispanic ethnicity. Data weighted by WTA000.<br />
SOURCE: U.S. Department of <strong>Education</strong>, National Center for <strong>Education</strong> Statistics, 2003–04 Beg<strong>in</strong>n<strong>in</strong>g Postsecondary Students Longitud<strong>in</strong>al <strong>Study</strong>, First Follow-up<br />
(BPS:04/06).<br />
approximately 59 percent of Hispanic males reported<br />
f<strong>in</strong>ancial reasons for leav<strong>in</strong>g, compared with 18 percent of<br />
Hispanic females.<br />
A lower percentage of Asian students (19 percent) than<br />
Hispanic students (35 percent) <strong>and</strong> students of two or<br />
more races (38 percent) reported leav<strong>in</strong>g for f<strong>in</strong>ancial<br />
Technical Notes<br />
This <strong>in</strong>dicator uses a specific variable from the 2003–04<br />
Beg<strong>in</strong>n<strong>in</strong>g Postsecondary Students Longitud<strong>in</strong>al <strong>Study</strong>,<br />
First Follow-up (BPS:04/06) that <strong>in</strong>dicates a student’s<br />
enrollment or departure status at the end of the first year<br />
reasons. Among male students, the percentages of<br />
Blacks (33 percent) <strong>and</strong> Whites (36 percent) who<br />
reported f<strong>in</strong>ancial reasons for leav<strong>in</strong>g were lower than<br />
the correspond<strong>in</strong>g percentages of students of two or<br />
more races (56 percent) <strong>and</strong> Hispanics (59 percent). No<br />
measurable differences were found by race/ethnicity<br />
among female students.<br />
of enrollment (i.e., 2004). Therefore, this <strong>in</strong>dicator does<br />
not capture the enrollment or departure status of students<br />
who left after their first year.<br />
Postsecondary <strong>Education</strong><br />
6<br />
Postsecondary <strong>Education</strong> 189
190 <strong>Higher</strong> <strong>Education</strong>: <strong>Gaps</strong> <strong>in</strong> <strong>Access</strong> <strong>and</strong> <strong>Persistence</strong> <strong>Study</strong><br />
Table 38-1.<br />
Sex <strong>and</strong> race/ethnicity<br />
Sex<br />
Percentage of 2003–04 beg<strong>in</strong>n<strong>in</strong>g postsecondary students who left school by 2004 without complet<strong>in</strong>g a program <strong>and</strong> the reported reasons for leav<strong>in</strong>g, by<br />
sex <strong>and</strong> race/ethnicity: 2004<br />
Percentage<br />
who left<br />
<strong>in</strong> 2004<br />
Academic<br />
problems<br />
Schedul<strong>in</strong>g<br />
problems<br />
Not satisfied<br />
Reasons for leav<strong>in</strong>g without complet<strong>in</strong>g<br />
F<strong>in</strong>ancial<br />
reasons<br />
Family<br />
responsibilities<br />
Personal<br />
reasons<br />
F<strong>in</strong>ished<br />
classes<br />
Other reason<br />
Total 1 16.0 13.0 8.0 16.7 30.8 21.0 53.4 3.6 24.0<br />
Male 17.3 9.7 8.9 18.1 40.0 21.4 42.7 1.6 ! 29.9<br />
Female 15.1 15.9 7.2 15.6 22.8 20.8 62.6 5.3 19.0<br />
Race/ethnicity<br />
White 15.0 11.2 11.0 15.4 30.7 19.3 52.2 4.3 24.2<br />
Black 20.5 10.3 3.7 ! 19.8 28.7 24.7 46.0 2.8 31.2<br />
Hispanic 18.0 26.0 6.0 23.9 35.2 19.1 53.9 2.8 12.6<br />
Asian 10.4 ‡ ‡ 5.0 ! 18.6 ! 28.9 ! 89.4 ‡ 26.2<br />
Native Hawaiian/Pacific Isl<strong>and</strong>er 22.7 ! ‡ ‡ ‡ ‡ ‡ ‡ ‡ ‡<br />
American Indian/Alaska Native 15.6 ! ‡ ‡ ‡ ‡ ‡ ‡ ‡ ‡<br />
Two or more races 16.4 ‡ # ‡ 37.7 30.2 63.3 # 34.8<br />
Race/ethnicity by sex<br />
Male<br />
White 16.8 10.9 13.9 17.5 36.0 18.8 43.5 2.1 ! 32.0<br />
Black 21.7 7.0 ! ‡ 24.6 33.1 35.6 28.2 # 39.1<br />
Hispanic 19.5 11.7 ! ‡ 22.4 59.2 16.8 39.6 # 12.1<br />
Asian 8.9 ‡ # ‡ 38.0 ‡ 87.1 ‡ 25.7 !<br />
Native Hawaiian/Pacific Isl<strong>and</strong>er ‡ ‡ ‡ ‡ ‡ ‡ ‡ ‡ ‡<br />
American Indian/Alaska Native 17.2 ! ‡ ‡ ‡ ‡ ‡ ‡ ‡ ‡<br />
Two or more races 20.2 # # ‡ 56.4 22.3 ! 60.4 # 34.4<br />
Female<br />
White 13.6 11.5 8.2 13.5 25.5 19.7 60.7 6.4 16.7<br />
Black 19.7 12.5 5.7 ! 16.5 25.7 17.3 58.1 4.7 25.9<br />
Hispanic 17.1 36.6 8.9 25.0 17.6 20.8 64.4 4.9 12.9<br />
Asian 11.8 ‡ ‡ ‡ ‡ 33.4 ! 91.0 ‡ 26.6 !<br />
Native Hawaiian/Pacific Isl<strong>and</strong>er ‡ ‡ ‡ ‡ ‡ ‡ ‡ ‡ ‡<br />
American Indian/Alaska Native 14.5 ! ‡ ‡ ‡ ‡ ‡ ‡ ‡ ‡<br />
Two or more races 13.5 ‡ # ‡ 16.2 ! 39.3 ! 66.6 # 35.4 !<br />
# Rounds to zero.<br />
! Interpret data with caution. The coefficient of variation (CV) for this estimate is 30 percent or greater.<br />
‡ Report<strong>in</strong>g st<strong>and</strong>ards not met. Either there are too few cases or the coefficient of variation (CV) is 50 percent or greater.<br />
1<br />
Total <strong>in</strong>cludes other racial/ethnic groups not shown separately <strong>in</strong> the table.<br />
NOTE: Respondents were able to choose more than one reason for leav<strong>in</strong>g school. Race categories exclude persons of Hispanic ethnicity. Data weighted by WTA000.<br />
SOURCE: U.S. Department of <strong>Education</strong>, National Center for <strong>Education</strong> Statistics, 2003–04 Beg<strong>in</strong>n<strong>in</strong>g Postsecondary Students Longitud<strong>in</strong>al <strong>Study</strong>, First Follow-up (BPS:04/06).
38<br />
This page <strong>in</strong>tentionally left blank.<br />
Postsecondary <strong>Education</strong><br />
6<br />
Postsecondary <strong>Education</strong> 191
Indicator 39<br />
Remedial Coursework <strong>and</strong> Other Academic<br />
Experiences<br />
As of 2006, higher percentages of male than female 2003–04 first-year<br />
undergraduates reported that they had received an <strong>in</strong>complete (17 vs.15 percent),<br />
repeated a course for a higher grade (25 vs. 22 percent), or withdrawn from a<br />
course after the add/drop deadl<strong>in</strong>e (33 vs. 29 percent). However, the percentage<br />
of male students (30 percent) who had ever changed their major was not<br />
measurably different from that of female students (32 percent).<br />
In 2007–08, some 36 percent of first-year undergraduates<br />
<strong>in</strong> all postsecondary <strong>in</strong>stitutions reported that they<br />
had taken a remedial course. Specifically, 29 percent<br />
of students at 4-year <strong>in</strong>stitutions had taken a remedial<br />
course, as had 41 percent at 2-year <strong>in</strong>stitutions <strong>and</strong> 28<br />
percent at less-than-2-year <strong>in</strong>stitutions.<br />
Overall, the percentage of first-year undergraduates who<br />
had taken a remedial course varied by sex. In 2007–08,<br />
a lower percentage of male than female first-year<br />
undergraduates had taken a remedial course (33 vs. 39<br />
percent). The pattern of lower percentages of males than<br />
females tak<strong>in</strong>g remedial courses was observed for White,<br />
Hispanic, <strong>and</strong> American Indian/Alaska Native students,<br />
as well as students of two or more races. For example,<br />
approximately 40 percent of male Hispanic students had<br />
taken a remedial course, compared with 46 percent of<br />
female Hispanic students.<br />
In 2007–08, the percentage of White first-year students<br />
(31 percent) who had ever taken a remedial course was<br />
significantly lower than the percentages of students of<br />
other racial/ethnic groups who had done so, except for<br />
students of two or more races. The percentages of students<br />
of two or more races (33 percent) <strong>and</strong> Asians (38 percent)<br />
who had ever taken a remedial course were lower than<br />
the percentages of Hispanics (43 percent) <strong>and</strong> Blacks (45<br />
percent) who had taken one.<br />
This <strong>in</strong>dicator also exam<strong>in</strong>es academic experiences of<br />
students from their first 2 or 3 years as undergraduates.<br />
In 2006, students <strong>in</strong> their third or fourth year of<br />
undergraduate education were asked whether they had<br />
ever changed majors, received a grade of <strong>in</strong>complete,<br />
repeated a course for a higher grade, or withdrawn from<br />
a course after their <strong>in</strong>stitutions’ add/drop deadl<strong>in</strong>e. Some<br />
16 percent reported that they had received a grade of<br />
<strong>in</strong>complete, 23 percent reported that they had repeated a<br />
Figure 39-1.<br />
Percentage of first-year undergraduates who reported ever tak<strong>in</strong>g a remedial course, by race/ethnicity<br />
<strong>and</strong> sex: Academic year 2007–08<br />
Percent<br />
100<br />
80<br />
60<br />
61<br />
40<br />
33<br />
39<br />
28<br />
34<br />
45 45<br />
40<br />
46<br />
35<br />
41<br />
36<br />
44<br />
33<br />
27<br />
37<br />
20<br />
0<br />
Total 1 White Black Hispanic Asian Native<br />
Hawaiian/<br />
Pacific Isl<strong>and</strong>er<br />
Race/ethnicity<br />
American<br />
Indian/Alaska<br />
Native<br />
Two or more<br />
races<br />
Male<br />
Female<br />
1<br />
Total <strong>in</strong>cludes other racial/ethnic groups not shown separately <strong>in</strong> the figure.<br />
NOTE: Race categories exclude persons of Hispanic ethnicity. Data weighted by WTA000.<br />
SOURCE: U.S. Department of <strong>Education</strong>, National Center for <strong>Education</strong> Statistics, 2007–08 National Postsecondary Student Aid <strong>Study</strong> (NPSAS:08).<br />
192 <strong>Higher</strong> <strong>Education</strong>: <strong>Gaps</strong> <strong>in</strong> <strong>Access</strong> <strong>and</strong> <strong>Persistence</strong> <strong>Study</strong>
Figure 39-2.<br />
Percentage of 2003–04 beg<strong>in</strong>n<strong>in</strong>g postsecondary undergraduates who reported ever receiv<strong>in</strong>g an<br />
<strong>in</strong>complete <strong>and</strong> ever withdraw<strong>in</strong>g after the add/drop deadl<strong>in</strong>e, by race/ethnicity <strong>and</strong> sex: 2006<br />
39<br />
Percent Ever received an <strong>in</strong>complete 1 Ever withdrew after add/drop deadl<strong>in</strong>e 2<br />
100<br />
80<br />
60<br />
40<br />
20<br />
17<br />
15<br />
16<br />
13<br />
20 18<br />
22 20<br />
16<br />
13<br />
24 23<br />
33 29<br />
33 29 29 29<br />
36<br />
30<br />
34 32<br />
42<br />
26<br />
45<br />
33<br />
0<br />
Total 3 White Black Hispanic Asian Two or<br />
more<br />
races<br />
Total 3<br />
White Black Hispanic Asian American<br />
Indian/<br />
Alaska<br />
Native<br />
Two or<br />
more<br />
races<br />
Race/ethnicity<br />
Male<br />
1<br />
Report<strong>in</strong>g st<strong>and</strong>ards for Native Hawaiian/Pacific Isl<strong>and</strong>er males <strong>and</strong> females <strong>and</strong> American Indian/Alaska Native males were not met; therefore, data for<br />
Native Hawaiians/Pacific Isl<strong>and</strong>ers <strong>and</strong> American Indians/Alaska Natives are not shown <strong>in</strong> the figure.<br />
2<br />
Report<strong>in</strong>g st<strong>and</strong>ards for Native Hawaiians/Pacific Isl<strong>and</strong>ers were not met; therefore, data for this group are not shown <strong>in</strong> the figure.<br />
3<br />
Total <strong>in</strong>cludes other racial/ethnic groups not shown separately <strong>in</strong> the figure.<br />
Note: Academic experiences of students are from their first 2 or 3 years as undergraduates. Race categories exclude persons of Hispanic ethnicity. Data<br />
weighted by WTA000.<br />
SOURCE: U.S. Department of <strong>Education</strong>, National Center for <strong>Education</strong> Statistics, 2003–04 Beg<strong>in</strong>n<strong>in</strong>g Postsecondary Students Longitud<strong>in</strong>al <strong>Study</strong>, First Follow-up<br />
(BPS:04/06).<br />
course for a higher grade, 31 percent reported that they<br />
had changed their major, <strong>and</strong> 31 percent reported that<br />
they had withdrawn from a course after the <strong>in</strong>stitutions’<br />
add/drop deadl<strong>in</strong>e.<br />
<strong>Higher</strong> percentages of males than females had ever<br />
received a grade of <strong>in</strong>complete (17 vs.15 percent), had ever<br />
repeated a course for a higher grade (25 vs. 22 percent),<br />
or had ever withdrawn after the add/drop deadl<strong>in</strong>e (33 vs.<br />
29 percent). This pattern was also observed among White<br />
students. No measurable differences between males <strong>and</strong><br />
females with<strong>in</strong> other racial/ethnic groups were observed<br />
<strong>in</strong> terms of the percentages of students who reported these<br />
three academic experiences. In addition, the percentage<br />
of males (30 percent) who had ever changed their major<br />
was not measurably different from the percentage of<br />
females (32 percent) who had done so; nor were there any<br />
Female<br />
measurable differences with<strong>in</strong> each racial/ethnic group<br />
between males <strong>and</strong> females who had ever changed their<br />
major.<br />
The academic experiences of 2003–04 beg<strong>in</strong>n<strong>in</strong>g<br />
postsecondary undergraduates varied by race/<br />
ethnicity. Specifically, lower percentages of Black <strong>and</strong><br />
Hispanic undergraduates (29 percent each) than White<br />
undergraduates (32 percent) had changed their major.<br />
<strong>Higher</strong> percentages of Hispanic (21 percent) <strong>and</strong> Black<br />
students (19 percent) than Asian (15 percent) <strong>and</strong> White<br />
students (14 percent) had received an <strong>in</strong>complete.<br />
Compared with White students (20 percent), higher<br />
percentages of Black (30 percent), Asian (30 percent), <strong>and</strong><br />
Hispanic students (27 percent) had repeated a course for a<br />
higher grade.<br />
Postsecondary <strong>Education</strong><br />
6<br />
Postsecondary <strong>Education</strong> 193
Table 39-1.<br />
Sex <strong>and</strong> race/ethnicity<br />
Sex<br />
Percentage of first-year undergraduates who reported ever tak<strong>in</strong>g a remedial course, by level of <strong>in</strong>stitution,<br />
sex, <strong>and</strong> race/ethnicity: Academic years 2003–04 <strong>and</strong> 2007–08<br />
All<br />
<strong>in</strong>stitutions 4-year 2-year<br />
2003–04 2007–08<br />
Less-than-<br />
2-year<br />
All<br />
<strong>in</strong>stitutions 4-year 2-year<br />
Less-than-<br />
2-year<br />
Total 1 34.7 27.1 39.9 25.2 36.2 28.8 40.9 27.8<br />
Male 32.9 24.3 38.4 24.5 32.8 24.1 37.4 31.1<br />
Female 36.0 29.4 41.1 25.4 38.8 32.4 43.6 26.6<br />
Race/ethnicity<br />
White 31.7 25.0 36.2 25.5 31.3 24.2 35.8 24.0<br />
Black 41.2 36.3 46.0 23.8 45.1 38.1 50.2 31.4<br />
Hispanic 37.5 27.9 44.6 25.4 43.3 38.4 48.6 29.5<br />
Asian 39.6 28.8 46.5 32.7 38.0 27.9 42.8 36.5<br />
Native Hawaiian/<br />
Pacific Isl<strong>and</strong>er 40.8 37.0 44.0 29.3 40.0 20.8 ! 44.9 30.4<br />
American Indian/<br />
Alaska Native 44.8 25.6 54.6 20.3 46.8 35.6 53.2 33.4<br />
Two or more races 33.9 26.0 40.3 22.6 32.8 27.3 36.8 17.5<br />
Race/ethnicity by sex<br />
Male<br />
White 30.2 22.3 35.3 25.7 28.2 20.2 32.7 24.6<br />
Black 39.8 33.0 44.8 19.9 44.9 36.5 49.7 34.5<br />
Hispanic 36.5 26.2 43.5 23.7 39.9 31.6 44.9 33.7<br />
Asian 36.0 28.3 40.1 44.0 35.2 21.9 40.9 36.1<br />
Native Hawaiian/<br />
Pacific Isl<strong>and</strong>er 40.4 ‡ 47.6 ‡ 35.8 ‡ 40.9 ‡<br />
American Indian/<br />
Alaska Native 33.3 24.0 40.2 ‡ 32.5 28.3 34.0 ‡<br />
Two or more races 30.5 17.7 38.8 23.3 26.5 19.0 30.8 ‡<br />
Female<br />
White 32.9 27.3 36.9 25.3 34.0 27.6 38.6 23.8<br />
Black 42.0 38.5 46.7 25.0 45.3 39.0 50.5 30.2<br />
Hispanic 38.2 29.3 45.5 26.1 45.6 42.8 51.2 27.4<br />
Asian 42.6 29.2 51.6 27.4 40.7 33.1 44.8 36.7<br />
Native Hawaiian/<br />
Pacific Isl<strong>and</strong>er 41.0 ‡ 41.2 ‡ 43.9 ‡ 48.6 ‡<br />
American Indian/<br />
Alaska Native 50.8 26.7 ! 61.3 25.7 61.0 44.6 71.6 27.1 !<br />
Two or more races 36.4 31.9 41.5 22.4 37.1 33.0 41.3 16.9<br />
! Interpret data with caution. The coefficient of variation (CV) for this estimate is 30 percent or greater.<br />
‡ Report<strong>in</strong>g st<strong>and</strong>ards not met. Either there are too few cases or the coefficient of variation (CV) is 50 percent or greater.<br />
1<br />
Total <strong>in</strong>cludes other racial/ethnic groups not shown separately <strong>in</strong> the table.<br />
NOTE: Race categories exclude persons of Hispanic ethnicity. Data weighted by WTA000.<br />
SOURCE: U.S. Department of <strong>Education</strong>, National Center for <strong>Education</strong> Statistics, 2003–04 <strong>and</strong> 2007–08 National Postsecondary Student Aid <strong>Study</strong><br />
(NPSAS:04 <strong>and</strong> NPSAS:08).<br />
194 <strong>Higher</strong> <strong>Education</strong>: <strong>Gaps</strong> <strong>in</strong> <strong>Access</strong> <strong>and</strong> <strong>Persistence</strong> <strong>Study</strong>
Table 39-2.<br />
Sex <strong>and</strong> race/ethnicity<br />
Sex<br />
Percentage of 2003–04 beg<strong>in</strong>n<strong>in</strong>g postsecondary undergraduates who reported various academic<br />
experiences, by sex <strong>and</strong> race/ethnicity: 2006<br />
Ever changed<br />
major<br />
Ever received an<br />
<strong>in</strong>complete<br />
Ever repeated<br />
a course for a<br />
higher grade<br />
Ever withdrew<br />
after add/drop<br />
deadl<strong>in</strong>e<br />
Total 1 31.2 16.1 23.0 31.0<br />
Male 30.4 17.3 25.0 33.2<br />
Female 31.7 15.2 21.5 29.4<br />
39<br />
Race/ethnicity<br />
White 32.5 14.2 20.1 30.7<br />
Black 28.6 19.1 29.6 28.9<br />
Hispanic 28.6 20.5 26.7 32.3<br />
Asian 28.1 14.8 29.8 32.6<br />
Native Hawaiian/Pacific Isl<strong>and</strong>er ‡ 16.8 ! 23.7 ! 17.2 !<br />
American Indian/Alaska Native 27.7 15.7 ! ‡ 31.8<br />
Two or more races 29.2 23.7 23.4 37.9<br />
Race/ethnicity by sex<br />
Male<br />
White 31.3 15.6 23.2 32.8<br />
Black 29.1 20.2 28.0 29.3<br />
Hispanic 28.0 22.0 29.0 36.2<br />
Asian 28.2 16.3 32.0 33.7<br />
Native Hawaiian/Pacific Isl<strong>and</strong>er ‡ ‡ ‡ ‡<br />
American Indian/Alaska Native 38.1 ! ‡ ‡ 41.6 !<br />
Two or more races 24.4 24.0 ! 17.1 44.8<br />
Female<br />
White 33.3 13.1 17.8 29.1<br />
Black 28.3 18.5 30.5 28.6<br />
Hispanic 29.0 19.6 25.2 29.9<br />
Asian 28.0 13.4 27.7 31.5<br />
Native Hawaiian/Pacific Isl<strong>and</strong>er ‡ ‡ ‡ ‡<br />
American Indian/Alaska Native 23.0 ! 19.9 ! 9.2 ! 25.7<br />
Two or more races 32.0 23.4 27.8 33.0<br />
! Interpret data with caution. The coefficient of variation (CV) for this estimate is 30 percent or greater.<br />
‡ Report<strong>in</strong>g st<strong>and</strong>ards not met. Either there are too few cases or the coefficient of variation (CV) is 50 percent or greater.<br />
1<br />
Total <strong>in</strong>cludes other racial/ethnic groups not shown separately <strong>in</strong> the table.<br />
NOTE: Race categories exclude persons of Hispanic ethnicity. Academic experiences of students are from their first 2 or 3 years as undergraduates. Data<br />
weighted by WTA000.<br />
SOURCE: U.S. Department of <strong>Education</strong>, National Center for <strong>Education</strong> Statistics, 2003–04 Beg<strong>in</strong>n<strong>in</strong>g Postsecondary Students Longitud<strong>in</strong>al <strong>Study</strong>, First<br />
Follow-up (BPS:04/06).<br />
Postsecondary <strong>Education</strong><br />
6<br />
Postsecondary <strong>Education</strong> 195
Indicator 40<br />
Academic <strong>and</strong> Social Integration<br />
Among 2003–04 beg<strong>in</strong>n<strong>in</strong>g postsecondary students who had recently graduated<br />
from high school, a lower percentage of males (72 percent) than females (77<br />
percent) reported that they sometimes or often met with an advisor dur<strong>in</strong>g their<br />
first year of college. Also, a lower percentage of male (33 percent) than female<br />
students (37 percent) reported that they sometimes or often participated <strong>in</strong> school<br />
clubs <strong>in</strong> their first year. In contrast, a higher percentage of male (35 percent) than<br />
female students (23 percent) participated <strong>in</strong> sports <strong>in</strong> their first year.<br />
Approximately three quarters (75 percent) of 2003–04<br />
beg<strong>in</strong>n<strong>in</strong>g postsecondary students who had recently<br />
graduated from high school reported that they sometimes<br />
or often met with an advisor dur<strong>in</strong>g their first year of<br />
college. A lower percentage of male (72 percent) than<br />
female (77 percent) students reported such a meet<strong>in</strong>g<br />
dur<strong>in</strong>g their first year. This difference was also observed<br />
for White male <strong>and</strong> female students. No measurable<br />
differences by sex were observed for other racial/ethnic<br />
groups.<br />
A lower percentage of Hispanic (66 percent) than White<br />
(76 percent), Black (76 percent), <strong>and</strong> Asian (77 percent)<br />
beg<strong>in</strong>n<strong>in</strong>g postsecondary students reported that they<br />
had met with an advisor dur<strong>in</strong>g their first year of college.<br />
This pattern across racial/ethnic groups was also observed<br />
separately for male <strong>and</strong> female students.<br />
Of 2003–04 beg<strong>in</strong>n<strong>in</strong>g postsecondary students who had<br />
recently graduated from high school, 35 percent reported<br />
that they sometimes or often participated <strong>in</strong> school clubs<br />
dur<strong>in</strong>g their first year of college. A lower percentage<br />
of male (33 percent) than female students (37 percent)<br />
participated <strong>in</strong> school clubs <strong>in</strong> their first year. This pattern<br />
was also observed for White male <strong>and</strong> female students.<br />
No measurable differences by sex were observed for other<br />
racial/ethnic groups.<br />
Lower percentages of Hispanics (28 percent) <strong>and</strong> Blacks<br />
(31 percent) than Whites (36 percent), students of two or<br />
more races (40 percent), <strong>and</strong> Asians (46 percent) reported<br />
that they had participated <strong>in</strong> school clubs <strong>in</strong> their first<br />
year of college. Similar patterns across racial/ethnic groups<br />
were observed for females. For males, lower percentages<br />
of Hispanic (28 percent), Black (29 percent), <strong>and</strong> White<br />
Figure 40-1.<br />
Percentage of recent high school graduates attend<strong>in</strong>g 2- or 4-year postsecondary <strong>in</strong>stitutions who<br />
reported meet<strong>in</strong>g with an advisor sometimes or often dur<strong>in</strong>g their first year, by race/ethnicity <strong>and</strong> sex:<br />
2003–04<br />
Percent<br />
100<br />
80<br />
72<br />
77<br />
73<br />
79<br />
74<br />
77<br />
63<br />
69<br />
74<br />
79<br />
68<br />
74<br />
60<br />
40<br />
20<br />
0<br />
Total 1 White Black Hispanic Asian Two or more races<br />
Race/ethnicity<br />
Male<br />
Female<br />
1<br />
Total <strong>in</strong>cludes other racial/ethnic groups not shown separately <strong>in</strong> the figure.<br />
NOTE: Data <strong>in</strong> this <strong>in</strong>dicator are for students who enrolled at 2- or 4-year <strong>in</strong>stitutions any time between July 1, 2003, <strong>and</strong> June 30, 2004. Recent high school<br />
graduates refers to students who graduated from high school <strong>in</strong> 2003 or 2004. Report<strong>in</strong>g st<strong>and</strong>ards for Native Hawaiian/Pacific Isl<strong>and</strong>er students <strong>and</strong><br />
American Indian/Alaska Native males were not met; therefore, data for these groups are not shown <strong>in</strong> the figure. Race categories exclude persons of<br />
Hispanic ethnicity. Data weighted by WTA000.<br />
SOURCE: U.S. Department of <strong>Education</strong>, National Center for <strong>Education</strong> Statistics, 2003–04 Beg<strong>in</strong>n<strong>in</strong>g Postsecondary Students Longitud<strong>in</strong>al <strong>Study</strong>, First Follow-up<br />
(BPS:04/06).<br />
196 <strong>Higher</strong> <strong>Education</strong>: <strong>Gaps</strong> <strong>in</strong> <strong>Access</strong> <strong>and</strong> <strong>Persistence</strong> <strong>Study</strong>
Figure 40-2.<br />
Percent<br />
100<br />
Percentage of recent high school graduates attend<strong>in</strong>g 2- or 4-year postsecondary <strong>in</strong>stitutions who<br />
reported participation <strong>in</strong> school clubs sometimes or often dur<strong>in</strong>g their first year, by race/ethnicity <strong>and</strong> sex:<br />
2003–04<br />
40<br />
80<br />
60<br />
40<br />
33<br />
37<br />
34<br />
38<br />
29<br />
33<br />
28 28<br />
43<br />
49<br />
38<br />
41<br />
20<br />
0<br />
Total 1 White Black Hispanic Asian Two or more races<br />
Race/ethnicity<br />
Male<br />
Female<br />
1<br />
Total <strong>in</strong>cludes other racial/ethnic groups not shown separately <strong>in</strong> the figure.<br />
NOTE: Data <strong>in</strong> this <strong>in</strong>dicator are for students who enrolled at 2- or 4-year <strong>in</strong>stitutions any time between July 1, 2003, <strong>and</strong> June 30, 2004. Recent high school<br />
graduates refers to students who graduated from high school <strong>in</strong> 2003 or 2004. Report<strong>in</strong>g st<strong>and</strong>ards for Native Hawaiian/Pacific Isl<strong>and</strong>er students <strong>and</strong><br />
American Indian/Alaska Native males were not met; therefore, data for these groups are not shown <strong>in</strong> the figure. Race categories exclude persons of<br />
Hispanic ethnicity. Data weighted by WTA000.<br />
SOURCE: U.S. Department of <strong>Education</strong>, National Center for <strong>Education</strong> Statistics, 2003–04 Beg<strong>in</strong>n<strong>in</strong>g Postsecondary Students Longitud<strong>in</strong>al <strong>Study</strong>, First Follow-up<br />
(BPS:04/06).<br />
Figure 40-3.<br />
Percent<br />
100<br />
80<br />
60<br />
Percentage of recent high school graduates attend<strong>in</strong>g 2- or 4-year postsecondary <strong>in</strong>stitutions who<br />
reported participation <strong>in</strong> school sports sometimes or often dur<strong>in</strong>g their first year, by race/ethnicity <strong>and</strong><br />
sex: 2003–04<br />
Postsecondary <strong>Education</strong><br />
6<br />
40<br />
20<br />
35<br />
23<br />
38<br />
28<br />
30<br />
14<br />
23<br />
11<br />
30<br />
17<br />
38<br />
18<br />
0<br />
Total 1 White Black Hispanic Asian Two or more races<br />
Race/ethnicity<br />
Male<br />
Female<br />
1<br />
Total <strong>in</strong>cludes other racial/ethnic groups not shown separately <strong>in</strong> the figure.<br />
NOTE: Data <strong>in</strong> this <strong>in</strong>dicator are for students who enrolled at 2- or 4-year <strong>in</strong>stitutions any time between July 1, 2003, <strong>and</strong> June 30, 2004. Recent high school<br />
graduates refers to students who graduated from high school <strong>in</strong> 2003 or 2004. Report<strong>in</strong>g st<strong>and</strong>ards for Native Hawaiians/Pacific Isl<strong>and</strong>ers <strong>and</strong> American<br />
Indians/Alaska Natives were not met; therefore, data for these groups are not shown <strong>in</strong> the figure. Data <strong>in</strong> this <strong>in</strong>dicator are for students who enrolled at 2- or<br />
4-year <strong>in</strong>stitutions any time between July 1, 2003, <strong>and</strong> June 30, 2004. Race categories exclude persons of Hispanic ethnicity. Data weighted by WTA000.<br />
SOURCE: U.S. Department of <strong>Education</strong>, National Center for <strong>Education</strong> Statistics, 2003–04 Beg<strong>in</strong>n<strong>in</strong>g Postsecondary Students Longitud<strong>in</strong>al <strong>Study</strong>, First Follow-up<br />
(BPS:04/06).<br />
Postsecondary <strong>Education</strong> 197
students (34 percent) participated <strong>in</strong> clubs than did Asian<br />
students (43 percent).<br />
Among 2003–04 beg<strong>in</strong>n<strong>in</strong>g postsecondary students who<br />
had recently graduated from high school, 28 percent<br />
reported that they sometimes or often participated<br />
<strong>in</strong> sports dur<strong>in</strong>g their first year of college. A higher<br />
percentage of male (35 percent) than female students (23<br />
percent) participated <strong>in</strong> sports <strong>in</strong> their first year. This<br />
pattern by sex was also observed for Whites, Blacks,<br />
Hispanics, Asians, <strong>and</strong> students of two or more races.<br />
Technical Notes<br />
Recent high school graduates refers to students who<br />
graduated from high school <strong>in</strong> year 2003 or 2004. Data <strong>in</strong><br />
this <strong>in</strong>dicator are for students who enrolled at 2- or 4-year<br />
Lower percentages of Hispanics (17 percent), Blacks (21<br />
percent), Asians (24 percent), <strong>and</strong> students of two or more<br />
races (26 percent) than Whites (32 percent) reported<br />
that they had participated <strong>in</strong> sports <strong>in</strong> their first year of<br />
college. In addition, the percentage of Hispanics who<br />
participated <strong>in</strong> sports was lower than the percentages of<br />
beg<strong>in</strong>n<strong>in</strong>g Blacks, Asians, <strong>and</strong> students of two or more<br />
races. This pattern was generally observed for females<br />
across racial/ethnic groups, except there was no difference<br />
between Hispanics <strong>and</strong> Blacks. Among male students,<br />
lower percentages of beg<strong>in</strong>n<strong>in</strong>g Hispanics (23 percent)<br />
<strong>and</strong> Blacks (30 percent) than beg<strong>in</strong>n<strong>in</strong>g Whites (38<br />
percent) participated <strong>in</strong> sports.<br />
<strong>in</strong>stitutions any time between July 1, 2003, <strong>and</strong> June 30,<br />
2004.<br />
198 <strong>Higher</strong> <strong>Education</strong>: <strong>Gaps</strong> <strong>in</strong> <strong>Access</strong> <strong>and</strong> <strong>Persistence</strong> <strong>Study</strong>
Table 40-1.<br />
Sex <strong>and</strong> race/ethnicity<br />
Sex<br />
Percentage of beg<strong>in</strong>n<strong>in</strong>g postsecondary students attend<strong>in</strong>g 2- or 4-year <strong>in</strong>stitutions who reported participation <strong>in</strong> various academic activities sometimes<br />
or often dur<strong>in</strong>g their first year, by recent high school graduate status, activity, sex, <strong>and</strong> race/ethnicity: 2003–04<br />
Had <strong>in</strong>formal<br />
contact with<br />
faculty<br />
Recent high school graduates 1 Other beg<strong>in</strong>n<strong>in</strong>g postsecondary students 2<br />
Talked with<br />
faculty about<br />
academic<br />
matters outside<br />
of class<br />
Met with an<br />
advisor<br />
Attended study<br />
groups<br />
Had <strong>in</strong>formal<br />
contact with<br />
faculty<br />
Talked with<br />
faculty about<br />
academic<br />
matters outside<br />
of class<br />
Met with an<br />
advisor<br />
Attended study<br />
groups<br />
Total 3 41.4 79.1 75.0 58.6 27.6 62.6 56.7 39.2<br />
Male 41.8 77.2 72.1 54.7 30.3 63.5 57.4 41.3<br />
Female 41.0 80.7 77.4 61.8 25.6 62.0 56.1 37.6<br />
Race/ethnicity<br />
White 41.2 80.0 76.4 59.1 25.4 62.7 59.2 37.0<br />
Black 45.6 79.6 75.9 57.0 31.1 65.3 57.0 47.2<br />
Hispanic 36.1 73.4 66.1 52.2 29.2 57.3 46.7 38.0<br />
Asian 45.2 81.5 76.7 66.1 36.5 69.3 60.4 48.5<br />
Native Hawaiian/Pacific Isl<strong>and</strong>er 64.9 93.4 71.4 80.8 ‡ ‡ ‡ ‡<br />
American Indian/Alaska Native 52.1 86.9 70.0 49.4 20.1 ! 57.4 48.2 ! 31.6 !<br />
Two or more races 38.9 76.0 71.5 61.8 28.9 ! 72.2 67.9 39.5<br />
Race/ethnicity by sex<br />
Male<br />
White 42.1 77.4 73.3 54.4 28.9 63.0 61.2 40.8<br />
Black 45.7 77.6 74.3 55.0 29.6 65.5 53.3 44.6<br />
Hispanic 35.3 72.8 62.7 49.2 35.6 60.7 44.7 40.8<br />
Asian 45.3 83.5 74.2 64.1 36.6 65.9 59.8 48.5<br />
Native Hawaiian/Pacific Isl<strong>and</strong>er ‡ ‡ ‡ ‡ ‡ ‡ ‡ ‡<br />
American Indian/Alaska Native ‡ ‡ ‡ ‡ ‡ ‡ ‡ ‡<br />
Two or more races 35.8 76.5 68.3 60.1 33.3 ! 77.9 75.3 34.5 !<br />
Postsecondary <strong>Education</strong> 199<br />
Female<br />
White 40.5 82.2 79.1 63.1 22.8 62.4 57.8 34.3<br />
Black 45.5 81.1 77.1 58.4 31.9 65.2 59.2 48.7<br />
Hispanic 36.7 73.8 68.7 54.5 25.1 55.0 47.9 36.2<br />
Asian 45.0 79.5 79.3 68.1 36.3 72.5 60.9 48.6<br />
Native Hawaiian/Pacific Isl<strong>and</strong>er ‡ ‡ ‡ ‡ ‡ ‡ ‡ ‡<br />
American Indian/Alaska Native 54.5 93.0 72.2 52.3 ‡ 72.6 52.1 ! 34.1 !<br />
Two or more races 40.9 75.7 73.6 63.0 23.2 ! 64.8 58.1 46.1<br />
! Interpret data with caution. The coefficient of variation (CV) for this estimate is 30 percent or greater.<br />
‡ Report<strong>in</strong>g st<strong>and</strong>ards not met. There are either too few cases or the coefficient of variation (CV) is 50 percent or greater.<br />
1<br />
Recent high school graduates refers to students who graduated from high school <strong>in</strong> 2003 or 2004.<br />
2<br />
Estimates <strong>in</strong>clude students who graduated prior to 2003 as well as those who did not receive a high school degree or certificate <strong>and</strong> those who were homeschooled.<br />
3<br />
Total <strong>in</strong>cludes other racial/ethnic groups not shown separately <strong>in</strong> the table.<br />
NOTE: Data <strong>in</strong> this <strong>in</strong>dicator are for students who enrolled at 2- or 4-year <strong>in</strong>stitutions any time between July 1, 2003, <strong>and</strong> June 30, 2004. Race categories exclude persons of Hispanic ethnicity. Data weighted by<br />
WTA000.<br />
SOURCE: U.S. Department of <strong>Education</strong>, National Center for <strong>Education</strong> Statistics, 2003–04 Beg<strong>in</strong>n<strong>in</strong>g Postsecondary Students Longitud<strong>in</strong>al <strong>Study</strong>, First Follow-up (BPS:04/06).<br />
6<br />
Postsecondary <strong>Education</strong><br />
40
Table 40-2. Percentage of recent high school graduates attend<strong>in</strong>g 2- or 4-year postsecondary <strong>in</strong>stitutions who<br />
reported participation <strong>in</strong> various social activities sometimes or often dur<strong>in</strong>g their first year, by activity, sex,<br />
<strong>and</strong> race/ethnicity: 2003–04<br />
Recent high school graduates 1<br />
Sex <strong>and</strong> race/ethnicity<br />
Attended f<strong>in</strong>e arts<br />
activities<br />
Participated <strong>in</strong><br />
school clubs<br />
Participated <strong>in</strong><br />
sports<br />
Total 2 40.7 35.4 28.5<br />
Sex<br />
Male 37.5 33.4 35.0<br />
Female 43.3 37.1 23.1<br />
Race/ethnicity<br />
White 42.8 36.3 32.5<br />
Black 38.8 31.3 20.8<br />
Hispanic 31.9 28.3 16.5<br />
Asian 40.9 45.6 23.5<br />
Native Hawaiian/Pacific Isl<strong>and</strong>er 30.6 ! 29.5 ! 24.7 !<br />
American Indian/Alaska Native 36.5 40.3 24.8 !<br />
Two or more races 43.4 39.5 25.8<br />
Race/ethnicity by sex<br />
Male<br />
White 39.1 33.8 38.3<br />
Black 38.0 28.9 29.6<br />
Hispanic 31.8 28.2 23.0<br />
Asian 35.1 42.6 29.7<br />
Native Hawaiian/Pacific Isl<strong>and</strong>er ‡ ‡ ‡<br />
American Indian/Alaska Native ‡ ‡ ‡<br />
Two or more races 33.3 37.8 38.1<br />
Female<br />
White 45.8 38.5 27.6<br />
Black 39.3 33.0 14.1<br />
Hispanic 32.1 28.4 11.4<br />
Asian 46.5 48.5 17.5<br />
Native Hawaiian/Pacific Isl<strong>and</strong>er ‡ ‡ ‡<br />
American Indian/Alaska Native 37.4 38.5 ‡<br />
Two or more races 50.1 40.6 17.8<br />
! Interpret data with caution. The coefficient of variation (CV) for this estimate is 30 percent or greater.<br />
‡ Report<strong>in</strong>g st<strong>and</strong>ards not met. There are either too few cases or the coefficient of variation (CV) is 50 percent or greater.<br />
1<br />
Recent high school graduates refers to students who graduated from high school <strong>in</strong> 2003 or 2004.<br />
2<br />
Total <strong>in</strong>cludes other racial/ethnic groups not shown separately <strong>in</strong> the table.<br />
NOTE: Data <strong>in</strong> this <strong>in</strong>dicator are for students who enrolled at 2- or 4-year <strong>in</strong>stitutions any time between July 1, 2003, <strong>and</strong> June 30, 2004. Race categories<br />
exclude persons of Hispanic ethnicity. Data weighted by WTA000.<br />
SOURCE: U.S. Department of <strong>Education</strong>, National Center for <strong>Education</strong> Statistics, 2003–04 Beg<strong>in</strong>n<strong>in</strong>g Postsecondary Students Longitud<strong>in</strong>al <strong>Study</strong>, First<br />
Follow-up (BPS:04/06).<br />
200 <strong>Higher</strong> <strong>Education</strong>: <strong>Gaps</strong> <strong>in</strong> <strong>Access</strong> <strong>and</strong> <strong>Persistence</strong> <strong>Study</strong>
40<br />
This page <strong>in</strong>tentionally left blank.<br />
Postsecondary <strong>Education</strong><br />
6<br />
Postsecondary <strong>Education</strong> 201
Indicator 41<br />
College Student Employment<br />
In 2010, a lower percentage of male than female undergraduates were employed<br />
(70 vs. 73 percent). Lower percentages of males than females were employed<br />
among Whites (76 vs. 79 percent), Blacks (57 vs. 62 percent), <strong>and</strong> Asians (49 vs.<br />
52 percent).<br />
In 2010, approximately 71 percent of undergraduates ages<br />
16 to 24 were employed. About 19 percent worked 35 or<br />
more hours per week, 31 percent worked 20 to 34 hours<br />
per week, <strong>and</strong> 21 percent worked less than 20 hours per<br />
week. The employment status of undergraduates varied<br />
accord<strong>in</strong>g to students’ sex <strong>and</strong> race/ethnicity.<br />
In 2010, a lower percentage of male than female<br />
undergraduates were employed (70 vs. 73 percent). With<strong>in</strong><br />
racial/ethnic groups, the percentage of males who were<br />
employed was lower than that of females for Whites<br />
(76 vs. 79 percent), Blacks (57 vs. 62 percent), <strong>and</strong> Asians<br />
(49 vs. 52 percent). There were no measurable differences<br />
between the employment rates of males <strong>and</strong> females<br />
among Hispanics, Native Hawaiians/Pacific Isl<strong>and</strong>ers,<br />
American Indians, <strong>and</strong> students of two or more races.<br />
<strong>Higher</strong> percentages of undergraduates who were<br />
White (78 percent) <strong>and</strong> students of two or more races<br />
(73 percent) were employed <strong>in</strong> 2010 than were<br />
undergraduates from all other racial/ethnic groups.<br />
In addition, higher percentages of American Indian<br />
(66 percent), Hispanic (64 percent), Native Hawaiian/<br />
Pacific Isl<strong>and</strong>er (61 percent), <strong>and</strong> Black (60 percent)<br />
undergraduates were employed than were Asian<br />
undergraduates (51 percent). White males (76 percent),<br />
males of two or more races (72 percent), American Indian<br />
males (65 percent), Hispanic males (64 percent), Native<br />
Hawaiian/Pacific Isl<strong>and</strong>er males (62 percent), <strong>and</strong> Black<br />
males (57 percent) were employed at higher percentages<br />
than were Asian males (49 percent). In addition, Hispanic<br />
males were employed at a higher percentage than Black<br />
males. Racial/ethnic differences <strong>in</strong> the percentages of<br />
female students employed were similar to the overall<br />
employment patterns.<br />
In contrast to the pattern for the percentage of<br />
undergraduates employed overall, a higher percentage<br />
of male than female undergraduates (22 vs. 17 percent)<br />
worked 35 or more hours per week. <strong>Higher</strong> percentages<br />
of males than females worked 35 or more hours per week<br />
among Whites (24 vs. 17 percent), Hispanics (22 vs.<br />
18 percent), <strong>and</strong> students of two or more races (20 vs.<br />
15 percent). There were no measurable differences between<br />
Figure 41-1.<br />
Percentage of 16- to 24-year-old undergraduate college students who were employed, by race/ethnicity<br />
<strong>and</strong> sex: 2010<br />
Percent<br />
100<br />
80<br />
60<br />
70 73<br />
76 79<br />
57<br />
62 64 65<br />
49 52<br />
62 60<br />
65 67<br />
72<br />
75<br />
40<br />
20<br />
0<br />
Total¹ White Black Hispanic Asian Native American Indian<br />
Hawaiian/<br />
Pacific Isl<strong>and</strong>er<br />
Race/ethnicity<br />
Two or more<br />
races<br />
Male<br />
Female<br />
¹ Total <strong>in</strong>cludes other racial/ethnic groups not shown separately <strong>in</strong> the figure.<br />
NOTE: Includes those who were employed but not at work dur<strong>in</strong>g the survey week. College <strong>in</strong>cludes both 2- <strong>and</strong> 4-year <strong>in</strong>stitutions. Report<strong>in</strong>g st<strong>and</strong>ards for<br />
Alaska Natives were not met; therefore, data for this group are not shown <strong>in</strong> the figure. Race categories exclude persons of Hispanic ethnicity.<br />
SOURCE: U.S. Department of Commerce, Census Bureau, American Community Survey (ACS), 2010.<br />
202 <strong>Higher</strong> <strong>Education</strong>: <strong>Gaps</strong> <strong>in</strong> <strong>Access</strong> <strong>and</strong> <strong>Persistence</strong> <strong>Study</strong>
the percentages of males <strong>and</strong> females who worked 35 or<br />
more hours for Blacks, Asians, American Indians, <strong>and</strong><br />
Native Hawaiians/Pacific Isl<strong>and</strong>ers.<br />
In 2010, about 26 percent of undergraduates who were<br />
American Indian worked 35 or more hours per week, a<br />
higher percentage than Hispanics (20 percent), Blacks<br />
(18 percent), persons of two or more races (18 percent),<br />
Native Hawaiians/Pacific Isl<strong>and</strong>ers (15 percent) <strong>and</strong><br />
Asians (11 percent). Whites (21 percent) <strong>and</strong> Hispanics<br />
(20 percent) had higher percentages of undergraduates<br />
who worked 35 or more hours per week than did Blacks<br />
(18 percent) or students of two or more races (18 percent).<br />
Among male undergraduates, Asian students had the<br />
lowest percentage of undergraduates who worked 35 or<br />
more hours per week (11 percent), with the exception<br />
that no measurable difference was found between Asian<br />
<strong>and</strong> Native Hawaiian/Pacific Isl<strong>and</strong>er males. A lower<br />
percentage of Black undergraduate males (18 percent)<br />
worked 35 or more hours per week than did American<br />
Indian (27 percent), White (24 percent), <strong>and</strong> Hispanic<br />
undergraduate males (22 percent). A higher percentage<br />
of White males than Hispanic males worked 35 or<br />
more hours per week. Among female undergraduates,<br />
higher percentages of American Indians (26 percent)<br />
worked 35 or more hours per week than did Whites<br />
(17 percent), Blacks (17 percent), Hispanics (18 percent),<br />
Asians (10 percent), Native Hawaiians/Pacific Isl<strong>and</strong>ers<br />
(15 percent), <strong>and</strong> females of two or more races (15<br />
percent). The percentages of female undergraduates who<br />
worked 35 or more hours per week were also higher for<br />
Whites, Blacks, Hispanics, <strong>and</strong> females of two or more<br />
races than for Asian females.<br />
41<br />
Technical Notes<br />
Undergraduates <strong>in</strong>clude <strong>in</strong>dividuals between the ages<br />
of 16 <strong>and</strong> 24 who were enrolled at a postsecondary<br />
<strong>in</strong>stitution. Hours worked per week refers to the number of<br />
hours the respondent worked at all jobs dur<strong>in</strong>g the survey<br />
week <strong>and</strong> therefore excludes those who were employed but<br />
not at work dur<strong>in</strong>g the survey week. College <strong>in</strong>cludes both<br />
2- <strong>and</strong> 4-year <strong>in</strong>stitutions. Race categories exclude persons<br />
of Hispanic ethnicity.<br />
Postsecondary <strong>Education</strong><br />
6<br />
Postsecondary <strong>Education</strong> 203
Table 41-1.<br />
Sex <strong>and</strong> race/ethnicity<br />
Sex<br />
Percentage of 16- to 24-year-old undergraduates who were employed, by hours worked per week, sex,<br />
<strong>and</strong> race/ethnicity: 2010<br />
Percent employed¹<br />
Hours worked per week²<br />
Less than 20 hours 20–34 hours 35 or more hours<br />
Total 3 71.3 21.0 31.0 19.3<br />
Male 69.9 18.0 29.8 22.2<br />
Female 72.5 23.5 32.2 16.9<br />
Race/ethnicity<br />
White 77.7 23.2 33.8 20.6<br />
Black 60.0 15.4 27.1 17.6<br />
Hispanic 64.4 15.7 29.0 19.7<br />
Asian 50.6 21.4 18.5 10.7<br />
Native Hawaiian/Pacific Isl<strong>and</strong>er 61.0 16.7 29.4 14.8<br />
American Indian/Alaska Native 4 65.8 16.9 23.9 25.0<br />
American Indian 66.2 15.8 24.3 26.1<br />
Alaska Native ‡ ‡ ‡ ‡<br />
Two or more races 73.4 24.1 31.7 17.5<br />
Race/ethnicity by sex<br />
Male<br />
White 76.2 19.4 32.4 24.4<br />
Black 57.3 14.4 25.1 17.8<br />
Hispanic 64.1 13.7 28.1 22.3<br />
Asian 49.0 19.1 18.5 11.4<br />
Native Hawaiian/Pacific Isl<strong>and</strong>er 61.8 12.6 ! 34.2 15.0<br />
American Indian/Alaska Native 4 63.9 14.9 23.7 25.4<br />
American Indian 65.3 15.3 23.4 26.6<br />
Alaska Native ‡ ‡ ‡ ‡<br />
Two or more races 72.0 22.1 29.5 20.3<br />
Female<br />
White 79.1 26.7 35.1 17.3<br />
Black 62.0 16.1 28.5 17.4<br />
Hispanic 64.7 17.3 29.8 17.6<br />
Asian 52.2 23.7 18.4 10.0<br />
Native Hawaiian/Pacific Isl<strong>and</strong>er 60.3 20.4 25.1 14.7<br />
American Indian/Alaska Native 4 67.3 18.5 24.1 24.8<br />
American Indian 66.9 16.1 24.9 25.9<br />
Alaska Native ‡ ‡ ‡ ‡<br />
Two or more races 74.6 25.8 33.5 15.2<br />
! Interpret data with caution. The coefficient of variation (CV) for this estimate is 30 percent or greater.<br />
‡ Report<strong>in</strong>g st<strong>and</strong>ards not met (too few cases).<br />
1<br />
Includes those who were employed but not at work dur<strong>in</strong>g the survey week.<br />
2<br />
Excludes those who were employed but not at work dur<strong>in</strong>g the survey week; therefore, detail may not sum to total percentage employed. Hours<br />
worked per week refers to the number of hours the respondent worked at all jobs dur<strong>in</strong>g the survey week.<br />
3<br />
Total <strong>in</strong>cludes other racial/ethnic groups not shown separately <strong>in</strong> the table.<br />
4<br />
Includes persons report<strong>in</strong>g American Indian only, Alaska Native only, <strong>and</strong> persons from American Indian <strong>and</strong>/or Alaska Native tribes specified or not<br />
specified.<br />
NOTE: College <strong>in</strong>cludes both 2- <strong>and</strong> 4-year <strong>in</strong>stitutions. Race categories exclude persons of Hispanic ethnicity.<br />
SOURCE: U.S. Department of Commerce, Census Bureau, American Community Survey (ACS), 2010.<br />
204 <strong>Higher</strong> <strong>Education</strong>: <strong>Gaps</strong> <strong>in</strong> <strong>Access</strong> <strong>and</strong> <strong>Persistence</strong> <strong>Study</strong>
41<br />
This page <strong>in</strong>tentionally left blank.<br />
Postsecondary <strong>Education</strong><br />
6<br />
Postsecondary <strong>Education</strong> 205
Indicator 42<br />
Graduation Rates <strong>and</strong> Degrees Conferred<br />
A higher percentage of female than male first-time postsecondary students who<br />
started as full-time degree-seek<strong>in</strong>g students <strong>in</strong> 2004 completed bachelor’s degrees<br />
with<strong>in</strong> 6 years (61 vs. 56 percent). In 2010, a lower percentage of males than<br />
females earned associate’s degrees <strong>in</strong> science, technology, eng<strong>in</strong>eer<strong>in</strong>g,<br />
<strong>and</strong> mathematics (STEM) fields (28 vs. 32 percent). In contrast, at the bachelor’s<br />
level a higher percentage of males than females earned degrees <strong>in</strong> STEM fields<br />
(28 vs. 22 percent).<br />
About 58 percent of all first-time students seek<strong>in</strong>g<br />
bachelor’s degrees who started at a 4-year college full time<br />
<strong>in</strong> 2004 completed a bachelor’s degree with<strong>in</strong> 6 years.<br />
A higher percentage of females than males completed<br />
bachelor’s degrees with<strong>in</strong> 6 years (61 vs. 56 percent).<br />
This pattern held across all racial/ethnic groups, with<br />
the greatest difference between Black females <strong>and</strong> males<br />
(9 percentage po<strong>in</strong>ts) <strong>and</strong> the smallest difference between<br />
American Indian/Alaska Native females <strong>and</strong> males<br />
(3 percentage po<strong>in</strong>ts).<br />
The percentage of students who started as full-time<br />
degree-seek<strong>in</strong>g students <strong>and</strong> completed a bachelor’s<br />
degree with<strong>in</strong> 6 years varied across racial/ethnic groups.<br />
Some 69 percent of Asian/Pacific Isl<strong>and</strong>er students<br />
completed bachelor’s degrees with<strong>in</strong> 6 years, compared<br />
with 62 percent of White, 50 percent of Hispanic, <strong>and</strong><br />
39 percent each of Black <strong>and</strong> American Indian/Alaska<br />
Native students. The same pattern was observed for<br />
the female subset of the racial/ethnic groups. Among<br />
males, Asian/Pacific Isl<strong>and</strong>ers had the highest percentage<br />
complet<strong>in</strong>g bachelor’s degrees with<strong>in</strong> 6 years (66 percent),<br />
followed by White (59 percent), Hispanic (46 percent),<br />
American Indian/Alaska Native (37 percent), <strong>and</strong> Black<br />
males (34 percent).<br />
In 2010, postsecondary degree-grant<strong>in</strong>g <strong>in</strong>stitutions<br />
conferred a total of 3.4 million associate’s, bachelor’s,<br />
master’s, <strong>and</strong> doctor’s degrees. Of this total, 25 percent<br />
were associate’s degrees, 49 percent were bachelor’s<br />
degrees, 21 percent were master’s degrees, <strong>and</strong> 5 percent<br />
were doctor’s degrees.<br />
Some 30 percent of all associate’s degrees conferred <strong>in</strong><br />
2010 were <strong>in</strong> a STEM field of study. A lower percentage<br />
of males than females earned associate’s degrees <strong>in</strong> STEM<br />
fields (27 vs. 32 percent). This pattern held between<br />
the sexes for White (28 vs. 35 percent), Black (28 vs.<br />
31 percent), Asian/Pacific Isl<strong>and</strong>er (30 vs. 31 percent),<br />
<strong>and</strong> American Indian/Alaska Native students (25 vs.<br />
Figure 42-1.<br />
Percentage of first-time postsecondary students who started as full-time degree-seek<strong>in</strong>g students at a<br />
4-year <strong>in</strong>stitution <strong>and</strong> graduated with a bachelor’s degree with<strong>in</strong> 6 years, by race/ethnicity <strong>and</strong> sex:<br />
Cohort entry year 2004<br />
Percent<br />
100<br />
80<br />
60<br />
40<br />
56<br />
61<br />
59<br />
64<br />
34<br />
43<br />
46<br />
53<br />
66<br />
71<br />
37<br />
41<br />
20<br />
0<br />
Total 1 White Black Hispanic Asian/Pacific Isl<strong>and</strong>er American Indian/<br />
Alaska Native<br />
Race/ethnicity<br />
Male<br />
Female<br />
1<br />
Total <strong>in</strong>cludes other racial/ethnic groups not shown separately <strong>in</strong> the figure.<br />
NOTE: Separate estimates for Asians <strong>and</strong> Native Hawaiians/Pacific Isl<strong>and</strong>ers were not available; therefore, data for these groups are not shown <strong>in</strong> the figure.<br />
Race categories exclude persons of Hispanic ethnicity.<br />
SOURCE: U.S. Department of <strong>Education</strong>, National Center for <strong>Education</strong> Statistics, Integrated Postsecondary <strong>Education</strong> Data System, Spr<strong>in</strong>g 2011, Graduation<br />
Rates component.<br />
206 <strong>Higher</strong> <strong>Education</strong>: <strong>Gaps</strong> <strong>in</strong> <strong>Access</strong> <strong>and</strong> <strong>Persistence</strong> <strong>Study</strong>
Figure 42-2.<br />
Percentage of degrees conferred by degree-grant<strong>in</strong>g <strong>in</strong>stitutions <strong>in</strong> science, technology, eng<strong>in</strong>eer<strong>in</strong>g,<br />
<strong>and</strong> mathematics (STEM) fields, by degree level, race/ethnicity, <strong>and</strong> sex: Academic year 2009–10<br />
Percent STEM associate’s degree STEM bachelor’s degree<br />
42<br />
100<br />
80<br />
60<br />
40<br />
20<br />
27<br />
32<br />
28<br />
35<br />
28<br />
31<br />
24 23<br />
30 31<br />
25 27 28<br />
22<br />
27<br />
23 22 20<br />
24<br />
17<br />
40<br />
33<br />
27<br />
21<br />
0<br />
Total 1 White Black Hispanic Asian/<br />
Pacific<br />
Isl<strong>and</strong>er<br />
American<br />
Indian/<br />
Alaska<br />
Native<br />
Total 1 White Black Hispanic Asian/<br />
Pacific<br />
Isl<strong>and</strong>er<br />
American<br />
Indian/<br />
Alaska<br />
Native<br />
Race/ethnicity<br />
Male<br />
1<br />
Total <strong>in</strong>cludes other racial/ethnic groups not shown separately <strong>in</strong> the figure.<br />
NOTE: STEM degrees, as def<strong>in</strong>ed here, <strong>in</strong>clude mathematics; natural sciences (<strong>in</strong>clud<strong>in</strong>g physical sciences <strong>and</strong> biological/agricultural sciences);<br />
eng<strong>in</strong>eer<strong>in</strong>g/eng<strong>in</strong>eer<strong>in</strong>g technologies; health professions <strong>and</strong> related cl<strong>in</strong>ical sciences; <strong>and</strong> computer/<strong>in</strong>formation sciences. Degree-grant<strong>in</strong>g <strong>in</strong>stitutions<br />
grant associate’s or higher degrees <strong>and</strong> participate <strong>in</strong> Title IV federal f<strong>in</strong>ancial aid programs. Reported racial/ethnic distributions of students by level of<br />
degree, field of degree, <strong>and</strong> sex were used to estimate race/ethnicity for students whose race/ethnicity was not reported. Separate estimates for Asians<br />
<strong>and</strong> Native Hawaiians/Pacific Isl<strong>and</strong>ers were not available; therefore, data for these groups are not shown <strong>in</strong> the figure. Race categories exclude persons of<br />
Hispanic ethnicity.<br />
SOURCE: U.S. Department of <strong>Education</strong>, National Center for <strong>Education</strong> Statistics, Integrated Postsecondary <strong>Education</strong> Data System (IPEDS), Fall 2010,<br />
Completions component.<br />
27 percent). In contrast, a higher percentage of Hispanic<br />
males earned associate’s degrees <strong>in</strong> STEM fields than did<br />
Hispanic females (24 vs. 23 percent).<br />
The percentages of associate’s degrees conferred <strong>in</strong><br />
STEM fields varied across racial/ethnic groups. For<br />
example, 23 percent of Hispanic students earned<br />
associate’s degrees <strong>in</strong> STEM fields, compared with<br />
26 percent of American Indian/Alaska Native students,<br />
30 percent each of Black <strong>and</strong> Asian/Pacific Isl<strong>and</strong>er<br />
students, <strong>and</strong> 32 percent of White students. For both<br />
males <strong>and</strong> females, lower percentages of Hispanic<br />
<strong>and</strong> American Indian/Alaska Native students earned<br />
associate’s degrees <strong>in</strong> STEM fields than did White,<br />
Black, or Asian/Pacific Isl<strong>and</strong>er students.<br />
About 25 percent of all 2010 bachelor’s degrees were<br />
conferred <strong>in</strong> STEM fields of study. A higher percentage<br />
of males than females earned bachelor’s degrees <strong>in</strong> STEM<br />
fields (28 vs. 22 percent). This pattern was observed across<br />
Female<br />
all racial/ethnic groups, with the greatest differences<br />
observed between both Hispanic males <strong>and</strong> females <strong>and</strong><br />
Asian/Pacific Isl<strong>and</strong>er males <strong>and</strong> females (7 percentage<br />
po<strong>in</strong>ts each). The smallest difference was observed<br />
between Black males <strong>and</strong> females (2 percentage po<strong>in</strong>ts).<br />
The percentages of bachelor’s degrees conferred <strong>in</strong> STEM<br />
fields also varied across racial/ethnic groups. Some<br />
36 percent of all Asian/Pacific Isl<strong>and</strong>er students earned a<br />
bachelor’s degree <strong>in</strong> a STEM field, compared with<br />
25 percent of White, 23 percent of American Indian/<br />
Alaska Native, 21 percent of Black, <strong>and</strong> 20 percent of<br />
Hispanic students. The same pattern was observed for the<br />
female subset across racial/ethnic groups. Among males,<br />
however, White <strong>and</strong> American Indian/Alaska Native<br />
students earned the same percentage of bachelor’s degrees<br />
<strong>in</strong> STEM fields (27 percent each). A higher percentage<br />
of Hispanic than Black male students earned bachelor’s<br />
degrees <strong>in</strong> STEM fields (24 vs. 22 percent).<br />
Postsecondary <strong>Education</strong><br />
6<br />
Postsecondary <strong>Education</strong> 207
Technical Notes<br />
The overall graduation rate represents the percentage of<br />
full-time, first-time students who began <strong>in</strong> the fall term<br />
<strong>and</strong> graduated from the <strong>in</strong>stitution with<strong>in</strong> 150 percent<br />
of normal program completion time. For a bachelor’s<br />
degree, this represents 6 years. Students who transferred<br />
to another <strong>in</strong>stitution <strong>and</strong> graduated are not counted as<br />
completers at their <strong>in</strong>itial <strong>in</strong>stitution. STEM degrees,<br />
as def<strong>in</strong>ed here, <strong>in</strong>clude mathematics; natural sciences<br />
(<strong>in</strong>clud<strong>in</strong>g physical sciences <strong>and</strong> biological/agricultural<br />
sciences); eng<strong>in</strong>eer<strong>in</strong>g/eng<strong>in</strong>eer<strong>in</strong>g technologies; health<br />
professions <strong>and</strong> related cl<strong>in</strong>ical sciences; <strong>and</strong> computer/<br />
<strong>in</strong>formation sciences. Degree-grant<strong>in</strong>g <strong>in</strong>stitutions grant<br />
associate’s or higher degrees <strong>and</strong> participate <strong>in</strong> Title IV<br />
federal f<strong>in</strong>ancial aid programs. Reported racial/ethnic<br />
distributions of students by level of degree, field of degree,<br />
<strong>and</strong> sex were used to estimate race/ethnicity for students<br />
whose race/ethnicity was not reported. Race categories<br />
exclude persons of Hispanic ethnicity. This <strong>in</strong>dicator<br />
presents <strong>in</strong>formation on Asians <strong>and</strong> Pacific Isl<strong>and</strong>ers as<br />
a comb<strong>in</strong>ed category, because the data were collected <strong>in</strong><br />
a manner that does not permit separate report<strong>in</strong>g. S<strong>in</strong>ce<br />
96 percent of all Asian/Pacific Isl<strong>and</strong>er 5- to 24-year-olds<br />
are Asian, this comb<strong>in</strong>ed category substantially reflects<br />
the situation for Asians, rather than Pacific Isl<strong>and</strong>ers.<br />
For more <strong>in</strong>formation, please see the <strong>in</strong>troduction to this<br />
report.<br />
208 <strong>Higher</strong> <strong>Education</strong>: <strong>Gaps</strong> <strong>in</strong> <strong>Access</strong> <strong>and</strong> <strong>Persistence</strong> <strong>Study</strong>
Table 42-1.<br />
Sex <strong>and</strong> race/ethnicity<br />
Sex<br />
Graduation rates of first-time postsecondary students who started as full-time degree-seek<strong>in</strong>g students, by<br />
time between start<strong>in</strong>g <strong>and</strong> graduat<strong>in</strong>g, sex, <strong>and</strong> race/ethnicity: Cohort years 2004 <strong>and</strong> 2007<br />
Percent complet<strong>in</strong>g<br />
bachelor’s degree<br />
with<strong>in</strong> 4 years<br />
2004 start<strong>in</strong>g cohort 2007 start<strong>in</strong>g cohort<br />
Percent complet<strong>in</strong>g<br />
bachelor’s degree<br />
with<strong>in</strong> 5 years<br />
Percent complet<strong>in</strong>g<br />
bachelor’s degree<br />
with<strong>in</strong> 6 years<br />
Percent complet<strong>in</strong>g<br />
certificates or<br />
associate’s degree<br />
with<strong>in</strong> 150 percent<br />
of normal time<br />
Total 1 37.9 53.9 58.3 29.9<br />
Male 32.9 50.5 55.5 26.4<br />
Female 42.1 56.8 60.6 32.7<br />
42<br />
Race/ethnicity<br />
White 41.1 57.5 61.5 29.5<br />
Black 20.4 34.2 39.5 25.3<br />
Hispanic 27.9 44.0 50.1 33.4<br />
Asian/Pacific Isl<strong>and</strong>er 45.0 62.9 68.7 33.6<br />
American Indian/Alaska Native 21.8 34.7 39.4 25.6<br />
Race/ethnicity by sex<br />
Male<br />
White 35.6 54.0 58.8 27.2<br />
Black 15.0 28.6 34.2 20.4<br />
Hispanic 23.2 39.2 45.6 26.7<br />
Asian/Pacific Isl<strong>and</strong>er 39.9 59.3 65.7 29.7<br />
American Indian/Alaska Native 18.9 31.9 37.5 23.9<br />
Female<br />
White 45.8 60.5 63.8 31.6<br />
Black 24.1 38.1 43.1 28.4<br />
Hispanic 31.3 47.5 53.4 37.9<br />
Asian/Pacific Isl<strong>and</strong>er 49.4 66.0 71.3 37.4<br />
American Indian/Alaska Native 23.9 36.8 40.9 26.8<br />
1<br />
Total <strong>in</strong>cludes other racial/ethnic groups not shown separately <strong>in</strong> the table.<br />
NOTE: Race categories exclude persons of Hispanic ethnicity.<br />
SOURCE: U.S. Department of <strong>Education</strong>, National Center for <strong>Education</strong> Statistics, Integrated Postsecondary <strong>Education</strong> Data System, Spr<strong>in</strong>g 2011,<br />
Graduation Rates component.<br />
Postsecondary <strong>Education</strong><br />
6<br />
Postsecondary <strong>Education</strong> 209
210 <strong>Higher</strong> <strong>Education</strong>: <strong>Gaps</strong> <strong>in</strong> <strong>Access</strong> <strong>and</strong> <strong>Persistence</strong> <strong>Study</strong><br />
Table 42-2.<br />
Sex <strong>and</strong> race/ethnicity<br />
Number <strong>and</strong> percentage distribution of degrees overall <strong>and</strong> number <strong>and</strong> percentage of science, technology, eng<strong>in</strong>eer<strong>in</strong>g, <strong>and</strong> mathematics (STEM)<br />
degrees conferred by postsecondary degree-grant<strong>in</strong>g <strong>in</strong>stitutions, by degree level, sex, <strong>and</strong> race/ethnicity: Academic year 2009–10<br />
Total<br />
number<br />
Number<br />
Percent of<br />
total<br />
Associate’s<br />
Number of<br />
STEM<br />
Percent<br />
STEM<br />
Number<br />
Percent of<br />
total<br />
Bachelor’s<br />
Number of<br />
STEM<br />
Total 1 3,351,049 849,452 25 258,259 30 1,650,014 49 409,618 25<br />
Sex<br />
Male 1,381,351 322,916 23 88,232 27 706,633 51 197,423 28<br />
Female 1,969,698 526,536 27 170,027 32 943,381 48 212,195 22<br />
Race/ethnicity<br />
White 2,269,826 552,863 24 179,132 32 1,167,499 51 288,974 25<br />
Black 365,624 113,905 31 34,107 30 164,844 45 33,986 21<br />
Hispanic 304,147 112,211 37 25,756 23 140,316 46 27,791 20<br />
Asian/Pacific Isl<strong>and</strong>er 220,770 44,021 20 13,355 30 117,422 53 42,429 36<br />
American Indian/Alaska Native 27,648 10,337 37 2,739 26 12,399 45 2,845 23<br />
Race/ethnicity by sex<br />
Male<br />
White 950,697 216,072 23 60,251 28 513,717 54 141,227 27<br />
Black 118,049 36,136 31 10,193 28 56,171 48 12,127 22<br />
Hispanic 116,490 42,232 36 10,009 24 55,092 47 13,344 24<br />
Asian/Pacific Isl<strong>and</strong>er 98,406 18,264 19 5,494 30 53,377 54 21,318 40<br />
American Indian/Alaska Native 10,344 3,624 35 905 25 4,875 47 1,293 27<br />
Percent<br />
STEM<br />
Female<br />
White 1,319,129 336,791 26 118,881 35 653,782 50 147,747 23<br />
Black 247,575 77,769 31 23,914 31 108,673 44 21,859 20<br />
Hispanic 187,657 69,979 37 15,747 23 85,224 45 14,447 17<br />
Asian/Pacific Isl<strong>and</strong>er 122,364 25,757 21 7,861 31 64,045 52 21,111 33<br />
American Indian/Alaska Native 17,304 6,713 39 1,834 27 7,524 43 1,552 21<br />
See notes at end of table.
Table 42-2.<br />
Sex <strong>and</strong> race/ethnicity<br />
Number <strong>and</strong> percentage distribution of degrees overall <strong>and</strong> number <strong>and</strong> percentage of science, technology, eng<strong>in</strong>eer<strong>in</strong>g, <strong>and</strong> mathematics (STEM)<br />
degrees conferred by postsecondary degree-grant<strong>in</strong>g <strong>in</strong>stitutions, by degree level, sex, <strong>and</strong> race/ethnicity: Academic year 2009–10—Cont<strong>in</strong>ued<br />
Total<br />
number<br />
Number<br />
Percent of<br />
total<br />
Master’s<br />
Number of<br />
STEM<br />
Percent<br />
STEM<br />
Number<br />
Percent of<br />
total<br />
Doctor’s<br />
Number of<br />
STEM<br />
Total 1 3,351,049 693,025 21 154,016 22 158,558 5 82,584 52<br />
Sex<br />
Male 1,381,351 275,197 20 70,557 26 76,605 6 39,925 52<br />
Female 1,969,698 417,828 21 83,459 20 81,953 4 42,659 52<br />
Race/ethnicity<br />
White 2,269,826 445,038 20 86,129 19 104,426 5 51,200 49<br />
Black 365,624 76,458 21 11,693 15 10,417 3 4,053 39<br />
Hispanic 304,147 43,535 14 7,304 17 8,085 3 3,412 42<br />
Asian/Pacific Isl<strong>and</strong>er 220,770 42,702 19 13,874 32 16,625 8 11,247 68<br />
American Indian/Alaska Native 27,648 3,960 14 753 19 952 3 397 42<br />
Race/ethnicity by sex<br />
Male<br />
White 950,697 170,203 18 33,999 20 50,705 5 23,839 47<br />
Black 118,049 22,120 19 3,438 16 3,622 3 1,394 38<br />
Hispanic 116,490 15,525 13 3,059 20 3,641 3 1,524 42<br />
Asian/Pacific Isl<strong>and</strong>er 98,406 19,535 20 6,891 35 7,230 7 4,930 68<br />
American Indian/Alaska Native 10,344 1,415 14 268 19 430 4 174 40<br />
Female<br />
White 1,319,129 274,835 21 52,130 19 53,721 4 27,361 51<br />
Black 247,575 54,338 22 8,255 15 6,795 3 2,659 39<br />
Hispanic 187,657 28,010 15 4,245 15 4,444 2 1,888 42<br />
Asian/Pacific Isl<strong>and</strong>er 122,364 23,167 19 6,983 30 9,395 8 6,317 67<br />
American Indian/Alaska Native 17,304 2,545 15 485 19 522 3 223 43<br />
1<br />
Total <strong>in</strong>cludes other racial/ethnic groups not shown separately <strong>in</strong> the table.<br />
NOTE: STEM degrees, as def<strong>in</strong>ed here, <strong>in</strong>clude mathematics; natural sciences (<strong>in</strong>clud<strong>in</strong>g physical sciences <strong>and</strong> biological/agricultural sciences); eng<strong>in</strong>eer<strong>in</strong>g/eng<strong>in</strong>eer<strong>in</strong>g technologies; health professions <strong>and</strong><br />
related cl<strong>in</strong>ical sciences; <strong>and</strong> computer/<strong>in</strong>formation sciences. Degree-grant<strong>in</strong>g <strong>in</strong>stitutions grant associate’s or higher degrees <strong>and</strong> participate <strong>in</strong> Title IV federal f<strong>in</strong>ancial aid programs. Reported racial/ethnic<br />
distributions of students by level of degree, field of degree, <strong>and</strong> sex were used to estimate race/ethnicity for students whose race/ethnicity was not reported. Race categories exclude persons of Hispanic ethnicity.<br />
SOURCE: U.S. Department of <strong>Education</strong>, National Center for <strong>Education</strong> Statistics, Integrated Postsecondary <strong>Education</strong> Data System (IPEDS), Fall 2010, Completions component.<br />
Percent<br />
STEM<br />
Postsecondary <strong>Education</strong> 211<br />
6<br />
Postsecondary <strong>Education</strong><br />
42
Chapter 7<br />
Postsecondary Outcomes <strong>and</strong> Employment<br />
43. <strong>Education</strong>al Atta<strong>in</strong>ment.....................................................................................................214<br />
44. Labor Force Participation...................................................................................................218<br />
45. Median Annual Earn<strong>in</strong>gs....................................................................................................226<br />
46. Employment of Young Adults With STEM Degrees.............................................................232<br />
212 <strong>Higher</strong> <strong>Education</strong>: <strong>Gaps</strong> <strong>in</strong> <strong>Access</strong> <strong>and</strong> <strong>Persistence</strong> <strong>Study</strong>
Chapter 7 exam<strong>in</strong>es postsecondary outcomes for males <strong>and</strong> females across racial/ethnic groups. These <strong>in</strong>dicators<br />
describe differences among adults with vary<strong>in</strong>g levels of educational atta<strong>in</strong>ment, labor force participation, <strong>and</strong> earn<strong>in</strong>gs.<br />
Additionally, <strong>in</strong>formation is presented on undergraduate fields of study <strong>and</strong> on science, technology, eng<strong>in</strong>eer<strong>in</strong>g, <strong>and</strong><br />
mathematics (STEM) occupations.<br />
Postsecondary graduates enter the job market well positioned for labor market success, <strong>and</strong> with<strong>in</strong> a few years most<br />
earn more than their non-postsecondary-go<strong>in</strong>g peers. In general, adults with higher levels of education have higher<br />
median <strong>in</strong>comes <strong>and</strong> lower unemployment rates than their less educated peers. For example, <strong>in</strong> 2009, young adults ages<br />
25–34 with a bachelor’s degree earned more than twice as much as young adults without a high school diploma or its<br />
equivalent, 50 percent more than young adults with a high school diploma or its equivalent, <strong>and</strong> 25 percent more than<br />
young adults with an associate’s degree (NCES 2011).<br />
Unemployment also differs by educational atta<strong>in</strong>ment. In 2010, a smaller percentage of young adults with a bachelor’s<br />
degree or higher were unemployed than were their peers with lower levels of education (NCES 2011). For example,<br />
4 percent of those with a bachelor’s degree or higher were unemployed, compared with 7 percent of those with an<br />
associate’s degree, 10 percent of those with some college education, 13 percent of high school completers, <strong>and</strong> 14 percent<br />
of those who had not completed high school.<br />
Ris<strong>in</strong>g concern about America’s ability to ma<strong>in</strong>ta<strong>in</strong> its competitive position <strong>in</strong> the global economy has renewed <strong>in</strong>terest<br />
<strong>in</strong> STEM education. A recent study compar<strong>in</strong>g postsecondary outcomes of STEM <strong>and</strong> non-STEM postsecondary<br />
entrants 6 years after their <strong>in</strong>itial enrollment found that undergraduates major<strong>in</strong>g <strong>in</strong> STEM fields had a higher rate of<br />
complet<strong>in</strong>g a bachelor’s degree program (35 percent vs. 27–29 percent) <strong>and</strong> a lower rate of leav<strong>in</strong>g a postsecondary<br />
<strong>in</strong>stitution without earn<strong>in</strong>g any degree (27 percent vs. 33–36 percent) than their non-STEM peers (Chen 2009). Recent<br />
data show that STEM employee earn<strong>in</strong>gs are significantly higher than non-STEM employee earn<strong>in</strong>gs, regardless of race,<br />
ethnicity, or nativity.<br />
Postsecondary Outcomes <strong>and</strong> Employment 213
Indicator 43<br />
<strong>Education</strong>al Atta<strong>in</strong>ment<br />
In 2010, the percentage of young adult males ages 25 to 34 who had earned<br />
at least a bachelor’s degree (27 percent) was lower than the correspond<strong>in</strong>g<br />
percentage for their female peers (35 percent). This pattern by sex also held for<br />
Whites, Blacks, Hispanics, <strong>and</strong> persons of two or more races.<br />
Among the more than 41 million young adults ages 25<br />
to 34 <strong>in</strong> 2010, some 13 percent had not completed high<br />
school, 24 percent had completed high school but gone<br />
no further, 32 percent had attended some college or had<br />
earned an associate’s degree, <strong>and</strong> another 31 percent had<br />
earned at least a bachelor’s degree. These percentages varied<br />
by sex, race/ethnicity, nativity, <strong>and</strong> citizenship status.<br />
A higher percentage of males than females had not<br />
completed high school <strong>in</strong> 2010 (15 vs. 11 percent). This<br />
pattern by sex was also observed among White, Black, <strong>and</strong><br />
Hispanic young adults, <strong>and</strong> young adults of two or more<br />
races. For <strong>in</strong>stance, 36 percent of Hispanic young adult<br />
males had not completed high school, compared with 29<br />
percent of their female peers. Concern<strong>in</strong>g race/ethnicity<br />
overall, the percentage of young adults who had not<br />
completed high school was highest for Hispanics (32<br />
percent). This percentage was also higher for American<br />
Indians (17 percent), Alaska Natives (16 percent), <strong>and</strong><br />
Blacks (14 percent) than for Whites (7 percent), Asians<br />
(5 percent), Native Hawaiians/Pacific Isl<strong>and</strong>ers (8 percent),<br />
<strong>and</strong> young adults of two or more races (8 percent).<br />
Differences on this measure also held among the male<br />
<strong>and</strong> female subgroups. For both Hispanic <strong>and</strong> Asian<br />
young adults, the percentage who had not completed high<br />
school was higher for those born outside the United States<br />
than for their peers who were born with<strong>in</strong> the United<br />
States (47 vs. 16 percent <strong>and</strong> 7 vs. 2 percent, respectively).<br />
In terms of citizenship status, a higher percentage of<br />
noncitizens than U.S.-born citizens <strong>and</strong> naturalized<br />
citizens had not completed high school (37 vs. 9 <strong>and</strong><br />
10 percent, respectively).<br />
The percentage of young adults whose highest level of<br />
educational atta<strong>in</strong>ment was high school completion was<br />
higher for males than females both overall (28 vs. 21<br />
percent) <strong>and</strong> for most racial/ethnic groups (with the<br />
exception of Asians <strong>and</strong> Native Hawaiians/Pacific<br />
Isl<strong>and</strong>ers, for whom no measurable differences were found).<br />
For example, 53 percent of Alaska Native males had only<br />
completed high school versus 36 percent of their female<br />
peers. In terms of race/ethnicity, the percentage of young<br />
adults who had only completed high school was higher for<br />
Alaska Natives (43 percent), Native Hawaiians/Pacific<br />
Figure 43-1.<br />
Percentage of young adults ages 25 to 34 whose highest level of educational atta<strong>in</strong>ment was high school<br />
completion, by race/ethnicity <strong>and</strong> sex: 2010<br />
Percent<br />
100<br />
80<br />
60<br />
53<br />
40<br />
20<br />
28<br />
21<br />
27<br />
19<br />
34<br />
25<br />
30<br />
27<br />
11 11<br />
36<br />
33<br />
37<br />
29<br />
36<br />
26<br />
19<br />
0<br />
Total 1 White Black Hispanic Asian Native<br />
Hawaiian/<br />
Pacific Isl<strong>and</strong>er<br />
American<br />
Indian<br />
Alaska Native<br />
Two or more<br />
races<br />
Race/ethnicity<br />
Male<br />
Female<br />
1<br />
Total <strong>in</strong>cludes other racial/ethnic groups not shown separately <strong>in</strong> the figure.<br />
NOTE: High school completion <strong>in</strong>cludes a high school diploma or an equivalent credential, <strong>in</strong>clud<strong>in</strong>g a General <strong>Education</strong>al Development (GED) certificate.<br />
Estimates are for the entire population <strong>in</strong> the <strong>in</strong>dicated age range, <strong>in</strong>clud<strong>in</strong>g persons <strong>in</strong> both households <strong>and</strong> group quarters. A household <strong>in</strong>cludes all<br />
the persons who occupy a hous<strong>in</strong>g unit. A group quarters is a nontypical household-type liv<strong>in</strong>g arrangement where people live or stay <strong>in</strong> a group liv<strong>in</strong>g<br />
arrangement that is owned or managed by an entity or organization provid<strong>in</strong>g hous<strong>in</strong>g <strong>and</strong>/or services for the residents. Group quarters <strong>in</strong>clude such<br />
places as college residence halls, residential treatment centers, skilled nurs<strong>in</strong>g facilities, group homes, military barracks, correctional facilities, <strong>and</strong> workers’<br />
dormitories. Race categories exclude persons of Hispanic ethnicity.<br />
SOURCE: U.S. Department of Commerce, Census Bureau, American Community Survey, 2010.<br />
214 <strong>Higher</strong> <strong>Education</strong>: <strong>Gaps</strong> <strong>in</strong> <strong>Access</strong> <strong>and</strong> <strong>Persistence</strong> <strong>Study</strong>
Figure 43-2.<br />
Percentage of young adults ages 25 to 34 whose highest level of educational atta<strong>in</strong>ment was a<br />
bachelor’s or higher degree, by race/ethnicity <strong>and</strong> sex: 2010<br />
43<br />
Percent<br />
100<br />
80<br />
60<br />
61 63<br />
40<br />
20<br />
27<br />
35<br />
33<br />
42<br />
15<br />
23<br />
11<br />
16<br />
16<br />
12 11 13<br />
30<br />
35<br />
0<br />
Total 1 White Black Hispanic Asian Native American Indian Two or more<br />
Hawaiian/<br />
races<br />
Pacific Isl<strong>and</strong>er<br />
Race/ethnicity<br />
Male<br />
Female<br />
1<br />
Total <strong>in</strong>cludes other racial/ethnic groups not shown separately <strong>in</strong> the figure.<br />
NOTE: Report<strong>in</strong>g st<strong>and</strong>ards for Alaska Native males <strong>and</strong> females were not met; therefore, data for these groups are not shown <strong>in</strong> the figure. Estimates<br />
are for the entire population <strong>in</strong> the <strong>in</strong>dicated age range, <strong>in</strong>clud<strong>in</strong>g persons <strong>in</strong> both households <strong>and</strong> group quarters. A household <strong>in</strong>cludes all the<br />
persons who occupy a hous<strong>in</strong>g unit. A group quarters is a nontypical household-type liv<strong>in</strong>g arrangement where people live or stay <strong>in</strong> a group liv<strong>in</strong>g<br />
arrangement that is owned or managed by an entity or organization provid<strong>in</strong>g hous<strong>in</strong>g <strong>and</strong>/or services for the residents. Group quarters <strong>in</strong>clude such<br />
places as college residence halls, residential treatment centers, skilled nurs<strong>in</strong>g facilities, group homes, military barracks, correctional facilities, <strong>and</strong><br />
workers’ dormitories. Race categories exclude persons of Hispanic ethnicity.<br />
SOURCE: U.S. Department of Commerce, Census Bureau, American Community Survey, 2010.<br />
Isl<strong>and</strong>ers (35 percent), <strong>and</strong> American Indians (33 percent)<br />
than for Whites (23 percent), Blacks (30 percent),<br />
Hispanics (28 percent), <strong>and</strong> persons of two or more races<br />
(22 percent). Differences by race/ethnicity were also<br />
observed among both male <strong>and</strong> female young adults who<br />
had completed only high school. For both Hispanics <strong>and</strong><br />
Asians, the percentage whose highest level of educational<br />
atta<strong>in</strong>ment was high school completion was equivalent for<br />
those born with<strong>in</strong> the United States <strong>and</strong> their peers who<br />
were born outside the United States. Concern<strong>in</strong>g<br />
citizenship status, a lower percentage of naturalized citizens<br />
than U.S.-born citizens <strong>and</strong> noncitizens had completed<br />
only high school (20 vs. 25 <strong>and</strong> 24 percent, respectively).<br />
The percentage of young adults whose highest level of<br />
educational atta<strong>in</strong>ment was a bachelor’s or higher degree<br />
was lower for males than for females overall (27 vs. 35<br />
percent) as well as for Whites, Blacks, Hispanics, <strong>and</strong><br />
persons of two or more races. For <strong>in</strong>stance, 15 percent<br />
of Black males had earned at least a bachelor’s degree,<br />
Technical Notes<br />
Estimates are for the entire population <strong>in</strong> the <strong>in</strong>dicated<br />
age range, <strong>in</strong>clud<strong>in</strong>g persons <strong>in</strong> both households <strong>and</strong><br />
group quarters. A household <strong>in</strong>cludes all the persons who<br />
occupy a hous<strong>in</strong>g unit. A group quarters is a nontypical<br />
household-type liv<strong>in</strong>g arrangement where people live or<br />
stay <strong>in</strong> a group liv<strong>in</strong>g arrangement that is owned or<br />
managed by an entity or organization provid<strong>in</strong>g hous<strong>in</strong>g<br />
<strong>and</strong>/or services for the residents. Group quarters <strong>in</strong>clude<br />
such places as college residence halls, residential treatment<br />
compared with 23 percent of Black females. Across the<br />
racial/ethnic groups, the percentage of young adults<br />
who had obta<strong>in</strong>ed at least a bachelor’s degree was higher<br />
for Asians (62 percent) <strong>and</strong> Whites (37 percent) than<br />
for Blacks (19 percent), Hispanics (13 percent), Native<br />
Hawaiians/Pacific Isl<strong>and</strong>ers (14 percent), American<br />
Indians (12 percent), <strong>and</strong> persons of two or more races<br />
(32 percent). Differences by race/ethnicity were also<br />
observed among both male <strong>and</strong> female young adults<br />
who had earned a bachelor’s or higher degree. A lower<br />
percentage of Hispanics who were born outside of the<br />
United States had earned at least a bachelor’s degree than<br />
their Hispanic peers who were born with<strong>in</strong> the United<br />
States (8 vs. 18 percent). No measurable difference was<br />
observed, however, between U.S.-born Asians <strong>and</strong> their<br />
non-U.S.-born peers. <strong>Higher</strong> percentages of U.S.-born<br />
<strong>and</strong> naturalized citizens than noncitizens had earned at<br />
least a bachelor’s degree (32 <strong>and</strong> 38 percent vs. 24 percent,<br />
respectively); the percentage for naturalized citizens was<br />
also higher than that for U.S.-born citizens.<br />
centers, skilled nurs<strong>in</strong>g facilities, group homes, military<br />
barracks, correctional facilities, <strong>and</strong> workers’ dormitories.<br />
High school completion <strong>in</strong>cludes a high school diploma or<br />
an equivalent credential, <strong>in</strong>clud<strong>in</strong>g a General <strong>Education</strong>al<br />
Development (GED) certificate. Born with<strong>in</strong> the United<br />
States refers to the 50 states, the District of Columbia,<br />
Puerto Rico, Guam, the U.S. Virg<strong>in</strong> Isl<strong>and</strong>s, the Northern<br />
Marianas, <strong>and</strong> those born abroad of American parents.<br />
Outcomes <strong>and</strong> Employment<br />
7<br />
Postsecondary Outcomes <strong>and</strong> Employment 215
216 <strong>Higher</strong> <strong>Education</strong>: <strong>Gaps</strong> <strong>in</strong> <strong>Access</strong> <strong>and</strong> <strong>Persistence</strong> <strong>Study</strong><br />
Table 43-1. Number <strong>and</strong> percentage of young adults ages 25 to 34, by highest level of educational atta<strong>in</strong>ment, sex, race/ethnicity, nativity, <strong>and</strong> citizenship<br />
status: 2010<br />
Sex, race/ethnicity, nativity, <strong>and</strong> citizenship status<br />
Sex<br />
Total, number<br />
Less than<br />
high school<br />
completion,<br />
percent<br />
Total<br />
High school completion or higher, percent<br />
High school<br />
completion only 1<br />
Some college<br />
or associate’s<br />
degree<br />
Bachelor’s or<br />
higher degree<br />
Total 2 40,886,000 12.9 87.1 24.3 31.6 31.2<br />
Male 20,494,000 14.9 85.1 27.6 30.2 27.3<br />
Female 20,392,000 10.9 89.1 21.0 33.0 35.2<br />
Race/ethnicity<br />
White 23,713,000 6.6 93.4 23.0 33.1 37.4<br />
Black 5,168,000 13.9 86.1 29.6 37.5 19.0<br />
Hispanic 8,397,000 32.5 67.5 28.5 26.0 13.0<br />
Asian 2,431,000 5.5 94.5 11.1 21.1 62.3<br />
Native Hawaiian/Pacific Isl<strong>and</strong>er 76,000 7.7 92.3 34.8 43.5 13.9<br />
American Indian/Alaska Native 3 277,000 16.8 83.2 32.7 38.4 12.1<br />
American Indian 229,000 16.9 83.1 32.8 38.2 12.1<br />
Alaska Native 15,000 15.7 84.3 43.1 36.0 ‡<br />
Two or more races 735,000 8.2 91.8 22.3 37.0 32.5<br />
Race/ethnicity by sex<br />
Male<br />
White 11,969,000 7.8 92.2 26.8 32.5 32.9<br />
Black 2,438,000 17.0 83.0 34.3 33.8 14.9<br />
Hispanic 4,376,000 35.8 64.2 29.9 23.8 10.5<br />
Asian 1,133,000 5.7 94.3 11.5 21.6 61.2<br />
Native Hawaiian/Pacific Isl<strong>and</strong>er 40,000 ‡ 92.2 36.1 40.4 15.7<br />
American Indian/Alaska Native 3 137,000 18.5 81.5 37.6 33.6 10.2<br />
American Indian 113,000 18.6 81.4 37.3 33.5 10.6<br />
Alaska Native 6,000 ‡ 82.6 52.9 ‡ ‡<br />
Two or more races 358,000 9.7 90.3 26.1 34.6 29.6<br />
Female<br />
White 11,744,000 5.4 94.6 19.0 33.7 41.9<br />
Black 2,730,000 11.2 88.8 25.4 40.7 22.7<br />
Hispanic 4,021,000 28.8 71.2 26.9 28.5 15.8<br />
Asian 1,298,000 5.2 94.8 10.7 20.7 63.3<br />
Native Hawaiian/Pacific Isl<strong>and</strong>er 36,000 ‡ 92.4 33.4 47.1 11.9<br />
American Indian/Alaska Native 3 140,000 15.0 85.0 27.9 43.2 13.9<br />
American Indian 116,000 15.1 84.9 28.5 42.9 13.5<br />
Alaska Native 8,000 ‡ 85.6 35.6 42.5 ‡<br />
Two or more races 377,000 6.7 93.3 18.7 39.4 35.3<br />
See notes at end of table.
Table 43-1. Number <strong>and</strong> percentage of young adults ages 25 to 34, by highest level of educational atta<strong>in</strong>ment, sex, race/ethnicity, nativity, <strong>and</strong> citizenship<br />
status: 2010—Cont<strong>in</strong>ued<br />
Sex, race/ethnicity, nativity, <strong>and</strong> citizenship status<br />
Nativity<br />
Total, number<br />
Less than<br />
high school<br />
completion,<br />
percent<br />
Total<br />
High school completion or higher, percent<br />
High school<br />
completion only 1<br />
Some college<br />
or associate’s<br />
degree<br />
Bachelor’s or<br />
higher degree<br />
Total 2 40,886,000 12.9 87.1 24.3 31.6 31.2<br />
Hispanic<br />
Born with<strong>in</strong> the United States 4 4,036,000 16.4 83.6 28.7 36.8 18.1<br />
Born outside of the United States 4,361,000 47.3 52.7 28.2 16.1 8.3<br />
Asian<br />
Born with<strong>in</strong> the United States 4 647,000 2.3 97.7 10.6 26.4 60.6<br />
Born outside of the United States 1,784,000 6.6 93.4 11.3 19.2 62.9<br />
Citizenship status<br />
U.S.-born citizen 33,477,000 9.0 91.0 24.9 34.4 31.7<br />
Naturalized citizen 2,060,000 10.1 89.9 20.0 31.8 38.1<br />
Noncitizen 5,751,000 37.4 62.6 23.7 15.0 23.9<br />
‡ Report<strong>in</strong>g st<strong>and</strong>ards not met. There are either too few cases or the coefficient of variation (CV) is 50 percent or greater.<br />
1<br />
Includes a high school diploma or an equivalent credential, <strong>in</strong>clud<strong>in</strong>g a General <strong>Education</strong>al Development (GED) certificate.<br />
2<br />
Total <strong>in</strong>cludes other racial/ethnic groups not shown separately <strong>in</strong> the table.<br />
3<br />
Includes persons report<strong>in</strong>g American Indian alone, Alaska Native alone, <strong>and</strong> persons from American Indian <strong>and</strong>/or Alaska Native tribes specified or unspecified.<br />
4<br />
Includes the 50 states, the District of Columbia, Puerto Rico, Guam, the U.S. Virg<strong>in</strong> Isl<strong>and</strong>s, <strong>and</strong> the Northern Marianas. Also <strong>in</strong>cludes those born abroad of American parents.<br />
NOTE: Estimates are for the entire population <strong>in</strong> the <strong>in</strong>dicated age range, <strong>in</strong>clud<strong>in</strong>g persons <strong>in</strong> both households <strong>and</strong> group quarters. A household <strong>in</strong>cludes all the persons who occupy a hous<strong>in</strong>g unit. A group<br />
quarters is a nontypical household-type liv<strong>in</strong>g arrangement where people live or stay <strong>in</strong> a group liv<strong>in</strong>g arrangement that is owned or managed by an entity or organization provid<strong>in</strong>g hous<strong>in</strong>g <strong>and</strong>/or services for<br />
the residents. Group quarters <strong>in</strong>clude such places as college residence halls, residential treatment centers, skilled nurs<strong>in</strong>g facilities, group homes, military barracks, correctional facilities, <strong>and</strong> workers’ dormitories.<br />
Detail may not sum to totals because of round<strong>in</strong>g. Race categories exclude persons of Hispanic ethnicity.<br />
SOURCE: U.S. Department of Commerce, Census Bureau, American Community Survey, 2010.<br />
Postsecondary Outcomes <strong>and</strong> Employment 217<br />
7<br />
Outcomes <strong>and</strong> Employment<br />
43
Indicator 44<br />
Labor Force Participation<br />
Eighty-five percent of young adults ages 25 to 34 with a bachelor’s or higher<br />
degree were employed <strong>in</strong> 2010. The percentage of these young adults who were<br />
employed was higher for males than females <strong>in</strong> that year (89 vs. 82 percent);<br />
however, the percentage who were unemployed did not differ measurably between<br />
males <strong>and</strong> females (5 vs. 4 percent).<br />
In 2010, about 73 percent of young adults ages 25 to<br />
34 were employed, 9 percent were unemployed, <strong>and</strong> 18<br />
percent were not <strong>in</strong> the labor force. These percentages<br />
varied by demographic characteristics such as highest level<br />
of educational atta<strong>in</strong>ment, sex, race/ethnicity, nativity,<br />
<strong>and</strong> citizenship status.<br />
For young adults who had not completed high school, a<br />
higher percentage of males than females were employed <strong>in</strong><br />
2010 (63 vs. 40 percent). This pattern by sex also held<br />
among Whites <strong>and</strong> Hispanics with this level of<br />
educational atta<strong>in</strong>ment. For <strong>in</strong>stance, the percentages for<br />
Hispanic males <strong>and</strong> females were 77 <strong>and</strong> 42 percent,<br />
respectively. A few measurable differences by race <strong>in</strong> the<br />
percentage employed were found among male young<br />
adults who had not completed high school, whereas none<br />
were found among their female peers. A higher percentage<br />
of Hispanic young adults who were born outside the<br />
United States <strong>and</strong> had not completed high school were<br />
employed than their U.S.-born peers (66 vs. 49 percent).<br />
Among those who did not complete high school, higher<br />
percentages of naturalized citizens <strong>and</strong> noncitizens were<br />
employed than their peers who were U.S.-born citizens<br />
(66 <strong>and</strong> 65 vs. 44 percent, respectively).<br />
Among young adults whose highest level of educational<br />
atta<strong>in</strong>ment was high school completion, 67 percent<br />
were employed <strong>in</strong> 2010 overall, with a higher rate of<br />
employment for males than for females (72 vs. 60 percent).<br />
This difference by sex was also observed among Whites<br />
<strong>and</strong> Hispanics. For example, 78 percent of Hispanic<br />
males with only a high school credential were employed,<br />
compared with 58 percent of Hispanic females with this<br />
level of education. Concern<strong>in</strong>g racial/ethnic differences,<br />
a lower percentage of Blacks who had only completed<br />
high school were employed (56 percent) than were their<br />
White (69 percent), Hispanic (69 percent), <strong>and</strong> Asian (67<br />
percent) peers. Differences <strong>in</strong> the percentage employed<br />
Figure 44-1.<br />
Employment of young adults ages 25 to 34 whose highest level of educational atta<strong>in</strong>ment was high<br />
school completion, by race/ethnicity <strong>and</strong> sex: 2010<br />
Percent<br />
100<br />
80<br />
72<br />
74<br />
78<br />
60<br />
60<br />
62<br />
52<br />
59<br />
58<br />
40<br />
20<br />
0<br />
Total 1 White Black Hispanic<br />
Race/ethnicity<br />
Male<br />
Female<br />
1<br />
Total <strong>in</strong>cludes other racial/ethnic groups not shown separately <strong>in</strong> the figure.<br />
NOTE: Estimates are for the entire population <strong>in</strong> the <strong>in</strong>dicated age range, <strong>in</strong>clud<strong>in</strong>g persons <strong>in</strong> both households <strong>and</strong> group quarters. A household <strong>in</strong>cludes<br />
all the persons who occupy a hous<strong>in</strong>g unit. A group quarters is a nontypical household-type liv<strong>in</strong>g arrangement where people live or stay <strong>in</strong> a group liv<strong>in</strong>g<br />
arrangement that is owned or managed by an entity or organization provid<strong>in</strong>g hous<strong>in</strong>g <strong>and</strong>/or services for the residents. Group quarters <strong>in</strong>clude such<br />
places as college residence halls, residential treatment centers, skilled nurs<strong>in</strong>g facilities, group homes, military barracks, correctional facilities, <strong>and</strong> workers’<br />
dormitories. Employment status refers to the full calendar week prior to the week when the respondent answered the questions. High school completion<br />
<strong>in</strong>cludes a high school diploma or an equivalent credential, <strong>in</strong>clud<strong>in</strong>g a General <strong>Education</strong>al Development (GED) certificate. Detail may not sum to totals<br />
because of round<strong>in</strong>g. Report<strong>in</strong>g st<strong>and</strong>ards for some data for Asian females, Native Hawaiian/Pacific Isl<strong>and</strong>er males <strong>and</strong> females, American Indian males<br />
<strong>and</strong> females, <strong>and</strong> Alaska Native males <strong>and</strong> females, as well as females of two or more races were not met; therefore, data for males <strong>and</strong> females <strong>in</strong> these<br />
racial groups are not shown <strong>in</strong> the figure. Race categories exclude persons of Hispanic ethnicity.<br />
SOURCE: U.S. Department of Commerce, Census Bureau, American Community Survey (ACS), 2010.<br />
218 <strong>Higher</strong> <strong>Education</strong>: <strong>Gaps</strong> <strong>in</strong> <strong>Access</strong> <strong>and</strong> <strong>Persistence</strong> <strong>Study</strong>
Figure 44-2.<br />
Percent<br />
Employment of young adults ages 25 to 34 whose highest level of educational atta<strong>in</strong>ment was a<br />
bachelor’s or higher degree, by race/ethnicity <strong>and</strong> sex: 2010<br />
44<br />
100<br />
80<br />
89<br />
82<br />
90<br />
84 85 83<br />
88<br />
79<br />
85<br />
67<br />
60<br />
40<br />
20<br />
0<br />
Total 1 White Black Hispanic Asian<br />
Race/ethnicity<br />
Male<br />
Female<br />
1<br />
Total <strong>in</strong>cludes other racial/ethnic groups not shown separately <strong>in</strong> the figure.<br />
NOTE: Estimates are for the entire population <strong>in</strong> the <strong>in</strong>dicated age range, <strong>in</strong>clud<strong>in</strong>g persons <strong>in</strong> both households <strong>and</strong> group quarters. A household <strong>in</strong>cludes<br />
all the persons who occupy a hous<strong>in</strong>g unit. A group quarters is a nontypical household-type liv<strong>in</strong>g arrangement where people live or stay <strong>in</strong> a group liv<strong>in</strong>g<br />
arrangement that is owned or managed by an entity or organization provid<strong>in</strong>g hous<strong>in</strong>g <strong>and</strong>/or services for the residents. Group quarters <strong>in</strong>clude such<br />
places as college residence halls, residential treatment centers, skilled nurs<strong>in</strong>g facilities, group homes, military barracks, correctional facilities, <strong>and</strong> workers’<br />
dormitories. Employment status refers to the full calendar week prior to the week when the respondent answered the questions. Report<strong>in</strong>g st<strong>and</strong>ards were<br />
not met for some data for Native Hawaiians/Pacific Isl<strong>and</strong>ers, American Indians/Alaska Natives, American Indians, Alaska Natives, <strong>and</strong> males of two or more<br />
races; therefore, data for males <strong>and</strong> females <strong>in</strong> these racial groups are not shown <strong>in</strong> the figure. Race categories exclude persons of Hispanic ethnicity. Detail<br />
may not sum to totals because of round<strong>in</strong>g.<br />
SOURCE: U.S. Department of Commerce, Census Bureau, American Community Survey (ACS), 2010.<br />
were also observed among males. No measurable<br />
differences <strong>in</strong> employment rates were found among<br />
females <strong>in</strong> the various racial/ethnic groups, nor were<br />
measurable differences found by nativity or citizenship<br />
status.<br />
For young adults whose highest level of atta<strong>in</strong>ment was<br />
at least a bachelor’s degree, 85 percent were employed <strong>in</strong><br />
2010 overall, with a higher employment rate for males<br />
than for females (89 vs. 82 percent). In addition, higher<br />
percentages of White, Hispanic, <strong>and</strong> Asian males than<br />
females with a bachelor’s or higher degree were employed.<br />
For example, 85 percent of Asian males with at least a<br />
bachelor’s degree were employed, compared with 67<br />
percent of their female counterparts. In terms of overall<br />
racial/ethnic differences, higher percentages of White (87<br />
percent), Black (84 percent), <strong>and</strong> Hispanic young adults<br />
(83 percent) were employed than were their Asian peers<br />
(75 percent). Although no measurable differences <strong>in</strong><br />
employment percentages were observed by race/ethnicity<br />
among male young adults with a bachelor’s or higher<br />
degree, racial/ethnic differences among females generally<br />
reflected the overall pattern. <strong>Higher</strong> percentages of<br />
Hispanic <strong>and</strong> Asian young adults with a bachelor’s or<br />
higher degree who were born with<strong>in</strong> the United States<br />
were employed than were their peers who were born<br />
outside the United States (86 vs. 77 percent <strong>and</strong> 84 vs.<br />
73 percent, respectively). Noncitizens with a bachelor’s or<br />
higher degree had a lower employment rate than did their<br />
counterparts who were U.S.-born citizens <strong>and</strong> naturalized<br />
citizens (70 vs. 87 <strong>and</strong> 82 percent, respectively).<br />
Thirteen percent of young adults who had not completed<br />
high school were unemployed <strong>in</strong> 2010. There were no<br />
measurable differences <strong>in</strong> this percentage by sex overall or<br />
by race/ethnicity. Among the few differences observed<br />
among the male <strong>and</strong> female subgroups, higher percentages<br />
of Black males <strong>and</strong> White males than Hispanic males<br />
who had not completed high school were unemployed (20<br />
<strong>and</strong> 18 vs. 10 percent, respectively). A lower percentage of<br />
Hispanic young adults who were born outside the United<br />
States <strong>and</strong> had not completed high school were<br />
unemployed than their U.S.-born peers (8 vs. 16 percent).<br />
Lower percentages of naturalized citizens <strong>and</strong> noncitizens<br />
were unemployed than their peers who were U.S.-born<br />
citizens (8 <strong>and</strong> 9 vs. 17 percent, respectively).<br />
Twelve percent of young adults whose highest level of<br />
educational atta<strong>in</strong>ment was high school completion were<br />
unemployed <strong>in</strong> 2010; this percentage was higher for males<br />
than females (13 vs. 11 percent). There were no measurable<br />
differences by sex <strong>in</strong> the percentage unemployed with<strong>in</strong><br />
specific racial/ethnic groups. A higher percentage of Blacks<br />
who had only completed high school were unemployed (18<br />
percent) than were both their White (11 percent) <strong>and</strong><br />
Hispanic peers (10 percent). Similar racial/ethnic<br />
unemployment patterns were observed among both males<br />
<strong>and</strong> females. U.S.-born citizens with only a high school<br />
credential had a higher unemployment rate than their<br />
peers who were noncitizens (13 vs. 9 percent); no<br />
measurable differences <strong>in</strong> unemployment were observed<br />
with regard to nativity.<br />
Outcomes <strong>and</strong> Employment<br />
7<br />
Postsecondary Outcomes <strong>and</strong> Employment 219
Five percent of young adults who had earned a bachelor’s<br />
or higher degree were unemployed <strong>in</strong> 2010. A higher<br />
percentage of Blacks than Whites with at least a bachelor’s<br />
degree were unemployed (8 vs. 4 percent); this racial/<br />
Technical Notes<br />
Estimates are for the entire population <strong>in</strong> the <strong>in</strong>dicated<br />
age range, <strong>in</strong>clud<strong>in</strong>g persons <strong>in</strong> both households <strong>and</strong><br />
group quarters. A household <strong>in</strong>cludes all the persons who<br />
occupy a hous<strong>in</strong>g unit. A group quarters is a nontypical<br />
household-type liv<strong>in</strong>g arrangement where people live<br />
or stay <strong>in</strong> a group liv<strong>in</strong>g arrangement that is owned or<br />
managed by an entity or organization provid<strong>in</strong>g hous<strong>in</strong>g<br />
<strong>and</strong>/or services for the residents. Group quarters <strong>in</strong>clude<br />
such places as college residence halls, residential treatment<br />
centers, skilled nurs<strong>in</strong>g facilities, group homes, military<br />
ethnic pattern was also observed among females. No<br />
other measurable differences were found among bachelor’s<br />
or higher degree earners across the other demographic<br />
characteristics.<br />
barracks, correctional facilities, <strong>and</strong> workers’ dormitories.<br />
High school completion <strong>in</strong>cludes a high school diploma or<br />
an equivalent credential, <strong>in</strong>clud<strong>in</strong>g a General <strong>Education</strong>al<br />
Development (GED) certificate. Labor force status refers<br />
to the full calendar week prior to the week when the<br />
respondent answered the questions. Born with<strong>in</strong> the<br />
United States refers to the 50 states, the District of<br />
Columbia, Puerto Rico, Guam, the U.S. Virg<strong>in</strong> Isl<strong>and</strong>s,<br />
the Northern Marianas, <strong>and</strong> those born abroad of<br />
American parents.<br />
220 <strong>Higher</strong> <strong>Education</strong>: <strong>Gaps</strong> <strong>in</strong> <strong>Access</strong> <strong>and</strong> <strong>Persistence</strong> <strong>Study</strong>
44<br />
This page <strong>in</strong>tentionally left blank.<br />
Outcomes <strong>and</strong> Employment<br />
7<br />
Postsecondary Outcomes <strong>and</strong> Employment 221
Table 44-1.<br />
Labor force status of young adults ages 25 to 34, by highest level of educational atta<strong>in</strong>ment, sex, race/<br />
ethnicity, nativity, <strong>and</strong> citizenship status: 2010<br />
Total<br />
Less than high school completion<br />
Sex, race/ethnicity, nativity, <strong>and</strong><br />
In the labor force<br />
Not <strong>in</strong> the<br />
In the labor force<br />
Not <strong>in</strong> the<br />
citizenship status<br />
Employed Unemployed labor force Employed Unemployed labor force<br />
Total 2 73.4 9.0 17.7 53.4 13.4 33.2<br />
Sex<br />
Male 77.6 10.0 12.5 62.9 13.9 23.3<br />
Female 69.1 8.0 22.9 40.4 12.8 46.8<br />
Race/ethnicity<br />
White 77.1 7.7 15.2 48.2 16.0 35.8<br />
Black 63.1 15.0 21.9 32.4 21.0 46.6<br />
Hispanic 70.2 9.1 20.7 62.2 10.2 27.6<br />
Asian 72.6 6.3 21.1 ‡ ‡ ‡<br />
Native Hawaiian/Pacific Isl<strong>and</strong>er ‡ ‡ ‡ ‡ ‡ ‡<br />
American Indian/Alaska Native 3 57.8 13.2 ! 29.1 ‡ ‡ 49.1<br />
American Indian 58.4 13.1 ! 28.5 ‡ ‡ ‡<br />
Alaska Native ‡ ‡ ‡ ‡ ‡ ‡<br />
Two or more races 69.7 11.2 19.1 43.1 ! 14.6 ! 42.2 !<br />
Race/ethnicity by sex<br />
Male<br />
White 80.8 9.0 10.2 55.4 17.6 27.0<br />
Black 58.5 16.2 25.2 27.9 20.0 52.1<br />
Hispanic 79.6 9.6 10.9 77.1 10.2 12.7<br />
Asian 81.3 6.5 12.2 ‡ ‡ ‡<br />
Native Hawaiian/Pacific Isl<strong>and</strong>er 74.4 ! ‡ ‡ ‡ ‡ ‡<br />
American Indian/Alaska Native 3 56.5 15.1 ! 28.4 ‡ ‡ 48.7 !<br />
American Indian 56.7 14.9 ! 28.4 ‡ ‡ 49.7 !<br />
Alaska Native ‡ ‡ ‡ ‡ ‡ ‡<br />
Two or more races 72.1 12.0 15.9 46.5 ! ‡ 37.6 !<br />
Female<br />
White 73.3 6.4 20.3 37.4 13.7 48.9<br />
Black 67.2 13.8 19.0 38.5 22.3 39.2<br />
Hispanic 60.1 8.7 31.3 42.1 10.1 47.8<br />
Asian 65.0 6.2 28.9 ‡ ‡ ‡<br />
Native Hawaiian/Pacific Isl<strong>and</strong>er 64.2 ‡ ‡ ‡ ‡ ‡<br />
American Indian/Alaska Native 3 59.0 11.3 ! 29.8 ‡ ‡ 49.4 !<br />
American Indian 60.0 11.4 ! 28.6 ‡ ‡ ‡<br />
Alaska Native ‡ ‡ ‡ ‡ ‡ ‡<br />
Two or more races 67.5 10.4 22.1 ‡ ‡ ‡<br />
Nativity<br />
Hispanic<br />
Born with<strong>in</strong> the United States 4 70.6 10.3 19.1 49.0 15.7 35.3<br />
Born outside the United States 69.8 8.0 22.1 66.5 8.4 25.2<br />
Asian<br />
Born with<strong>in</strong> the United States 4 79.5 7.2 13.3 ‡ ‡ ‡<br />
Born outside the United States 70.1 6.0 23.9 ‡ ‡ ‡<br />
Citizenship status<br />
U.S.-born citizen 74.2 9.2 16.6 43.9 17.3 38.8<br />
Naturalized citizen 77.1 7.3 15.6 66.4 8.2 25.5<br />
Noncitizen 67.5 7.9 24.7 65.2 8.6 ! 26.1<br />
See notes at end of table.<br />
222 <strong>Higher</strong> <strong>Education</strong>: <strong>Gaps</strong> <strong>in</strong> <strong>Access</strong> <strong>and</strong> <strong>Persistence</strong> <strong>Study</strong>
Table 44-1.<br />
Labor force status of young adults ages 25 to 34, by highest level of educational atta<strong>in</strong>ment, sex, race/<br />
ethnicity, nativity, <strong>and</strong> citizenship status: 2010—Cont<strong>in</strong>ued<br />
Total High school completion 1<br />
Sex, race/ethnicity, nativity,<br />
In the labor force<br />
Not <strong>in</strong> the<br />
In the labor force<br />
Not <strong>in</strong> the<br />
<strong>and</strong> citizenship status<br />
Employed Unemployed labor force Employed Unemployed labor force<br />
Total 2 73.4 9.0 17.7 66.6 12.1 21.3<br />
Sex<br />
Male 77.6 10.0 12.5 71.6 13.3 15.2<br />
Female 69.1 8.0 22.9 60.0 10.6 29.5<br />
44<br />
Race/ethnicity<br />
White 77.1 7.7 15.2 69.2 11.4 19.4<br />
Black 63.1 15.0 21.9 55.6 17.9 26.5<br />
Hispanic 70.2 9.1 20.7 68.7 9.9 21.4<br />
Asian 72.6 6.3 21.1 67.0 8.8 ! 24.2<br />
Native Hawaiian/Pacific Isl<strong>and</strong>er ‡ ‡ ‡ 63.8 ! ‡ ‡<br />
American Indian/Alaska Native 3 57.8 13.2 ! 29.1 ‡ ‡ ‡<br />
American Indian 58.4 13.1 ! 28.5 53.6 15.8 30.6 !<br />
Alaska Native ‡ ‡ ‡ ‡ ‡ ‡<br />
Two or more races 69.7 11.2 19.1 59.1 16.8 ! 24.1<br />
Race/ethnicity by sex<br />
Male<br />
White 80.8 9.0 10.2 74.3 12.6 13.0<br />
Black 58.5 16.2 25.2 52.5 19.3 28.2<br />
Hispanic 79.6 9.6 10.9 77.9 10.7 11.4<br />
Asian 81.3 6.5 12.2 76.3 9.3 ! 14.5 !<br />
Native Hawaiian/Pacific Isl<strong>and</strong>er 74.4 ! ‡ ‡ ‡ ‡ ‡<br />
American Indian/Alaska Native 3 56.5 15.1 ! 28.4 ‡ ‡ ‡<br />
American Indian 56.7 14.9 ! 28.4 ‡ ‡ ‡<br />
Alaska Native ‡ ‡ ‡ ‡ ‡ ‡<br />
Two or more races 72.1 12.0 15.9 63.8 18.8 ! 17.3 !<br />
Female<br />
White 73.3 6.4 20.3 61.7 9.6 28.6<br />
Black 67.2 13.8 19.0 59.4 16.1 24.5<br />
Hispanic 60.1 8.7 31.3 57.5 8.8 33.6<br />
Asian 65.0 6.2 28.9 ‡ ‡ ‡<br />
Native Hawaiian/Pacific Isl<strong>and</strong>er 64.2 ‡ ‡ ‡ ‡ ‡<br />
American Indian/Alaska Native 3 59.0 11.3 ! 29.8 ‡ ‡ ‡<br />
American Indian 60.0 11.4 ! 28.6 ‡ ‡ ‡<br />
Alaska Native ‡ ‡ ‡ ‡ ‡ ‡<br />
Two or more races 67.5 10.4 22.1 ‡ ‡ ‡<br />
Nativity<br />
Hispanic<br />
Born with<strong>in</strong> the United States 4 70.6 10.3 19.1 66.8 11.7 21.5<br />
Born outside the United States 69.8 8.0 22.1 70.5 8.1 21.4<br />
Asian<br />
Born with<strong>in</strong> the United States 4 79.5 7.2 13.3 ‡ ‡ ‡<br />
Born outside the United States 70.1 6.0 23.9 65.8 8.4 ! 25.8<br />
Citizenship status<br />
U.S.-born citizen 74.2 9.2 16.6 66.0 12.8 21.2<br />
Naturalized citizen 77.1 7.3 15.6 73.1 8.4 18.5<br />
Noncitizen 67.5 7.9 24.7 68.2 8.9 ! 22.9<br />
See notes at end of table.<br />
Outcomes <strong>and</strong> Employment<br />
7<br />
Postsecondary Outcomes <strong>and</strong> Employment 223
Table 44-1.<br />
Labor force status of young adults ages 25 to 34, by highest level of educational atta<strong>in</strong>ment, sex, race/<br />
ethnicity, nativity, <strong>and</strong> citizenship status: 2010—Cont<strong>in</strong>ued<br />
Total<br />
Some college or associate’s degree<br />
Sex, race/ethnicity, nativity, <strong>and</strong><br />
In the labor force<br />
Not <strong>in</strong> the<br />
In the labor force<br />
Not <strong>in</strong> the<br />
citizenship status<br />
Employed Unemployed labor force Employed Unemployed labor force<br />
Total 2 73.4 9.0 17.7 75.2 9.1 15.7<br />
Sex<br />
Male 77.6 10.0 12.5 79.8 9.6 10.6<br />
Female 69.1 8.0 22.9 71.0 8.6 20.4<br />
Race/ethnicity<br />
White 77.1 7.7 15.2 77.1 7.8 15.1<br />
Black 63.1 15.0 21.9 69.9 13.9 16.2<br />
Hispanic 70.2 9.1 20.7 75.6 8.7 15.7<br />
Asian 72.6 6.3 21.1 70.5 8.2 21.3<br />
Native Hawaiian/Pacific Isl<strong>and</strong>er ‡ ‡ ‡ 73.3 ! ‡ ‡<br />
American Indian/Alaska Native 3 57.8 13.2 ! 29.1 63.7 12.3 ! 23.9<br />
American Indian 58.4 13.1 ! 28.5 69.9 13.1 ! 17.1 !<br />
Alaska Native ‡ ‡ ‡ ‡ ‡ ‡<br />
Two or more races 69.7 11.2 19.1 69.9 13.1 17.1<br />
Race/ethnicity by sex<br />
Male<br />
White 80.8 9.0 10.2 82.3 8.7 9.0<br />
Black 58.5 16.2 25.2 68.5 14.5 17.0<br />
Hispanic 79.6 9.6 10.9 81.7 8.9 9.5<br />
Asian 81.3 6.5 12.2 75.9 9.0 ! 15.1<br />
Native Hawaiian/Pacific Isl<strong>and</strong>er 74.4 ! ‡ ‡ 82.6 ! ‡ ‡<br />
American Indian/Alaska Native 3 56.5 15.1 ! 28.4 ‡ ‡ ‡<br />
American Indian 56.7 14.9 ! 28.4 ‡ ‡ ‡<br />
Alaska Native ‡ ‡ ‡ ‡ ‡ ‡<br />
Two or more races 72.1 12.0 15.9 74.2 12.0 ! 13.8<br />
Female<br />
White 73.3 6.4 20.3 72.0 7.0 21.0<br />
Black 67.2 13.8 19.0 70.9 13.4 15.7<br />
Hispanic 60.1 8.7 31.3 70.0 8.6 21.4<br />
Asian 65.0 6.2 28.9 65.5 7.5 ! 26.9<br />
Native Hawaiian/Pacific Isl<strong>and</strong>er 64.2 ‡ ‡ ‡ ‡ ‡<br />
American Indian/Alaska Native 3 59.0 11.3 ! 29.8 ‡ ‡ ‡<br />
American Indian 60.0 11.4 ! 28.6 ‡ ‡ ‡<br />
Alaska Native ‡ ‡ ‡ ‡ ‡ ‡<br />
Two or more races 67.5 10.4 22.1 66.2 14.0 ! 19.8<br />
Nativity<br />
Hispanic<br />
Born with<strong>in</strong> the United States 4 70.6 10.3 19.1 75.8 9.2 15.0<br />
Born outside the United States 69.8 8.0 22.1 75.0 7.7 17.3<br />
Asian<br />
Born with<strong>in</strong> the United States 4 79.5 7.2 13.3 76.0 8.7 ! 15.3 !<br />
Born outside the United States 70.1 6.0 23.9 67.7 8.0 24.3<br />
Citizenship status<br />
U.S.-born citizen 74.2 9.2 16.6 75.7 9.2 15.2<br />
Naturalized citizen 77.1 7.3 15.6 77.2 7.5 15.2<br />
Noncitizen 67.5 7.9 24.7 67.7 8.9 23.4<br />
See notes at end of table.<br />
224 <strong>Higher</strong> <strong>Education</strong>: <strong>Gaps</strong> <strong>in</strong> <strong>Access</strong> <strong>and</strong> <strong>Persistence</strong> <strong>Study</strong>
Table 44-1.<br />
Labor force status of young adults ages 25 to 34, by highest level of educational atta<strong>in</strong>ment, sex, race/<br />
ethnicity, nativity, <strong>and</strong> citizenship status: 2010—Cont<strong>in</strong>ued<br />
Total<br />
Bachelor’s or higher degree<br />
Sex, race/ethnicity, nativity, <strong>and</strong><br />
In the labor force<br />
Not <strong>in</strong> the<br />
In the labor force<br />
Not <strong>in</strong> the<br />
citizenship status<br />
Employed Unemployed labor force Employed Unemployed labor force<br />
Total 2 73.4 9.0 17.7 85.0 4.6 10.5<br />
Sex<br />
Male 77.6 10.0 12.5 89.1 4.9 6.0<br />
Female 69.1 8.0 22.9 81.7 4.3 14.0<br />
44<br />
Race/ethnicity<br />
White 77.1 7.7 15.2 87.1 3.9 9.0<br />
Black 63.1 15.0 21.9 83.9 8.2 7.9<br />
Hispanic 70.2 9.1 20.7 82.8 5.8 11.5<br />
Asian 72.6 6.3 21.1 75.5 5.1 19.4<br />
Native Hawaiian/Pacific Isl<strong>and</strong>er ‡ ‡ ‡ 86.0 ! ‡ ‡<br />
American Indian/Alaska Native 3 57.8 13.2 ! 29.1 84.3 ! ‡ ‡<br />
American Indian 58.4 13.1 ! 28.5 85.7 ! ‡ ‡<br />
Alaska Native ‡ ‡ ‡ ‡ ‡ ‡<br />
Two or more races 69.7 11.2 19.1 83.2 4.7 ! 12.1 !<br />
Race/ethnicity by sex<br />
Male<br />
White 80.8 9.0 10.2 90.5 4.4 5.1<br />
Black 58.5 16.2 25.2 84.8 8.6 6.6 !<br />
Hispanic 79.6 9.6 10.9 87.8 5.6 ! 6.5<br />
Asian 81.3 6.5 12.2 85.3 5.0 9.8<br />
Native Hawaiian/Pacific Isl<strong>and</strong>er 74.4 ! ‡ ‡ ‡ ‡ ‡<br />
American Indian/Alaska Native 3 56.5 15.1 ! 28.4 88.4 ! ‡ ‡<br />
American Indian 56.7 14.9 ! 28.4 88.0 ! ‡ ‡<br />
Alaska Native ‡ ‡ ‡ ‡ ‡ ‡<br />
Two or more races 72.1 12.0 15.9 ‡ ‡ ‡<br />
Female<br />
White 73.3 6.4 20.3 84.3 3.5 12.2<br />
Black 67.2 13.8 19.0 83.4 7.9 8.7<br />
Hispanic 60.1 8.7 31.3 79.1 5.9 15.0<br />
Asian 65.0 6.2 28.9 67.2 5.3 27.5<br />
Native Hawaiian/Pacific Isl<strong>and</strong>er 64.2 ‡ ‡ ‡ ‡ ‡<br />
American Indian/Alaska Native 3 59.0 11.3 ! 29.8 81.4 ! ‡ ‡<br />
American Indian 60.0 11.4 ! 28.6 83.9 ! ‡ ‡<br />
Alaska Native ‡ ‡ ‡ ‡ ‡ ‡<br />
Two or more races 67.5 10.4 22.1 81.6 4.4 ! 14.0 !<br />
Nativity<br />
Hispanic<br />
Born with<strong>in</strong> the United States 4 70.6 10.3 19.1 85.8 5.4 8.8<br />
Born outside the United States 69.8 8.0 22.1 76.7 6.5 ! 16.7<br />
Asian<br />
Born with<strong>in</strong> the United States 4 79.5 7.2 13.3 83.6 5.8 ! 10.6 !<br />
Born outside the United States 70.1 6.0 23.9 72.6 4.9 22.5<br />
Citizenship status<br />
U.S.-born citizen 74.2 9.2 16.6 87.3 4.3 8.4<br />
Naturalized citizen 77.1 7.3 15.6 81.9 6.4 11.7<br />
Noncitizen 67.5 7.9 24.7 69.9 5.2 24.9<br />
! Interpret data with caution. The coefficient of variation (CV) for this estimate is 30 percent or greater.<br />
‡ Report<strong>in</strong>g st<strong>and</strong>ards not met. There are either too few cases or the coefficient of variation (CV) is 50 percent or greater.<br />
1<br />
Includes a high school diploma or an equivalent credential, <strong>in</strong>clud<strong>in</strong>g a General <strong>Education</strong>al Development (GED) certificate.<br />
2<br />
Total <strong>in</strong>cludes other racial/ethnic groups not shown separately <strong>in</strong> the table.<br />
3<br />
Includes persons report<strong>in</strong>g American Indian alone, Alaska Native alone, <strong>and</strong> persons from American Indian <strong>and</strong>/or Alaska Native tribes specified or<br />
not specified.<br />
4<br />
Includes the 50 states, the District of Columbia, Puerto Rico, Guam, the U.S. Virg<strong>in</strong> Isl<strong>and</strong>s, <strong>and</strong> the Northern Marianas. Also <strong>in</strong>cludes those born<br />
abroad of American parents.<br />
NOTE: Estimates are for the entire population <strong>in</strong> the <strong>in</strong>dicated age range, <strong>in</strong>clud<strong>in</strong>g persons <strong>in</strong> both households <strong>and</strong> group quarters. A household<br />
<strong>in</strong>cludes all the persons who occupy a hous<strong>in</strong>g unit. A group quarters is a nontypical household-type liv<strong>in</strong>g arrangement where people live or stay <strong>in</strong> a<br />
group liv<strong>in</strong>g arrangement that is owned or managed by an entity or organization provid<strong>in</strong>g hous<strong>in</strong>g <strong>and</strong>/or services for the residents. Group quarters<br />
<strong>in</strong>clude such places as college residence halls, residential treatment centers, skilled nurs<strong>in</strong>g facilities, group homes, military barracks, correctional<br />
facilities, <strong>and</strong> workers’ dormitories. High school completion <strong>in</strong>cludes a high school diploma or an equivalent credential, <strong>in</strong>clud<strong>in</strong>g a General<br />
<strong>Education</strong>al Development (GED) certificate. Labor force status refers to the full calendar week prior to the week when the respondent answered the<br />
questions. Detail may not sum to totals because of round<strong>in</strong>g. Race categories exclude persons of Hispanic ethnicity.<br />
SOURCE: U.S. Department of Commerce, Census Bureau, American Community Survey (ACS), 2010.<br />
Postsecondary Outcomes <strong>and</strong> Employment 225<br />
Outcomes <strong>and</strong> Employment<br />
7
Indicator 45<br />
Median Annual Earn<strong>in</strong>gs<br />
Median annual earn<strong>in</strong>gs for young adults ages 25 to 34 with a bachelor’s or higher<br />
degree who worked full time <strong>and</strong> throughout a full year were $50,300 <strong>in</strong> 2010. Males<br />
out-earned females by about $9,100 ($54,400 vs. $45,300); this earn<strong>in</strong>gs difference<br />
by sex was also observed among Whites, Blacks, Hispanics, Asians, <strong>and</strong> young<br />
adults of two or more races.<br />
The 2010 median annual earn<strong>in</strong>gs of young adults ages 25<br />
to 34 who worked full time throughout a full year were<br />
$36,200. Median earn<strong>in</strong>gs for these young adults ranged<br />
from $21,100 for young adults who had not completed<br />
high school to $50,300 for those who had earned a<br />
bachelor’s or higher degree. For young adults who had<br />
earned a bachelor’s or higher degree <strong>and</strong> held a bachelor’s<br />
degree <strong>in</strong> a science, technology, eng<strong>in</strong>eer<strong>in</strong>g, or<br />
mathematics (STEM) field of study, median earn<strong>in</strong>gs were<br />
$58,200. Median earn<strong>in</strong>gs for these young adults ranged<br />
from $44,300 for those with a bachelor’s degree <strong>in</strong><br />
agriculture/natural resources to $68,400 for young adults<br />
with a bachelor’s degree <strong>in</strong> eng<strong>in</strong>eer<strong>in</strong>g/eng<strong>in</strong>eer<strong>in</strong>g<br />
technologies. Median earn<strong>in</strong>gs for young adults also<br />
differed by sex, race/ethnicity, nativity, <strong>and</strong> citizenship<br />
status.<br />
Young adults whose highest level of educational<br />
atta<strong>in</strong>ment was high school completion had median<br />
earn<strong>in</strong>gs of $29,200 <strong>in</strong> 2010. Median earn<strong>in</strong>gs for males<br />
<strong>in</strong> this group exceeded those for females by about $5,100<br />
($30,200 vs. $25,100). Median earn<strong>in</strong>gs were also higher<br />
for male than female high school completers among<br />
Whites, Blacks, Hispanics, Asians, <strong>and</strong> Native Hawaiians/<br />
Pacific Isl<strong>and</strong>ers. For example, the earn<strong>in</strong>gs gap between<br />
Black males <strong>and</strong> females <strong>in</strong> this group was $3,600.<br />
Concern<strong>in</strong>g racial/ethnic differences, median earn<strong>in</strong>gs<br />
were lower for Black ($25,200), Hispanic ($25,200), <strong>and</strong><br />
American Indian ($24,700) young adult high school<br />
completers than for Native Hawaiian/Pacific Isl<strong>and</strong>er<br />
($34,500), White ($30,200), Asian ($29,900), <strong>and</strong> young<br />
adult high school completers of two or more races<br />
($29,800). Similar differences <strong>in</strong> earn<strong>in</strong>gs by race/<br />
ethnicity were observed among male young adults <strong>in</strong> this<br />
group. With regard to nativity, Hispanic high school<br />
completers who were born with<strong>in</strong> the United States<br />
out-earned their peers who were born elsewhere ($29,100<br />
vs. $23,400). There was no measurable difference <strong>in</strong><br />
Figure 45-1.<br />
Median annual earn<strong>in</strong>gs of full-time, full-year wage <strong>and</strong> salary workers ages 25 to 34, by sex, race/<br />
ethnicity, <strong>and</strong> highest level of educational atta<strong>in</strong>ment: 2010<br />
Earn<strong>in</strong>gs<br />
Male<br />
Female<br />
$80,000<br />
70,000<br />
60,000<br />
50,000<br />
40,000<br />
30,000<br />
20,000<br />
F<br />
F<br />
H<br />
J<br />
F<br />
H<br />
J<br />
F<br />
H<br />
J<br />
F<br />
H<br />
J<br />
F<br />
10,000<br />
0<br />
Total 1 White Black Hispanic Asian Two or<br />
more<br />
races<br />
Total 1 White Black Hispanic Asian Two or<br />
more<br />
races<br />
High school completion<br />
Race/ethnicity<br />
Bachelor’s or higher degree with<br />
bachelor’s degree <strong>in</strong> a non-STEM field<br />
Bachelor’s or higher degree with<br />
bachelor’s degree <strong>in</strong> a STEM field<br />
1<br />
Total <strong>in</strong>cludes other racial/ethnic groups not shown separately <strong>in</strong> the figure.<br />
NOTE: Estimates are for the entire population <strong>in</strong> the <strong>in</strong>dicated age range, <strong>in</strong>clud<strong>in</strong>g persons <strong>in</strong> both households <strong>and</strong> group quarters. A household <strong>in</strong>cludes<br />
all the persons who occupy a hous<strong>in</strong>g unit. A group quarters is a nontypical household-type liv<strong>in</strong>g arrangement where people live or stay <strong>in</strong> a group liv<strong>in</strong>g<br />
arrangement that is owned or managed by an entity or organization provid<strong>in</strong>g hous<strong>in</strong>g <strong>and</strong>/or services for the residents. Group quarters <strong>in</strong>clude such<br />
places as college residence halls, residential treatment centers, skilled nurs<strong>in</strong>g facilities, group homes, military barracks, correctional facilities, <strong>and</strong> workers’<br />
dormitories. Employment status refers to the full calendar week prior to the week when the respondent answered the questions. Full-year worker refers to those<br />
who were employed 50 or more weeks dur<strong>in</strong>g the previous year; full-time worker refers to those who were usually employed 35 or more hours per week. High<br />
school completion <strong>in</strong>cludes a high school diploma or an equivalent credential, <strong>in</strong>clud<strong>in</strong>g a General <strong>Education</strong>al Development (GED) certificate. Detail may<br />
not sum to totals because of round<strong>in</strong>g. Report<strong>in</strong>g st<strong>and</strong>ards for at least some data for Native Hawaiian/Pacific Isl<strong>and</strong>er males <strong>and</strong> females, American Indian<br />
males <strong>and</strong> females, <strong>and</strong> Alaska Native males <strong>and</strong> females were not met; therefore, data for males <strong>and</strong> females <strong>in</strong> these racial groups are not shown <strong>in</strong> the<br />
figure. Race categories exclude persons of Hispanic ethnicity. Science, technology, eng<strong>in</strong>eer<strong>in</strong>g, <strong>and</strong> mathematics (STEM) fields, as def<strong>in</strong>ed here, <strong>in</strong>clude<br />
agriculture <strong>and</strong> natural resources, biology <strong>and</strong> biomedical sciences, computer <strong>and</strong> <strong>in</strong>formation sciences, eng<strong>in</strong>eer<strong>in</strong>g <strong>and</strong> eng<strong>in</strong>eer<strong>in</strong>g technologies, health<br />
professions <strong>and</strong> cl<strong>in</strong>ical sciences, mathematics <strong>and</strong> statistics, <strong>and</strong> physical sciences <strong>and</strong> science technologies.<br />
SOURCE: U.S. Department of Commerce, Census Bureau, American Community Survey (ACS), 2010.<br />
226 <strong>Higher</strong> <strong>Education</strong>: <strong>Gaps</strong> <strong>in</strong> <strong>Access</strong> <strong>and</strong> <strong>Persistence</strong> <strong>Study</strong>
earn<strong>in</strong>gs between Asian high school completers who were<br />
born <strong>in</strong> the United States <strong>and</strong> their foreign-born peers<br />
($30,100 vs. $28,100). Regard<strong>in</strong>g citizenship, median<br />
earn<strong>in</strong>gs for those who had completed high school were<br />
lower for noncitizens ($23,900) than for U.S.-born<br />
citizens <strong>and</strong> naturalized citizens ($30,200 <strong>and</strong> $29,000,<br />
respectively).<br />
Median annual earn<strong>in</strong>gs for young adults with a<br />
bachelor’s or higher degree were $50,300 <strong>in</strong> 2010. Male<br />
earn<strong>in</strong>gs exceeded female earn<strong>in</strong>gs by about $9,100<br />
($54,400 vs. $45,300); this difference by sex was also<br />
observed among Whites, Blacks, Hispanics, Asians, <strong>and</strong><br />
young adults of two or more races. For <strong>in</strong>stance, the<br />
earn<strong>in</strong>gs difference by sex for Hispanics was around<br />
$6,500 ($49,800 vs. $43,200). Several differences <strong>in</strong><br />
earn<strong>in</strong>gs were observed by race/ethnicity overall <strong>and</strong><br />
among males <strong>and</strong> females. Asian young adults with a<br />
bachelor’s or higher degree earned more than their peers<br />
<strong>in</strong> the other racial/ethnic groups ($60,200 vs. $37,900 to<br />
$50,000, respectively) <strong>and</strong> Hispanics ($45,300) earned<br />
more than Blacks ($43,200) <strong>and</strong> American Indians<br />
($37,900); similar patterns also held among males.<br />
Hispanic young adults with a bachelor’s or higher degree<br />
who were born with<strong>in</strong> the United States had higher<br />
median earn<strong>in</strong>gs than their foreign-born counterparts<br />
($47,200 vs. $40,300), whereas Asian young adults who<br />
were born with<strong>in</strong> the United States had lower median<br />
earn<strong>in</strong>gs than their foreign-born counterparts ($57,300 vs.<br />
Technical Notes<br />
Estimates are for the entire population <strong>in</strong> the <strong>in</strong>dicated<br />
age range, <strong>in</strong>clud<strong>in</strong>g persons <strong>in</strong> both households <strong>and</strong><br />
group quarters. A household <strong>in</strong>cludes all the persons who<br />
occupy a hous<strong>in</strong>g unit. A group quarters is a nontypical<br />
household-type liv<strong>in</strong>g arrangement where people live<br />
or stay <strong>in</strong> a group liv<strong>in</strong>g arrangement that is owned or<br />
managed by an entity or organization provid<strong>in</strong>g hous<strong>in</strong>g<br />
<strong>and</strong>/or services for the residents. Group quarters <strong>in</strong>clude<br />
such places as college residence halls, residential treatment<br />
centers, skilled nurs<strong>in</strong>g facilities, group homes, military<br />
barracks, correctional facilities, <strong>and</strong> workers’ dormitories.<br />
Employment status refers to the full calendar week prior<br />
to the week when the respondent answered the questions.<br />
Full-year worker refers to those who were employed 50<br />
or more weeks dur<strong>in</strong>g the previous year; full-time worker<br />
refers to those who were usually employed 35 or more<br />
hours per week. High school completion <strong>in</strong>cludes a high<br />
school diploma or an equivalent credential, <strong>in</strong>clud<strong>in</strong>g a<br />
General <strong>Education</strong>al Development (GED) certificate.<br />
STEM fields, as def<strong>in</strong>ed here, <strong>in</strong>clude agriculture <strong>and</strong><br />
$60,300). Median earn<strong>in</strong>gs for noncitizens ($55,000) <strong>and</strong><br />
naturalized citizens with a bachelor’s or higher degree<br />
($51,700) were higher than those for U.S.-born citizens<br />
($48,400); earn<strong>in</strong>gs were also higher for non-U.S. citizens<br />
than for naturalized citizens.<br />
For young adults with a bachelor’s or higher degree who<br />
had earned a bachelor’s degree <strong>in</strong> a STEM field (STEM<br />
graduates), median annual earn<strong>in</strong>gs were $58,200; male<br />
earn<strong>in</strong>gs exceeded those for females by about $8,200<br />
($60,400 vs. $52,200). This pattern by sex also held for<br />
Whites, Blacks, Hispanics, Asians, <strong>and</strong> young adults of<br />
two or more races. For example, the earn<strong>in</strong>gs gap between<br />
males <strong>and</strong> females was about $7,100 for Hispanics <strong>in</strong> this<br />
group ($53,300 vs. $46,200). Median earn<strong>in</strong>gs were<br />
higher for Asian STEM graduates ($66,400) than their<br />
peers <strong>in</strong> the other racial/ethnic groups ($44,100 to<br />
$56,300). This pattern was also found among both the<br />
male <strong>and</strong> female subgroups. Hispanic STEM graduates<br />
who were born with<strong>in</strong> the United States had higher<br />
median earn<strong>in</strong>gs than their peers who were born outside<br />
of the United States ($53,100 vs. $44,400). No measurable<br />
differences were found between the median earn<strong>in</strong>gs of<br />
Asian STEM graduates who were born with<strong>in</strong> the United<br />
States <strong>and</strong> their peers not born <strong>in</strong> the United States<br />
($63,800 vs. $67,800). Median earn<strong>in</strong>gs for both<br />
naturalized citizens ($62,600) <strong>and</strong> noncitizens ($60,400)<br />
exceeded those for U.S.-born citizens ($55,800) among<br />
STEM graduates.<br />
natural resources, biology <strong>and</strong> biomedical sciences,<br />
computer <strong>and</strong> <strong>in</strong>formation sciences, eng<strong>in</strong>eer<strong>in</strong>g <strong>and</strong><br />
eng<strong>in</strong>eer<strong>in</strong>g technologies, health professions <strong>and</strong> cl<strong>in</strong>ical<br />
sciences, mathematics <strong>and</strong> statistics, <strong>and</strong> physical sciences<br />
<strong>and</strong> science technologies. Respondents were allowed to<br />
<strong>in</strong>dicate two major undergraduate fields of study; data<br />
reflect the first reported field of study. Thus, this <strong>in</strong>dicator<br />
provides <strong>in</strong>formation on the percentage of graduates <strong>in</strong><br />
undergraduate STEM fields, but does not provide an<br />
<strong>in</strong>dication of the percentage of graduates <strong>in</strong> other fields<br />
who also took significant amounts of STEM coursework<br />
or those who have a second major <strong>in</strong> a STEM field. Data<br />
are assembled based on major field aggregations. In the<br />
major field aggregations that were not classified as STEM,<br />
some <strong>in</strong>dividual fields could be classified as STEM (such<br />
as econometrics with<strong>in</strong> social sciences <strong>and</strong> history).<br />
Born with<strong>in</strong> the United States refers to the 50 states,<br />
the District of Columbia, Puerto Rico, Guam, the U.S.<br />
Virg<strong>in</strong> Isl<strong>and</strong>s, the Northern Marianas, <strong>and</strong> those born<br />
abroad of American parents.<br />
45<br />
Outcomes <strong>and</strong> Employment<br />
7<br />
Postsecondary Outcomes <strong>and</strong> Employment 227
228 <strong>Higher</strong> <strong>Education</strong>: <strong>Gaps</strong> <strong>in</strong> <strong>Access</strong> <strong>and</strong> <strong>Persistence</strong> <strong>Study</strong><br />
Table 45-1.<br />
Median annual earn<strong>in</strong>gs of full-time, full-year wage <strong>and</strong> salary workers ages 25 to 34, by highest level of educational atta<strong>in</strong>ment, sex, race/ethnicity,<br />
nativity, <strong>and</strong> citizenship status: 2010<br />
High school completion or higher<br />
Sex, race/ethnicity, nativity, <strong>and</strong><br />
citizenship status<br />
Total<br />
Less than<br />
high school<br />
completion<br />
Total<br />
High school<br />
completion 1<br />
Some<br />
college or<br />
associate’s<br />
degree<br />
Bachelor’s or higher degree<br />
Total<br />
Bachelor’s<br />
degree <strong>in</strong> a<br />
STEM 2 field<br />
Bachelor’s<br />
degree <strong>in</strong> a<br />
non-STEM 2<br />
field<br />
Percentage of<br />
persons ages<br />
25 to 34 who<br />
were full-time,<br />
full-year wage<br />
<strong>and</strong> salary<br />
workers <strong>in</strong> 2010<br />
Total 3 $36,200 $21,100 $38,200 $29,200 $33,200 $50,300 $58,200 $45,300 65.3<br />
Sex<br />
Male 39,200 23,100 40,300 30,200 37,300 54,400 60,400 50,300 69.5<br />
Female 34,300 18,100 35,200 25,100 30,100 45,300 52,200 42,800 60.5<br />
Race/ethnicity<br />
White 40,300 26,200 40,300 30,200 35,200 50,000 56,300 45,800 66.7<br />
Black 30,200 20,100 30,200 25,200 30,100 43,200 49,900 40,300 62.2<br />
Hispanic 28,200 20,100 31,400 25,200 32,200 45,300 50,100 45,200 63.0<br />
Asian 50,200 21,000 50,300 29,900 34,200 60,200 66,400 50,400 68.8<br />
Native Hawaiian/Pacific Isl<strong>and</strong>er 34,800 ‡ ‡ 34,500 30,000 48,600 ‡ ‡ 61.5<br />
American Indian/Alaska Native 4 30,200 24,600 31,200 25,100 30,100 38,100 44,100 36,500 56.0<br />
American Indian 30,200 24,000 30,800 24,700 30,100 37,900 44,600 36,100 55.3<br />
Alaska Native 37,500 ‡ ‡ ‡ ‡ ‡ ‡ ‡ 48.0<br />
Two or more races 38,100 23,200 39,200 29,800 33,200 48,300 55,200 45,300 59.0<br />
Race/ethnicity by sex<br />
Male<br />
White 42,300 29,200 42,300 33,500 40,300 55,200 60,400 50,400 71.8<br />
Black 31,800 23,100 32,200 27,600 31,200 45,300 51,800 42,200 62.6<br />
Hispanic 28,200 20,900 32,200 27,200 35,200 49,800 53,300 47,300 66.1<br />
Asian 50,400 23,000 53,300 30,200 35,200 63,100 69,900 53,000 73.3<br />
Native Hawaiian/Pacific<br />
Isl<strong>and</strong>er 35,100 ‡ ‡ 35,100 29,500 49,300 ‡ ‡ 63.0<br />
American Indian/Alaska<br />
Native 4 33,500 27,900 33,800 30,000 33,100 39,300 41,900 37,900 59.0<br />
American Indian 32,900 26,000 33,500 28,300 33,300 39,500 43,800 37,300 59.4<br />
Alaska Native ‡ ‡ ‡ ‡ ‡ ‡ ‡ ‡ 45.7<br />
Two or more races 40,300 25,400 41,300 30,200 36,200 54,500 60,400 50,000 63.8<br />
See notes at end of table.
Table 45-1.<br />
Median annual earn<strong>in</strong>gs of full-time, full-year wage <strong>and</strong> salary workers ages 25 to 34, by highest level of educational atta<strong>in</strong>ment, sex, race/ethnicity,<br />
nativity, <strong>and</strong> citizenship status: 2010—Cont<strong>in</strong>ued<br />
Sex, race/ethnicity, nativity, <strong>and</strong><br />
citizenship status<br />
Total<br />
Less than<br />
high school<br />
completion<br />
Total<br />
High school<br />
completion 1<br />
High school completion or higher<br />
Bachelor’s or higher degree<br />
Some<br />
college or<br />
associate’s<br />
degree<br />
Total<br />
Bachelor’s<br />
degree <strong>in</strong> a<br />
STEM 2 field<br />
Bachelor’s<br />
degree <strong>in</strong> a<br />
non-STEM 2<br />
field<br />
Percentage of<br />
persons ages<br />
25 to 34 who<br />
were full-time,<br />
full-year wage<br />
<strong>and</strong> salary<br />
workers <strong>in</strong> 2010<br />
Total 3 $36,200 $21,100 $38,200 $29,200 $33,200 $50,300 $58,200 $45,300 65.3<br />
Race/ethnicity by sex<br />
Female<br />
White 36,200 20,900 36,300 25,200 30,200 45,300 51,400 42,300 60.8<br />
Black 30,100 18,100 30,100 24,000 27,700 41,300 48,000 40,300 61.9<br />
Hispanic 28,100 17,200 30,200 23,900 30,100 43,200 46,200 42,800 58.1<br />
Asian 46,200 19,600 48,100 25,500 30,200 56,100 61,900 50,100 63.8<br />
Native Hawaiian/Pacific<br />
Isl<strong>and</strong>er 32,200 ‡ ‡ 24,000 29,900 ‡ ‡ ‡ 59.6<br />
American Indian/Alaska<br />
Native 4 28,700 18,200 29,500 22,100 28,000 36,800 ‡ ‡ 52.6<br />
American Indian 28,100 ‡ ‡ 22,300 28,200 36,300 ‡ ‡ 51.0<br />
Alaska Native ‡ ‡ ‡ ‡ ‡ ‡ ‡ ‡ 50.7<br />
Two or more races 35,200 19,900 35,300 26,900 30,000 44,100 47,300 42,300 53.8<br />
Nativity<br />
Hispanic<br />
Born with<strong>in</strong> the United States 5 33,200 24,100 35,200 29,100 33,200 47,200 53,100 45,300 65.0<br />
Born outside the United<br />
States 23,500 20,100 27,200 23,400 30,000 40,300 44,400 40,200 61.2<br />
Asian<br />
Born with<strong>in</strong> the United States 5 49,900 23,800 50,000 30,100 35,000 57,300 63,800 53,300 70.3<br />
Born outside the United<br />
States 50,200 20,100 50,300 28,100 33,200 60,300 67,800 50,300 68.3<br />
Postsecondary Outcomes <strong>and</strong> Employment 229<br />
Citizenship status<br />
U.S.-born citizen 37,800 25,100 38,300 30,200 33,900 ! 48,400 55,800 45,300 65.8<br />
Naturalized citizen 39,300 24,100 ! 40,300 29,000 33,200 51,700 62,600 48,200 70.2<br />
Noncitizen 25,800 20,100 32,000 23,900 28,100 55,000 60,400 45,300 60.7<br />
! Interpret data with caution. The coefficient of variation (CV) is 30 percent or greater.<br />
‡ Report<strong>in</strong>g st<strong>and</strong>ards not met. There are either too few cases or the coefficient of variation (CV) is 50 percent or greater.<br />
1<br />
Includes a high school diploma or an equivalent credential, <strong>in</strong>clud<strong>in</strong>g a General <strong>Education</strong>al Development (GED) certificate.<br />
2<br />
Science, technology, eng<strong>in</strong>eer<strong>in</strong>g, <strong>and</strong> mathematics (STEM) fields, as def<strong>in</strong>ed here, <strong>in</strong>clude agriculture <strong>and</strong> natural resources, biology <strong>and</strong> biomedical sciences, computer <strong>and</strong> <strong>in</strong>formation sciences, eng<strong>in</strong>eer<strong>in</strong>g<br />
<strong>and</strong> eng<strong>in</strong>eer<strong>in</strong>g technologies, health professions <strong>and</strong> cl<strong>in</strong>ical sciences, mathematics <strong>and</strong> statistics, <strong>and</strong> physical sciences <strong>and</strong> science technologies. Respondents were allowed to <strong>in</strong>dicate two major<br />
undergraduate fields of study; data reflect the first reported field of study. This <strong>in</strong>dicator provides <strong>in</strong>formation on the percentage of graduates <strong>in</strong> STEM fields, but does not provide an <strong>in</strong>dication of the percentage<br />
of graduates <strong>in</strong> other fields who also take significant amounts of STEM coursework or those who have a second major <strong>in</strong> a STEM field. Data are assembled based on major field aggregations. In the major field<br />
aggregations that were not classified as STEM, some <strong>in</strong>dividual fields could be classified as STEM (such as econometrics with<strong>in</strong> social sciences <strong>and</strong> history).<br />
3<br />
Total <strong>in</strong>cludes other racial/ethnic groups not shown separately <strong>in</strong> the table.<br />
4<br />
Includes persons report<strong>in</strong>g American Indian alone, Alaska Native alone, <strong>and</strong> persons from American Indian <strong>and</strong>/or Alaska Native tribes specified or unspecified.<br />
5<br />
Born with<strong>in</strong> the United States <strong>in</strong>cludes the 50 states, the District of Columbia, Puerto Rico, Guam, the U.S. Virg<strong>in</strong> Isl<strong>and</strong>s, the Northern Marianas, <strong>and</strong> those born abroad of American parents.<br />
NOTE: Estimates are for the entire population <strong>in</strong> the <strong>in</strong>dicated age range, <strong>in</strong>clud<strong>in</strong>g persons <strong>in</strong> both households <strong>and</strong> group quarters. A household <strong>in</strong>cludes all the persons who occupy a hous<strong>in</strong>g unit. A group<br />
quarters is a nontypical household-type liv<strong>in</strong>g arrangement where people live or stay <strong>in</strong> a group liv<strong>in</strong>g arrangement that is owned or managed by an entity or organization provid<strong>in</strong>g hous<strong>in</strong>g <strong>and</strong>/or services for<br />
the residents. Group quarters <strong>in</strong>clude such places as college residence halls, residential treatment centers, skilled nurs<strong>in</strong>g facilities, group homes, military barracks, correctional facilities, <strong>and</strong> workers’ dormitories.<br />
Employment status refers to the full calendar week prior to the week when the respondent answered the questions. Full-year worker refers to those who were employed 50 or more weeks dur<strong>in</strong>g the previous year; fulltime<br />
worker refers to those who were usually employed 35 or more hours per week. Detail may not sum to totals because of round<strong>in</strong>g. Race categories exclude persons of Hispanic ethnicity.<br />
SOURCE: U.S. Department of Commerce, Census Bureau, American Community Survey (ACS), 2010.<br />
7<br />
Outcomes <strong>and</strong> Employment<br />
45
230 <strong>Higher</strong> <strong>Education</strong>: <strong>Gaps</strong> <strong>in</strong> <strong>Access</strong> <strong>and</strong> <strong>Persistence</strong> <strong>Study</strong><br />
Table 45-2.<br />
Median annual earn<strong>in</strong>gs of full-time, full-year wage <strong>and</strong> salary workers ages 25 to 34 with a bachelor’s or higher degree, by undergraduate field of study,<br />
sex, race/ethnicity, nativity, <strong>and</strong> citizenship status: 2010<br />
Sex, race/ethnicity,<br />
nativity, <strong>and</strong> citizenship<br />
status Total Total<br />
Agriculture/<br />
natural<br />
resources<br />
Science, technology, eng<strong>in</strong>eer<strong>in</strong>g, <strong>and</strong> mathematics (STEM) 1 fields of study<br />
Architecture<br />
Computer<br />
<strong>and</strong> <strong>in</strong>formation<br />
sciences<br />
Biology/<br />
biomedical<br />
sciences<br />
Eng<strong>in</strong>eer<strong>in</strong>g/<br />
eng<strong>in</strong>eer<strong>in</strong>g<br />
technologies<br />
Mathematics/<br />
statistics<br />
Physical<br />
sciences<br />
Health<br />
professions/<br />
cl<strong>in</strong>ical<br />
sciences Total Bus<strong>in</strong>ess<br />
Non-STEM fields of study<br />
Total 2 $50,300 $58,200 $44,300 $49,900 $62,400 $68,400 $50,300 $55,000 $50,300 $53,800 $45,300 $50,400 $40,300 $45,300<br />
Sex<br />
Male 54,400 60,400 45,200 50,500 63,400 68,800 50,300 59,600 50,200 60,100 50,300 55,200 43,600 49,300<br />
Female 45,300 52,200 40,300 47,600 56,200 66,400 50,300 49,900 50,200 52,300 42,800 48,300 40,300 42,300<br />
Race/ethnicity<br />
White 50,000 56,300 44,200 49,500 62,400 66,800 50,300 54,900 50,300 54,100 45,800 52,400 40,300 45,300<br />
Black 43,200 49,900 50,800 ‡ 49,600 61,800 44,600 47,700 43,500 49,800 ! 40,300 44,300 40,800 40,200<br />
Hispanic 45,300 50,100 39,300 50,300 54,500 58,800 45,200 48,400 47,300 48,000 45,200 47,200 40,300 44,200<br />
Asian 60,200 66,400 37,100 56,400 69,600 72,200 51,900 67,100 49,800 60,400 50,400 53,300 40,600 50,200<br />
Native Hawaiian/<br />
Pacific Isl<strong>and</strong>er 48,600 58,300 ‡ ‡ ‡ ‡ ‡ ‡ ‡ ‡ 46,200 ‡ ‡ ‡<br />
American Indian/<br />
Alaska Native 3 38,100 44,100 ‡ ‡ ‡ ‡ ‡ ‡ ‡ ‡ 36,500 44,500 ‡ 35,300<br />
American Indian 37,900 44,600 ‡ ‡ ‡ ‡ ‡ ‡ ‡ ‡ 36,100 38,200 ‡ 35,600<br />
Alaska Native ‡ ‡ ‡ ‡ ‡ ‡ ‡ ‡ ‡ ‡ ‡ ‡ ‡<br />
Two or more races 48,300 55,200 ‡ ‡ 61,200 65,500 50,000 ‡ ‡ 45,300 45,300 53,300 38,300 45,300<br />
<strong>Education</strong><br />
Other<br />
Race/ethnicity by sex<br />
Male<br />
White 55,200 60,400 45,300 50,000 63,400 67,400 51,800 59,300 50,200 60,300 50,400 57,100 44,900 50,300<br />
Black 45,300 51,800 ‡ ‡ 50,600 63,300 44,600 ‡ ‡ 45,100 42,200 ! 45,200 39,700 40,500<br />
Hispanic 49,800 53,300 40,000 53,300 57,700 58,300 47,300 46,600 50,200 58,100 47,300 50,000 39,500 45,900<br />
Asian 63,100 69,900 38,000 56,800 70,300 72,500 50,200 69,800 50,100 65,700 53,000 54,200 49,400 51,500<br />
Native Hawaiian/<br />
Pacific Isl<strong>and</strong>er 49,300 ‡ ‡ ‡ ‡ ‡ ‡ ‡ ‡ ‡ ‡ ‡ ‡ ‡<br />
American Indian/<br />
Alaska Native 3 39,300 41,900 ‡ ‡ ‡ ‡ ‡ ‡ ‡ ‡ 37,900 ‡ ‡ 35,700<br />
American Indian 39,500 43,800 ‡ ‡ ‡ ‡ ‡ ‡ ‡ ‡ 37,300 ‡ ‡ ‡<br />
Alaska Native ‡ ‡ ‡ ‡ ‡ ‡ ‡ ‡ ‡ ‡ ‡ ‡ ‡ ‡<br />
Two or more races 54,500 60,400 ‡ ‡ 61,000 69,600 54,300 ‡ ‡ ‡ 50,000 57,900 ‡ 48,500<br />
See notes at end of table.
Table 45-2.<br />
Median annual earn<strong>in</strong>gs of full-time, full-year wage <strong>and</strong> salary workers ages 25 to 34 with a bachelor’s or higher degree, by undergraduate field of study,<br />
sex, race/ethnicity, nativity, <strong>and</strong> citizenship status: 2010—Cont<strong>in</strong>ued<br />
Sex, race/ethnicity,<br />
nativity, <strong>and</strong> citizenship<br />
status Total Total<br />
Agriculture/<br />
natural<br />
resources<br />
Science, technology, eng<strong>in</strong>eer<strong>in</strong>g, <strong>and</strong> mathematics (STEM) 1 fields of study<br />
Architecture<br />
Computer<br />
<strong>and</strong> <strong>in</strong>formation<br />
sciences<br />
Biology/<br />
biomedical<br />
sciences<br />
Eng<strong>in</strong>eer<strong>in</strong>g/<br />
eng<strong>in</strong>eer<strong>in</strong>g<br />
technologies<br />
Mathematics/<br />
statistics<br />
Physical<br />
sciences<br />
Health<br />
professions/<br />
cl<strong>in</strong>ical<br />
sciences Total Bus<strong>in</strong>ess<br />
Non-STEM fields of study<br />
Total 2 $50,300 $58,200 $44,300 $49,900 $62,400 $68,400 $50,300 $55,000 $50,300 $53,800 $45,300 $50,400 $40,300 $45,300<br />
Race/ethnicity by sex<br />
Female<br />
White 45,300 51,400 40,400 45,200 50,300 65,300 50,300 50,000 50,300 52,900 42,300 49,300 40,200 42,300<br />
Black 41,300 48,000 ‡ ‡ 43,700 58,900 44,300 ‡ ‡ 50,200 40,300 43,000 41,400 39,200<br />
Hispanic 43,200 46,200 33,700 ‡ 42,400 61,500 43,200 ‡ 38,600 47,700 42,800 ! 44,900 41,300 42,200<br />
Asian 56,100 61,900 ‡ ‡ 65,100 70,500 55,500 56,700 46,700 60,000 50,100 52,200 39,800 49,600<br />
Native Hawaiian/<br />
Pacific Isl<strong>and</strong>er ‡ ‡ ‡ ‡ ‡ ‡ ‡ ‡ ‡ ‡ ‡ ‡ ‡ ‡<br />
American Indian/<br />
Alaska Native 3 36,800 ‡ ‡ ‡ ‡ ‡ ‡ ‡ ‡ ‡ 35,100 ‡ ‡ 35,100<br />
American Indian 36,300 ‡ ‡ ‡ ‡ ‡ ‡ ‡ ‡ ‡ 34,200 ! ‡ ‡ 35,200<br />
Alaska Native ‡ ‡ ‡ ‡ ‡ ‡ ‡ ‡ ‡ ‡ ‡ ‡ ‡ ‡<br />
Two or more races 44,100 47,300 ‡ ‡ ‡ ‡ 49,400 ‡ ‡ 47,400 42,300 51,200 37,400 40,300<br />
Nativity<br />
Hispanic<br />
Born with<strong>in</strong> the<br />
United States 4 47,200 53,100 42,100 53,400 55,000 64,500 47,300 45,300 49,800 49,200 45,300 49,500 42,300 45,200<br />
Born outside the<br />
United States 40,300 44,400 ‡ ‡ 50,400 44,300 41,600 ‡ ‡ 42,900 ! 40,200 40,300 38,000 40,200<br />
Asian<br />
Born with<strong>in</strong> the<br />
United States 4 57,300 63,800 ‡ ‡ 67,600 70,100 56,300 ‡ 51,700 65,200 53,300 54,900 49,000 52,700<br />
Born outside the<br />
United States 60,300 67,800 40,200 54,800 69,600 72,900 50,200 69,700 49,400 59,600 50,300 51,900 37,000 49,400<br />
<strong>Education</strong><br />
Other<br />
Postsecondary Outcomes <strong>and</strong> Employment 231<br />
Citizenship status<br />
U.S.-born citizen 48,400 55,800 44,300 50,000 60,200 66,500 50,300 54,700 50,300 53,300 45,300 51,200 40,300 45,200<br />
Naturalized citizen 51,700 62,600 49,900 48,700 65,500 70,500 53,600 52,600 51,200 59,900 48,200 49,800 42,300 47,300<br />
Noncitizen 55,000 60,400 38,500 44,300 67,700 69,800 45,000 60,200 47,100 52,100 45,300 50,200 30,100 44,600<br />
! Interpret data with caution. The coefficient of variation (CV) is 30 percent or greater.<br />
‡ Report<strong>in</strong>g st<strong>and</strong>ards not met. There are too few cases.<br />
1<br />
Science, technology, eng<strong>in</strong>eer<strong>in</strong>g, <strong>and</strong> mathematics (STEM) fields, as def<strong>in</strong>ed here, <strong>in</strong>clude agriculture <strong>and</strong> natural resources, biology <strong>and</strong> biomedical sciences, computer <strong>and</strong> <strong>in</strong>formation sciences, eng<strong>in</strong>eer<strong>in</strong>g<br />
<strong>and</strong> eng<strong>in</strong>eer<strong>in</strong>g technologies, health professions <strong>and</strong> cl<strong>in</strong>ical sciences, mathematics <strong>and</strong> statistics, <strong>and</strong> physical sciences <strong>and</strong> science technologies. Respondents were allowed to <strong>in</strong>dicate two major<br />
undergraduate fields of study; data reflect the first reported field of study. This <strong>in</strong>dicator provides <strong>in</strong>formation on the percentage of graduates <strong>in</strong> STEM fields, but does not provide an <strong>in</strong>dication of the percentage<br />
of graduates <strong>in</strong> other fields who also take significant amounts of STEM coursework or those who have a second major <strong>in</strong> a STEM field. Data are assembled based on major field aggregations. In the major field<br />
aggregations that were not classified as STEM, some <strong>in</strong>dividual fields could be classified as STEM (such as econometrics with<strong>in</strong> social sciences <strong>and</strong> history).<br />
2<br />
Total <strong>in</strong>cludes other racial/ethnic groups not shown separately <strong>in</strong> the table.<br />
3<br />
Includes persons report<strong>in</strong>g American Indian alone, Alaska Native alone, <strong>and</strong> persons from American Indian <strong>and</strong>/or Alaska Native tribes specified or unspecified.<br />
4<br />
Born with<strong>in</strong> the United States <strong>in</strong>cludes the 50 states, the District of Columbia, Puerto Rico, Guam, the U.S. Virg<strong>in</strong> Isl<strong>and</strong>s, the Northern Marianas, <strong>and</strong> those born abroad of American parents.<br />
NOTE: Estimates are for the entire population <strong>in</strong> the <strong>in</strong>dicated age range, <strong>in</strong>clud<strong>in</strong>g persons <strong>in</strong> both households <strong>and</strong> group quarters. A household <strong>in</strong>cludes all the persons who occupy a hous<strong>in</strong>g unit. A group<br />
quarters is a nontypical household-type liv<strong>in</strong>g arrangement where people live or stay <strong>in</strong> a group liv<strong>in</strong>g arrangement that is owned or managed by an entity or organization provid<strong>in</strong>g hous<strong>in</strong>g <strong>and</strong>/or services for<br />
the residents. Group quarters <strong>in</strong>clude such places as college residence halls, residential treatment centers, skilled nurs<strong>in</strong>g facilities, group homes, military barracks, correctional facilities, <strong>and</strong> workers’ dormitories.<br />
Employment status refers to the full calendar week prior to the week when the respondent answered the questions. Full-year worker refers to those who were employed 50 or more weeks dur<strong>in</strong>g the previous year; fulltime<br />
worker refers to those who were usually employed 35 or more hours per week. Detail may not sum to totals because of round<strong>in</strong>g. Race categories exclude persons of Hispanic ethnicity.<br />
SOURCE: U.S. Department of Commerce, Census Bureau, American Community Survey (ACS), 2010.<br />
7<br />
Outcomes <strong>and</strong> Employment<br />
45
Indicator 46<br />
Employment of Young Adults With STEM Degrees<br />
Fifty-six percent of young adults ages 25 to 34 with a bachelor’s or higher<br />
degree who held a bachelor’s degree <strong>in</strong> a science, technology, eng<strong>in</strong>eer<strong>in</strong>g, or<br />
mathematics (STEM) field were employed <strong>in</strong> a STEM occupation <strong>in</strong> 2010. Among<br />
these graduates, higher percentages of males than females were employed as<br />
computer scientists <strong>and</strong> eng<strong>in</strong>eers/architects, while the reverse was true for their<br />
peers who were medical professionals.<br />
Thirty-one percent (or 13 million) of the 41 million<br />
young adults ages 25 to 34 <strong>in</strong> the United States had<br />
earned a bachelor’s or higher degree <strong>in</strong> 2010 (see also<br />
<strong>in</strong>dicator 43). Twenty-n<strong>in</strong>e percent of these young adults<br />
had an undergraduate degree <strong>in</strong> a science, technology,<br />
eng<strong>in</strong>eer<strong>in</strong>g, or mathematics (STEM) field of study. These<br />
STEM graduates <strong>in</strong>cluded those with undergraduate<br />
majors <strong>in</strong> eng<strong>in</strong>eer<strong>in</strong>g/eng<strong>in</strong>eer<strong>in</strong>g technologies (8<br />
percent), health professions/cl<strong>in</strong>ical sciences (6 percent),<br />
biology/biomedical sciences (6 percent), computer <strong>and</strong><br />
<strong>in</strong>formation sciences (4 percent), physical sciences (2<br />
percent), agriculture/natural resources (2 percent),<br />
mathematics/statistics (1 percent), <strong>and</strong> architecture (1<br />
percent).<br />
In 2010, about 95 percent of young adults with a<br />
bachelor’s or higher degree <strong>in</strong> any field were employed,<br />
with a range of 86 percent for young adults with an<br />
undergraduate degree <strong>in</strong> architecture to 97 percent each<br />
for young adults with degrees <strong>in</strong> health professions/cl<strong>in</strong>ical<br />
sciences or <strong>in</strong> education (see <strong>in</strong>dicator 44). Employment<br />
percentages among young adults with undergraduate<br />
degrees <strong>in</strong> the various fields of study also differed by<br />
demographic characteristics such as sex, race/ethnicity,<br />
nativity, <strong>and</strong> citizenship status.<br />
Fifty-six percent of young adult STEM graduates were<br />
employed <strong>in</strong> a STEM occupation <strong>in</strong> 2010; the specific<br />
occupations follow: medical professionals (23 percent),<br />
computer scientists (14 percent), eng<strong>in</strong>eers/architects<br />
(11 percent), scientists (5 percent), health professionals<br />
(1 percent), <strong>and</strong> agriculture/forestry workers (less than<br />
1 percent). Forty-four percent of young adult STEM<br />
graduates worked <strong>in</strong> a non-STEM occupation, <strong>in</strong>clud<strong>in</strong>g<br />
18 percent who worked as bus<strong>in</strong>ess workers/managers <strong>and</strong><br />
8 percent as educators.<br />
For STEM college graduates work<strong>in</strong>g <strong>in</strong> STEM<br />
occupations <strong>in</strong> 2010, higher percentages of males than<br />
females were employed as computer scientists <strong>and</strong><br />
eng<strong>in</strong>eers/architects. This pattern by sex was also observed<br />
among Whites, Blacks, Hispanics, Asians, <strong>and</strong> persons of<br />
two or more races. For example, 15 percent of Hispanic<br />
males with a STEM undergraduate degree were employed<br />
as eng<strong>in</strong>eers/architects versus 6 percent of Hispanic<br />
females. Differences <strong>in</strong> the percentage employed <strong>in</strong> these<br />
STEM occupations were also found by race/ethnicity<br />
(overall <strong>and</strong> among the male <strong>and</strong> female subgroups).<br />
For <strong>in</strong>stance, a higher percentage of Asian males with a<br />
STEM undergraduate degree were employed as computer<br />
scientists than their peers <strong>in</strong> the other racial/ethnic<br />
groups (35 percent vs. 10 to 19 percent, respectively).<br />
Employment <strong>in</strong> the computer science profession for<br />
STEM undergraduates was also higher among males<br />
for Whites (16 percent) <strong>and</strong> Blacks (17 percent) than for<br />
Hispanics (13 percent).<br />
The reverse pattern by sex was observed for STEM<br />
graduates work<strong>in</strong>g <strong>in</strong> a medical profession. <strong>Higher</strong><br />
percentages of females than males who were White, Black,<br />
Hispanic, Asian, <strong>and</strong> of two or more races were employed<br />
as medical professionals <strong>in</strong> 2010. For example, 33 percent<br />
of Black females with these credentials were employed<br />
<strong>in</strong> a medical profession, compared with 10 percent of<br />
Black males. Differences <strong>in</strong> the percentage employed <strong>in</strong><br />
the medical professions were also found by race/ethnicity<br />
(overall <strong>and</strong> among the male <strong>and</strong> female subgroups). For<br />
example, higher percentages of White <strong>and</strong> Asian males<br />
who graduated with STEM degrees than Hispanic males<br />
were employed as medical professionals (11 percent each<br />
vs. 9 percent).<br />
Among scientists, no measurable difference by sex was<br />
found <strong>in</strong> the percentage of STEM graduates who were<br />
employed, although a few differences among males <strong>and</strong><br />
females were found by race/ethnicity. For <strong>in</strong>stance, the<br />
percentage employed as scientists was higher for White<br />
males (6 percent) than for their Hispanic (3 percent)<br />
<strong>and</strong> Asian peers (4 percent); the apparent difference<br />
between White males <strong>and</strong> Black males (4 percent) was not<br />
measurable.<br />
232 <strong>Higher</strong> <strong>Education</strong>: <strong>Gaps</strong> <strong>in</strong> <strong>Access</strong> <strong>and</strong> <strong>Persistence</strong> <strong>Study</strong>
Technical Notes<br />
46<br />
Estimates are for the entire population <strong>in</strong> the <strong>in</strong>dicated<br />
age range, <strong>in</strong>clud<strong>in</strong>g persons <strong>in</strong> both households <strong>and</strong><br />
group quarters. A household <strong>in</strong>cludes all the persons who<br />
occupy a hous<strong>in</strong>g unit. A group quarters is a nontypical<br />
household-type liv<strong>in</strong>g arrangement where people live<br />
or stay <strong>in</strong> a group liv<strong>in</strong>g arrangement that is owned or<br />
managed by an entity or organization provid<strong>in</strong>g hous<strong>in</strong>g<br />
<strong>and</strong>/or services for the residents. Group quarters <strong>in</strong>clude<br />
such places as college residence halls, residential treatment<br />
centers, skilled nurs<strong>in</strong>g facilities, group homes, military<br />
barracks, correctional facilities, <strong>and</strong> workers’ dormitories.<br />
Employment estimates are for those who were <strong>in</strong> the labor<br />
force, with reference to the full calendar week prior to<br />
the week when the respondent answered the questions.<br />
Science, technology, eng<strong>in</strong>eer<strong>in</strong>g, <strong>and</strong> mathematics<br />
(STEM) fields, as def<strong>in</strong>ed here, <strong>in</strong>clude agriculture <strong>and</strong><br />
natural resources, biology <strong>and</strong> biomedical sciences,<br />
computer <strong>and</strong> <strong>in</strong>formation sciences, eng<strong>in</strong>eer<strong>in</strong>g <strong>and</strong><br />
eng<strong>in</strong>eer<strong>in</strong>g technologies, health professions <strong>and</strong> cl<strong>in</strong>ical<br />
sciences, mathematics <strong>and</strong> statistics, <strong>and</strong> physical sciences<br />
<strong>and</strong> science technologies. Respondents were allowed to<br />
<strong>in</strong>dicate two major undergraduate fields of study; data<br />
reflect the first reported field of study. Thus, this <strong>in</strong>dicator<br />
provides <strong>in</strong>formation on the percentage of graduates <strong>in</strong><br />
undergraduate STEM fields, but does not provide an<br />
<strong>in</strong>dication of the percentage of graduates <strong>in</strong> other fields<br />
who also took significant amounts of STEM coursework<br />
or those who have a second major <strong>in</strong> a STEM field. Data<br />
are assembled based on major field aggregations. In the<br />
major field aggregations that were not classified as STEM,<br />
some <strong>in</strong>dividual fields could be classified as STEM (such<br />
as econometrics with<strong>in</strong> social sciences <strong>and</strong> history).<br />
Scientists <strong>in</strong>clude those <strong>in</strong> various discipl<strong>in</strong>es such as<br />
astronomers, chemists, <strong>and</strong> social scientists. Medical<br />
professionals <strong>in</strong>clude medical doctors, pharmacists,<br />
registered nurses <strong>and</strong> nurse practitioners, <strong>and</strong> emergency<br />
medical technicians. Health professionals <strong>in</strong>clude various<br />
support personnel such as occupational therapy aides <strong>and</strong><br />
dental assistants. Born with<strong>in</strong> the United States refers<br />
to the 50 states, the District of Columbia, Puerto Rico,<br />
Guam, the U.S. Virg<strong>in</strong> Isl<strong>and</strong>s, the Northern Marianas,<br />
<strong>and</strong> those born abroad of American parents.<br />
Outcomes <strong>and</strong> Employment<br />
7<br />
Postsecondary Outcomes <strong>and</strong> Employment 233
Figure 46-1.<br />
Percentage of young adults ages 25 to 34 with a bachelor’s or higher degree who have a bachelor’s<br />
degree <strong>in</strong> a science, technology, eng<strong>in</strong>eer<strong>in</strong>g, or mathematics (STEM) field, are <strong>in</strong> the labor force, <strong>and</strong><br />
are employed, by occupation type, race/ethnicity, <strong>and</strong> sex: 2010<br />
Percent Computer scientists Eng<strong>in</strong>eers/architects<br />
60<br />
50<br />
40<br />
30<br />
20<br />
10<br />
0<br />
20<br />
7<br />
16<br />
3<br />
17<br />
6<br />
Total 1 White Black Hispanic Asian Two or<br />
more<br />
races<br />
13<br />
4<br />
35<br />
21<br />
19<br />
8<br />
Race/ethnicity<br />
Male<br />
16<br />
5<br />
Total 1 White Black<br />
Female<br />
18<br />
5<br />
11<br />
4<br />
15<br />
6<br />
13<br />
7<br />
13<br />
Hispanic Asian Two or<br />
more<br />
races<br />
3<br />
Percent Scientists Medical professionals<br />
60<br />
50<br />
40<br />
30<br />
20<br />
10<br />
0<br />
5 6 6 6<br />
4 3 3 4 4<br />
6 5! 7<br />
Total 1 White Black Hispanic Asian Two or<br />
more<br />
races<br />
11<br />
39<br />
Race/ethnicity<br />
Male<br />
11<br />
43<br />
10<br />
33<br />
Total 1 White Black Hispanic Asian Two or<br />
more<br />
races<br />
Female<br />
9<br />
30<br />
11<br />
29<br />
13<br />
33<br />
Percent Bus<strong>in</strong>ess workers/managers Educators<br />
60<br />
50<br />
40<br />
30<br />
20<br />
10<br />
0<br />
20<br />
14<br />
21<br />
14<br />
22 17 18 16 18<br />
13<br />
Total 1 White Black Hispanic Asian Two or<br />
more<br />
races<br />
21<br />
13<br />
Race/ethnicity<br />
Male<br />
7 9 7 10 6 9<br />
Total 1 White Black Hispanic Asian Two or<br />
more<br />
races<br />
Female<br />
5<br />
9 7 7 9 11<br />
! Interpret data with caution. The coefficient of variation (CV) for this estimate is 30 percent or greater.<br />
1<br />
Total <strong>in</strong>cludes other racial/ethnic groups not shown separately <strong>in</strong> the figure.<br />
NOTE: Estimates are for the entire population <strong>in</strong> the <strong>in</strong>dicated age range, <strong>in</strong>clud<strong>in</strong>g persons <strong>in</strong> both households <strong>and</strong> group quarters. A household <strong>in</strong>cludes<br />
all the persons who occupy a hous<strong>in</strong>g unit. A group quarters is a nontypical household-type liv<strong>in</strong>g arrangement where people live or stay <strong>in</strong> a group liv<strong>in</strong>g<br />
arrangement that is owned or managed by an entity or organization provid<strong>in</strong>g hous<strong>in</strong>g <strong>and</strong>/or services for the residents. Group quarters <strong>in</strong>clude such<br />
places as college residence halls, residential treatment centers, skilled nurs<strong>in</strong>g facilities, group homes, military barracks, correctional facilities, <strong>and</strong> workers’<br />
dormitories. STEM fields, as def<strong>in</strong>ed here, <strong>in</strong>clude agriculture <strong>and</strong> natural resources, biology <strong>and</strong> biomedical sciences, computer <strong>and</strong> <strong>in</strong>formation sciences,<br />
eng<strong>in</strong>eer<strong>in</strong>g <strong>and</strong> eng<strong>in</strong>eer<strong>in</strong>g technologies, health professions <strong>and</strong> cl<strong>in</strong>ical sciences, mathematics <strong>and</strong> statistics, <strong>and</strong> physical sciences <strong>and</strong> science<br />
technologies. Labor force status refers to the full calendar week prior to the week when the respondent answered the questions. Respondents were allowed to<br />
<strong>in</strong>dicate two major undergraduate fields of study; data reflect the first reported field of study. Report<strong>in</strong>g st<strong>and</strong>ards for at least some data for Native Hawaiian/<br />
Pacific Isl<strong>and</strong>er males <strong>and</strong> females, American Indian males <strong>and</strong> females, <strong>and</strong> Alaska Native males <strong>and</strong> females were not met; therefore, data for males <strong>and</strong><br />
females <strong>in</strong> these racial groups are not shown <strong>in</strong> the figure. Race categories exclude persons of Hispanic ethnicity.<br />
SOURCE: U.S. Department of Commerce, Census Bureau, American Community Survey (ACS), 2010.<br />
234 <strong>Higher</strong> <strong>Education</strong>: <strong>Gaps</strong> <strong>in</strong> <strong>Access</strong> <strong>and</strong> <strong>Persistence</strong> <strong>Study</strong>
46<br />
This page <strong>in</strong>tentionally left blank.<br />
Outcomes <strong>and</strong> Employment<br />
7<br />
Postsecondary Outcomes <strong>and</strong> Employment 235
236 <strong>Higher</strong> <strong>Education</strong>: <strong>Gaps</strong> <strong>in</strong> <strong>Access</strong> <strong>and</strong> <strong>Persistence</strong> <strong>Study</strong><br />
Table 46-1. Number, percentage, <strong>and</strong> percentage distribution of young adults ages 25 to 34 with a bachelor’s or higher degree, by undergraduate field of study, sex,<br />
race/ethnicity, nativity, <strong>and</strong> citizenship status: 2010<br />
Population of<br />
young adults<br />
ages 25 to 34<br />
Percent of<br />
population<br />
with a<br />
bachelor’s or<br />
higher degree<br />
Bachelor’s degree <strong>in</strong> a science, technology, eng<strong>in</strong>eer<strong>in</strong>g,<br />
or mathematics (STEM) field<br />
Agriculture/<br />
natural<br />
resources<br />
Computer <strong>and</strong><br />
<strong>in</strong>formation<br />
sciences<br />
Eng<strong>in</strong>eer<strong>in</strong>g/<br />
eng<strong>in</strong>eer<strong>in</strong>g<br />
technologies<br />
Sex, race/ethnicity, nativity,<br />
<strong>and</strong> citizenship status<br />
Total<br />
Total<br />
Architecture<br />
Total 1 40,886,000 31.2 100.0 29.1 1.7 0.7 4.1 7.7<br />
Sex<br />
Male 20,494,000 27.3 100.0 35.3 2.1 1.0 6.8 13.6<br />
Female 20,392,000 35.2 100.0 24.3 1.4 0.5 2.1 3.0<br />
Race/ethnicity<br />
White 23,713,000 37.4 100.0 26.0 2.0 0.7 3.0 6.1<br />
Black 5,168,000 19.0 100.0 25.5 0.7 0.5 4.3 4.9<br />
Hispanic 8,397,000 13.0 100.0 25.2 1.0 1.2 3.7 7.7<br />
Asian 2,431,000 62.3 100.0 51.9 0.8 0.9 10.6 18.9<br />
Native Hawaiian/Pacific Isl<strong>and</strong>er 76,000 13.9 100.0 ‡ ‡ ‡ ‡ ‡<br />
American Indian/Alaska Native 2 277,000 12.1 100.0 29.2 4.3 ‡ 2.7 ! 8.3<br />
American Indian 229,000 12.1 100.0 28.1 4.8 ‡ ‡ 8.2<br />
Alaska Native 15,000 ‡ 100.0 ‡ ‡ ‡ ‡ ‡<br />
Two or more races 735,000 32.5 100.0 29.9 1.0 0.6 4.2 7.4<br />
Race/ethnicity by sex<br />
Male<br />
White 11,969,000 32.9 100.0 31.2 2.5 1.0 5.6 11.2<br />
Black 2,438,000 14.9 100.0 29.1 0.9 1.0 7.0 9.5<br />
Hispanic 4,376,000 10.5 100.0 33.5 1.4 1.8 6.3 14.1<br />
Asian 1,133,000 61.2 100.0 62.7 0.7 0.8 13.7 29.2<br />
Native Hawaiian/Pacific Isl<strong>and</strong>er 40,000 15.7 100.0 ‡ ‡ ‡ ‡ 6.9 !<br />
American Indian/Alaska Native 2 137,000 10.2 100.0 46.4 7.9 ! ‡ 6.1 ! 14.2<br />
American Indian 113,000 10.6 100.0 44.8 8.3 ! ‡ ‡ 15.7<br />
Alaska Native 6,000 ‡ 100.0 ‡ ‡ ‡ ‡ ‡<br />
Two or more races 358,000 29.6 100.0 35.9 1.0 ! 0.7 ! 7.4 12.4<br />
Female<br />
White 11,744,000 41.9 100.0 21.9 1.6 0.5 1.0 1.9<br />
Black 2,730,000 22.7 100.0 23.3 0.6 0.2 2.8 2.1<br />
Hispanic 4,021,000 15.8 100.0 19.2 0.8 0.9 1.8 3.1<br />
Asian 1,298,000 63.3 100.0 42.9 0.8 0.9 8.0 10.2<br />
Native Hawaiian/Pacific Isl<strong>and</strong>er 36,000 11.9 100.0 30.6 ‡ ‡ ‡ 9.7<br />
American Indian/Alaska Native 2 140,000 13.9 100.0 17.0 ‡ ‡ ‡ 4.1<br />
American Indian 116,000 13.5 100.0 15.3 ‡ ‡ ‡ ‡<br />
Alaska Native 8,000 ‡ 100.0 ‡ ‡ ‡ ‡ ‡<br />
Two or more races 377,000 35.3 100.0 25.2 1.0 0.6 ! 1.7 3.4<br />
See notes at end of table.
Table 46-1. Number, percentage, <strong>and</strong> percentage distribution of young adults ages 25 to 34 with a bachelor’s or higher degree, by undergraduate field of study, sex,<br />
race/ethnicity, nativity, <strong>and</strong> citizenship status: 2010—Cont<strong>in</strong>ued<br />
Population of<br />
young adults<br />
ages 25 to 34<br />
Percent of<br />
population<br />
with a<br />
bachelor’s or<br />
higher degree<br />
Bachelor’s degree <strong>in</strong> a science, technology, eng<strong>in</strong>eer<strong>in</strong>g,<br />
or mathematics (STEM) field<br />
Agriculture/<br />
natural<br />
resources<br />
Computer <strong>and</strong><br />
<strong>in</strong>formation<br />
sciences<br />
Eng<strong>in</strong>eer<strong>in</strong>g/<br />
eng<strong>in</strong>eer<strong>in</strong>g<br />
technologies<br />
Sex, race/ethnicity, nativity,<br />
<strong>and</strong> citizenship status<br />
Total<br />
Total<br />
Architecture<br />
Total 1 40,886,000 31.2 100.0 29.1 1.7 0.7 4.1 7.7<br />
Nativity<br />
Hispanic<br />
Born with<strong>in</strong> the United States 3 4,036,000 18.1 100.0 21.3 1.1 0.9 3.2 5.1<br />
Born outside the United States 4,361,000 8.3 100.0 33.2 1.0 2.0 4.6 13.1<br />
Asian<br />
Born with<strong>in</strong> the United States 3 647,000 60.6 100.0 37.9 0.9 0.8 5.8 10.0<br />
Born outside the United States 1,784,000 62.9 100.0 56.8 0.7 0.9 12.3 22.0<br />
Citizenship status<br />
U.S.-born citizen 33,020,000 32.0 100.0 25.3 1.8 0.7 3.0 5.7<br />
Naturalized citizen 2,053,000 37.9 100.0 37.8 0.5 0.9 8.0 8.9<br />
Noncitizen 5,814,000 24.6 100.0 52.3 1.1 1.1 10.1 21.5<br />
See notes at end of table.<br />
Postsecondary Outcomes <strong>and</strong> Employment 237<br />
7<br />
Outcomes <strong>and</strong> Employment<br />
46
238 <strong>Higher</strong> <strong>Education</strong>: <strong>Gaps</strong> <strong>in</strong> <strong>Access</strong> <strong>and</strong> <strong>Persistence</strong> <strong>Study</strong><br />
Table 46-1. Number, percentage, <strong>and</strong> percentage distribution of young adults ages 25 to 34 with a bachelor’s or higher degree, by undergraduate field of study, sex,<br />
race/ethnicity, nativity, <strong>and</strong> citizenship status: 2010—Cont<strong>in</strong>ued<br />
Sex, race/ethnicity, nativity,<br />
<strong>and</strong> citizenship status<br />
Bachelor’s degree <strong>in</strong> a science, technology, eng<strong>in</strong>eer<strong>in</strong>g,<br />
or mathematics (STEM) field<br />
Biology/<br />
biomedical<br />
sciences<br />
Mathematics/<br />
statistics<br />
Physical<br />
sciences<br />
Bachelor’s degree <strong>in</strong> a non-STEM field<br />
Health<br />
professions/<br />
cl<strong>in</strong>ical<br />
sciences Total Bus<strong>in</strong>ess <strong>Education</strong><br />
All other<br />
fields of study<br />
Total 1 5.7 1.2 1.8 6.2 70.9 20.1 9.4 41.4<br />
Sex<br />
Male 5.4 1.5 2.4 2.5 64.7 22.9 4.5 37.3<br />
Female 5.9 1.0 1.4 9.1 75.7 18.0 13.2 44.6<br />
Race/ethnicity<br />
White 5.4 1.1 1.7 6.0 74.0 19.7 10.9 43.4<br />
Black 4.9 0.9 1.4 7.8 74.5 23.7 8.0 42.8<br />
Hispanic 4.5 0.9 1.3 4.8 74.8 22.4 8.8 43.6<br />
Asian 8.3 2.0 3.2 7.3 48.1 18.8 2.5 26.7<br />
Native Hawaiian/Pacific Isl<strong>and</strong>er ‡ ‡ ‡ ‡ 74.2 21.3 5.7 ! 47.2<br />
American Indian/Alaska Native 2 5.6 ‡ 2.2 ! 5.1 70.8 19.9 13.4 37.4<br />
American Indian 4.9 ‡ 2.2 ! 5.0 ! 71.9 20.0 14.3 37.7<br />
Alaska Native ‡ ‡ ‡ ‡ ‡ ‡ ‡ ‡<br />
Two or more races 7.4 1.3 2.4 5.5 70.1 17.8 5.6 46.7<br />
Race/ethnicity by sex<br />
Male<br />
White 5.0 1.5 2.2 2.1 68.8 23.8 5.1 39.9<br />
Black 4.5 1.1 2.0 3.1 70.9 25.9 5.6 39.4<br />
Hispanic 4.7 1.4 1.9 2.1 66.5 23.2 4.5 38.8<br />
Asian 7.9 2.2 3.8 4.2 37.3 16.3 0.8 20.3<br />
Native Hawaiian/Pacific Isl<strong>and</strong>er ‡ ‡ ‡ ‡ 77.4 28.0 ‡ 46.4<br />
American Indian/Alaska Native 2 10.5 ‡ 4.3 ! ‡ 53.6 18.7 3.9 ! 31.1<br />
American Indian 9.4 ! ‡ ‡ ‡ 55.2 18.1 4.5 ! 32.6<br />
Alaska Native ‡ ‡ ‡ ‡ ‡ ‡ ‡ ‡<br />
Two or more races 6.7 0.9 ! 3.5 3.2 64.1 19.9 4.0 40.2<br />
Female<br />
White 5.7 0.9 1.3 9.1 78.1 16.5 15.5 46.2<br />
Black 5.2 0.8 1.1 10.5 76.7 22.4 9.4 44.8<br />
Hispanic 4.3 0.6 0.9 6.7 80.8 21.8 11.9 47.1<br />
Asian 8.7 1.8 2.7 9.8 57.1 20.9 4.0 32.1<br />
Native Hawaiian/Pacific Isl<strong>and</strong>er ‡ ‡ ‡ 5.1 69.4 11.1 ! ‡ 48.6<br />
American Indian/Alaska Native 2 2.0 ! ‡ ‡ 7.8 83.0 20.9 20.2 42.0<br />
American Indian ‡ ‡ ‡ ‡ 84.7 21.4 21.8 41.6<br />
Alaska Native ‡ ‡ ‡ ‡ ‡ ‡ ‡ ‡<br />
Two or more races 7.9 1.7 1.5 7.3 74.8 16.1 6.9 51.8<br />
See notes at end of table.
Table 46-1. Number, percentage, <strong>and</strong> percentage distribution of young adults ages 25 to 34 with a bachelor’s or higher degree, by undergraduate field of study, sex,<br />
race/ethnicity, nativity, <strong>and</strong> citizenship status: 2010—Cont<strong>in</strong>ued<br />
Sex, race/ethnicity, nativity,<br />
<strong>and</strong> citizenship status<br />
Bachelor’s degree <strong>in</strong> a science, technology, eng<strong>in</strong>eer<strong>in</strong>g,<br />
or mathematics (STEM) field<br />
Biology/<br />
biomedical<br />
sciences<br />
Mathematics/<br />
statistics<br />
Physical<br />
sciences<br />
Bachelor’s degree <strong>in</strong> a non-STEM field<br />
Health<br />
professions/<br />
cl<strong>in</strong>ical<br />
sciences Total Bus<strong>in</strong>ess <strong>Education</strong><br />
All other<br />
fields of study<br />
Total 1 5.7 1.2 1.8 6.2 70.9 20.1 9.4 41.4<br />
Nativity<br />
Hispanic<br />
Born with<strong>in</strong> the United States 3 4.7 0.7 1.0 4.6 78.7 21.2 8.7 48.8<br />
Born outside the United States 4.0 1.3 2.0 5.2 66.8 24.8 8.9 33.1<br />
Asian<br />
Born with<strong>in</strong> the United States 3 10.9 1.5 1.6 6.4 62.1 20.0 2.7 39.4<br />
Born outside the United States 7.4 2.2 3.8 7.6 43.2 18.4 2.5 22.3<br />
Citizenship status<br />
U.S.-born citizen 5.4 1.1 1.5 6.0 74.7 20.0 10.4 44.3<br />
Naturalized citizen 7.9 1.4 2.1 8.1 62.2 25.2 4.1 32.9<br />
Noncitizen 6.1 2.2 3.8 6.4 47.7 18.7 4.3 24.7<br />
! Interpret data with caution. The coefficient of variation (CV) for this estimate is 30 percent or greater.<br />
‡ Report<strong>in</strong>g st<strong>and</strong>ards not met. There are either too few cases or the coefficient of variation (CV) is 50 percent or greater.<br />
1<br />
Total <strong>in</strong>cludes other racial/ethnic groups not shown separately <strong>in</strong> the table.<br />
2<br />
Includes persons report<strong>in</strong>g American Indian alone, Alaska Native alone, <strong>and</strong> persons from American Indian <strong>and</strong>/or Alaska Native tribes specified or unspecified.<br />
3<br />
Born with<strong>in</strong> the United States <strong>in</strong>cludes the 50 states, the District of Columbia, Puerto Rico, Guam, the U.S. Virg<strong>in</strong> Isl<strong>and</strong>s, the Northern Marianas, <strong>and</strong> those born abroad of American parents.<br />
NOTE: Estimates are for the entire population <strong>in</strong> the <strong>in</strong>dicated age range, <strong>in</strong>clud<strong>in</strong>g persons <strong>in</strong> both households <strong>and</strong> group quarters. A household <strong>in</strong>cludes all the persons who occupy a hous<strong>in</strong>g unit. A group<br />
quarters is a nontypical household-type liv<strong>in</strong>g arrangement where people live or stay <strong>in</strong> a group liv<strong>in</strong>g arrangement that is owned or managed by an entity or organization provid<strong>in</strong>g hous<strong>in</strong>g <strong>and</strong>/or services for<br />
the residents. Group quarters <strong>in</strong>clude such places as college residence halls, residential treatment centers, skilled nurs<strong>in</strong>g facilities, group homes, military barracks, correctional facilities, <strong>and</strong> workers’ dormitories.<br />
Respondents were allowed to <strong>in</strong>dicate two major undergraduate fields of study; data reflect the first reported field of study. STEM fields, as def<strong>in</strong>ed here, <strong>in</strong>clude agriculture <strong>and</strong> natural resources, biology <strong>and</strong><br />
biomedical sciences, computer <strong>and</strong> <strong>in</strong>formation sciences, eng<strong>in</strong>eer<strong>in</strong>g <strong>and</strong> eng<strong>in</strong>eer<strong>in</strong>g technologies, health professions <strong>and</strong> cl<strong>in</strong>ical sciences, mathematics <strong>and</strong> statistics, <strong>and</strong> physical sciences <strong>and</strong> science<br />
technologies. This <strong>in</strong>dicator provides <strong>in</strong>formation on the percentage of graduates <strong>in</strong> undergraduate STEM fields, but does not provide an <strong>in</strong>dication of the percentage of graduates <strong>in</strong> other fields who also took<br />
significant amounts of STEM coursework or those who have a second major <strong>in</strong> a STEM field. Data are assembled based on major field aggregations. In the major field aggregations that were not classified as<br />
STEM, some <strong>in</strong>dividual fields could be classified as STEM (such as econometrics with<strong>in</strong> social sciences <strong>and</strong> history). Detail may not sum to totals because of round<strong>in</strong>g. Race categories exclude persons of Hispanic<br />
ethnicity.<br />
SOURCE: U.S. Department of Commerce, Census Bureau, American Community Survey (ACS), 2010.<br />
Postsecondary Outcomes <strong>and</strong> Employment 239<br />
7<br />
Outcomes <strong>and</strong> Employment<br />
46
240 <strong>Higher</strong> <strong>Education</strong>: <strong>Gaps</strong> <strong>in</strong> <strong>Access</strong> <strong>and</strong> <strong>Persistence</strong> <strong>Study</strong><br />
Table 46-2. Percentage of young adults ages 25 to 34 with a bachelor’s or higher degree who were <strong>in</strong> the labor force <strong>and</strong> were employed <strong>in</strong> any occupation, by<br />
undergraduate field of study, sex, race/ethnicity, nativity, <strong>and</strong> citizenship status: 2010<br />
Bachelor’s degree <strong>in</strong> a science, technology, eng<strong>in</strong>eer<strong>in</strong>g, or mathematics (STEM) field<br />
Agriculture/<br />
natural<br />
resources<br />
Computer <strong>and</strong><br />
<strong>in</strong>formation<br />
sciences<br />
Eng<strong>in</strong>eer<strong>in</strong>g/<br />
eng<strong>in</strong>eer<strong>in</strong>g<br />
technologies<br />
Biology/<br />
biomedical<br />
sciences<br />
Sex, race/ethnicity, nativity,<br />
<strong>and</strong> citizenship status<br />
Total<br />
Total<br />
Architecture<br />
Total 1 94.9 95.6 95.4 86.3 95.1 95.3 96.0<br />
Sex<br />
Male 94.8 95.5 96.0 87.3 95.5 95.6 95.6<br />
Female 95.0 95.9 94.5 84.3 93.8 94.5 96.2<br />
Race/ethnicity<br />
White 95.7 96.6 96.0 91.0 95.8 96.2 96.8<br />
Black 91.1 91.4 87.1 68.3 89.5 89.4 92.9<br />
Hispanic 93.5 93.5 95.0 80.5 96.8 91.5 94.0<br />
Asian 93.6 95.1 91.1 76.1 94.7 96.0 94.9<br />
Native Hawaiian/Pacific Isl<strong>and</strong>er 96.5 ‡ ‡ ‡ ‡ ‡ ‡<br />
American Indian/Alaska Native 2 96.6 96.4 ‡ ‡ ‡ ‡ ‡<br />
American Indian 96.0 95.6 ‡ ‡ ‡ ‡ ‡<br />
Alaska Native ‡ ‡ ‡ ‡ ‡ ‡ ‡<br />
Two or more races 94.7 94.4 ‡ ‡ 96.0 93.0 95.3<br />
Race/ethnicity by sex<br />
Male<br />
White 95.4 96.0 96.2 89.8 96.0 96.2 96.2<br />
Black 90.8 88.8 ‡ ‡ 87.6 88.3 93.6<br />
Hispanic 94.0 94.5 97.6 82.9 97.6 93.6 95.9<br />
Asian 94.5 96.0 100.0 87.1 95.6 96.3 94.2<br />
Native Hawaiian/Pacific Isl<strong>and</strong>er 97.1 ‡ ‡ ‡ ‡ ‡ ‡<br />
American Indian/Alaska Native 2 95.0 94.8 ‡ ‡ ‡ ‡ ‡<br />
American Indian 94.2 93.7 ‡ ‡ ‡ ‡ ‡<br />
Alaska Native ‡ ‡ ‡ ‡ ‡ ‡ ‡<br />
Two or more races 94.5 94.1 100.0 55.4 ! 94.9 92.9 97.2<br />
Female<br />
White 96.0 97.2 95.8 93.3 94.4 96.2 97.2<br />
Black 91.4 93.5 ‡ ‡ 92.4 92.3 92.6<br />
Hispanic 93.1 92.2 91.4 76.0 94.6 82.7 92.5<br />
Asian 92.7 93.6 79.8 64.8 92.9 95.2 95.5<br />
Native Hawaiian/Pacific Isl<strong>and</strong>er 95.3 ‡ ‡ ‡ ‡ ‡ ‡<br />
American Indian/Alaska Native 2 98.0 ‡ ‡ ‡ ‡ ‡ ‡<br />
American Indian 97.5 ‡ ‡ ‡ ‡ ‡ ‡<br />
Alaska Native ‡ ‡ ‡ ‡ ‡ ‡ ‡<br />
Two or more races 94.8 94.7 ‡ ‡ ‡ 93.6 94.0<br />
See notes at end of table.
Table 46-2. Percentage of young adults ages 25 to 34 with a bachelor’s or higher degree who were <strong>in</strong> the labor force <strong>and</strong> were employed <strong>in</strong> any occupation, by<br />
undergraduate field of study, sex, race/ethnicity, nativity, <strong>and</strong> citizenship status: 2010—Cont<strong>in</strong>ued<br />
Bachelor’s degree <strong>in</strong> a science, technology, eng<strong>in</strong>eer<strong>in</strong>g, or mathematics (STEM) field<br />
Agriculture/<br />
natural<br />
resources<br />
Computer <strong>and</strong><br />
<strong>in</strong>formation<br />
sciences<br />
Eng<strong>in</strong>eer<strong>in</strong>g/<br />
eng<strong>in</strong>eer<strong>in</strong>g<br />
technologies<br />
Biology/<br />
biomedical<br />
sciences<br />
Sex, race/ethnicity, nativity,<br />
<strong>and</strong> citizenship status<br />
Total<br />
Total<br />
Architecture<br />
Total 1 94.9 95.6 95.4 86.3 95.1 95.3 96.0<br />
Nativity<br />
Hispanic<br />
Born with<strong>in</strong> the United States 3 94.1 94.4 92.8 82.0 96.1 94.0 94.4<br />
Born outside the United States 92.1 92.3 ‡ 79.0 97.9 89.3 93.1<br />
Asian<br />
Born with<strong>in</strong> the United States 3 93.5 94.2 ‡ ‡ 92.8 94.3 93.7<br />
Born outside the United States 93.7 95.3 97.0 71.2 95.1 96.3 95.5<br />
Citizenship status<br />
U.S.-born citizen 95.3 96.1 95.4 88.2 95.4 95.8 96.1<br />
Naturalized citizen 92.8 93.8 100.0 82.6 94.0 92.9 95.1<br />
Noncitizen 93.1 94.7 92.7 76.0 94.9 94.9 95.4<br />
See notes at end of table.<br />
Postsecondary Outcomes <strong>and</strong> Employment 241<br />
7<br />
Outcomes <strong>and</strong> Employment<br />
46
242 <strong>Higher</strong> <strong>Education</strong>: <strong>Gaps</strong> <strong>in</strong> <strong>Access</strong> <strong>and</strong> <strong>Persistence</strong> <strong>Study</strong><br />
Table 46-2. Percentage of young adults ages 25 to 34 with a bachelor’s or higher degree who were <strong>in</strong> the labor force <strong>and</strong> were employed <strong>in</strong> any occupation, by<br />
undergraduate field of study, sex, race/ethnicity, nativity, <strong>and</strong> citizenship status: 2010—Cont<strong>in</strong>ued<br />
Sex, race/ethnicity, nativity,<br />
<strong>and</strong> citizenship status<br />
Bachelor’s degree <strong>in</strong> a science, technology, eng<strong>in</strong>eer<strong>in</strong>g,<br />
or mathematics (STEM) field<br />
Mathematics/<br />
statistics<br />
Physical<br />
sciences<br />
Bachelor’s degree <strong>in</strong> a non-STEM field<br />
Health<br />
professions/<br />
cl<strong>in</strong>ical<br />
sciences Total Bus<strong>in</strong>ess <strong>Education</strong><br />
All other<br />
fields of study<br />
Total 1 95.5 96.4 97.1 94.6 94.7 97.0 94.1<br />
Sex<br />
Male 95.6 96.4 96.4 94.5 94.9 97.2 93.8<br />
Female 95.5 96.4 97.3 94.7 94.3 96.9 94.2<br />
Race/ethnicity<br />
White 95.4 97.1 98.1 95.4 95.7 97.5 94.8<br />
Black 95.8 91.2 94.4 91.0 90.6 95.0 90.6<br />
Hispanic 94.0 95.1 96.3 93.5 93.3 95.3 93.2<br />
Asian 96.6 95.9 94.9 91.9 91.8 92.8 92.0<br />
Native Hawaiian/Pacific Isl<strong>and</strong>er ‡ ‡ ‡ 96.5 ‡ ‡ 96.0<br />
American Indian/Alaska Native 2 ‡ ‡ ‡ 96.7 97.7 97.9 95.8<br />
American Indian ‡ ‡ ‡ 96.2 97.3 97.8 95.0<br />
Alaska Native ‡ ‡ ‡ ‡ ‡ ‡ ‡<br />
Two or more races ‡ 96.5 94.4 94.8 97.5 96.6 93.5<br />
Race/ethnicity by sex<br />
Male<br />
White 95.3 96.7 97.2 95.1 95.8 97.9 94.2<br />
Black 95.4 87.4 88.4 91.6 90.6 97.2 91.4<br />
Hispanic 94.3 93.2 97.6 93.7 93.0 92.9 94.2<br />
Asian 98.2 98.4 97.1 91.8 91.9 93.7 91.6<br />
Native Hawaiian/Pacific Isl<strong>and</strong>er ‡ ‡ ‡ 97.9 ‡ ‡ ‡<br />
American Indian/Alaska Native 2 ‡ ‡ ‡ 95.2 ‡ ‡ 93.2<br />
American Indian ‡ ‡ ‡ 94.6 96.9 ‡ 92.3<br />
Alaska Native ‡ ‡ ‡ ‡ ‡ ‡ ‡<br />
Two or more races 83.7 97.8 97.0 94.7 97.9 89.8 93.5<br />
Female<br />
White 95.6 97.6 98.2 95.7 95.5 97.3 95.2<br />
Black 96.3 94.7 95.5 90.7 90.5 94.2 90.1<br />
Hispanic 93.4 98.2 96.0 93.3 93.5 96.1 92.6<br />
Asian 94.5 92.1 94.1 92.0 91.7 92.6 92.2<br />
Native Hawaiian/Pacific Isl<strong>and</strong>er ‡ ‡ ‡ ‡ ‡ ‡ ‡<br />
American Indian/Alaska Native 2 ‡ ‡ ‡ 97.5 98.0 97.5 97.3<br />
American Indian ‡ ‡ ‡ 97.1 97.6 ‡ 96.7<br />
Alaska Native ‡ ‡ ‡ ‡ ‡ ‡ ‡<br />
Two or more races ‡ ‡ ‡ 94.9 97.0 100.0 93.5
Table 46-2. Percentage of young adults ages 25 to 34 with a bachelor’s or higher degree who were <strong>in</strong> the labor force <strong>and</strong> were employed <strong>in</strong> any occupation, by<br />
undergraduate field of study, sex, race/ethnicity, nativity, <strong>and</strong> citizenship status: 2010—Cont<strong>in</strong>ued<br />
Sex, race/ethnicity, nativity,<br />
<strong>and</strong> citizenship status<br />
Bachelor’s degree <strong>in</strong> a science, technology, eng<strong>in</strong>eer<strong>in</strong>g,<br />
or mathematics (STEM) field<br />
Mathematics/<br />
statistics<br />
Physical<br />
sciences<br />
Bachelor’s degree <strong>in</strong> a non-STEM field<br />
Health<br />
professions/<br />
cl<strong>in</strong>ical<br />
sciences Total Bus<strong>in</strong>ess <strong>Education</strong><br />
All other<br />
fields of study<br />
Total 1 95.5 96.4 97.1 94.6 94.7 97.0 94.1<br />
Nativity<br />
Hispanic<br />
Born with<strong>in</strong> the United States 3 94.7 93.7 96.7 94.0 94.6 96.0 93.4<br />
Born outside the United States 93.2 96.7 95.4 92.1 90.5 93.9 92.7<br />
Asian<br />
Born with<strong>in</strong> the United States 3 95.2 94.2 98.7 93.0 94.1 96.1 92.3<br />
Born outside the United States 97.1 96.2 93.8 91.3 90.7 90.9 91.8<br />
Citizenship status<br />
U.S.-born citizen 95.4 96.3 97.9 95.0 95.3 97.3 94.3<br />
Naturalized citizen 91.6 95.3 94.3 92.1 91.8 93.1 92.3<br />
Noncitizen 97.6 97.1 93.5 91.1 90.3 92.2 91.6<br />
! Interpret data with caution. The coefficient of variation (CV) for this estimate is 30 percent or greater.<br />
‡ Report<strong>in</strong>g st<strong>and</strong>ards not met. There are either too few cases or the coefficient of variation (CV) is 50 percent or greater.<br />
1<br />
Total <strong>in</strong>cludes other racial/ethnic groups not shown separately <strong>in</strong> the table.<br />
2<br />
Includes persons report<strong>in</strong>g American Indian alone, Alaska Native alone, <strong>and</strong> persons from American Indian <strong>and</strong>/or Alaska Native tribes specified or unspecified.<br />
3<br />
Born with<strong>in</strong> the United States <strong>in</strong>cludes the 50 states, the District of Columbia, Puerto Rico, Guam, the U.S. Virg<strong>in</strong> Isl<strong>and</strong>s, the Northern Marianas, <strong>and</strong> those born abroad of American parents.<br />
NOTE: Estimates are for the entire population <strong>in</strong> the <strong>in</strong>dicated age range, <strong>in</strong>clud<strong>in</strong>g persons <strong>in</strong> both households <strong>and</strong> group quarters. A household <strong>in</strong>cludes all the persons who occupy a hous<strong>in</strong>g unit. A group<br />
quarters is a nontypical household-type liv<strong>in</strong>g arrangement where people live or stay <strong>in</strong> a group liv<strong>in</strong>g arrangement that is owned or managed by an entity or organization provid<strong>in</strong>g hous<strong>in</strong>g <strong>and</strong>/or services for<br />
the residents. Group quarters <strong>in</strong>clude such places as college residence halls, residential treatment centers, skilled nurs<strong>in</strong>g facilities, group homes, military barracks, correctional facilities, <strong>and</strong> workers’ dormitories.<br />
Labor force status refers to the full calendar week prior to the week when the respondent answered the questions. Respondents were allowed to <strong>in</strong>dicate two major undergraduate fields of study; data reflect<br />
the first reported field of study. STEM fields, as def<strong>in</strong>ed here, <strong>in</strong>clude agriculture <strong>and</strong> natural resources, biology <strong>and</strong> biomedical sciences, computer <strong>and</strong> <strong>in</strong>formation sciences, eng<strong>in</strong>eer<strong>in</strong>g <strong>and</strong> eng<strong>in</strong>eer<strong>in</strong>g<br />
technologies, health professions <strong>and</strong> cl<strong>in</strong>ical sciences, mathematics <strong>and</strong> statistics, <strong>and</strong> physical sciences <strong>and</strong> science technologies. This <strong>in</strong>dicator provides <strong>in</strong>formation on the percentage of graduates <strong>in</strong><br />
undergraduate STEM fields, but does not provide an <strong>in</strong>dication of the percentage of graduates <strong>in</strong> other fields who also took significant amounts of STEM coursework or those who have a second major <strong>in</strong> a STEM<br />
field. Data are assembled based on major field aggregations. In the major field aggregations that were not classified as STEM, some <strong>in</strong>dividual fields could be classified as STEM (such as econometrics with<strong>in</strong> social<br />
sciences <strong>and</strong> history). Detail may not sum to totals because of round<strong>in</strong>g. Race categories exclude persons of Hispanic ethnicity.<br />
SOURCE: U.S. Department of Commerce, Census Bureau, American Community Survey (ACS), 2010.<br />
Postsecondary Outcomes <strong>and</strong> Employment 243<br />
7<br />
Outcomes <strong>and</strong> Employment<br />
46
244 <strong>Higher</strong> <strong>Education</strong>: <strong>Gaps</strong> <strong>in</strong> <strong>Access</strong> <strong>and</strong> <strong>Persistence</strong> <strong>Study</strong><br />
Table 46-3. Percentage distribution of young adults ages 25 to 34 with a bachelor’s or higher degree who have a bachelor’s degree <strong>in</strong> a science, technology,<br />
eng<strong>in</strong>eer<strong>in</strong>g, or mathematics (STEM) field, are <strong>in</strong> the labor force, <strong>and</strong> are employed, by occupation type, sex, race/ethnicity, nativity, <strong>and</strong> citizenship<br />
status: 2010<br />
Science, technology, eng<strong>in</strong>eer<strong>in</strong>g, or mathematics (STEM) occupation<br />
Sex, race/ethnicity, nativity, <strong>and</strong><br />
citizenship status Total Total<br />
Computer<br />
scientists<br />
Eng<strong>in</strong>eers/<br />
architects Scientists<br />
Medical<br />
professionals<br />
Health<br />
professionals<br />
Agriculture <strong>and</strong><br />
forestry workers<br />
Total 1 100.0 55.7 14.1 11.4 5.4 23.1 1.3 0.4<br />
Sex<br />
Male 100.0 53.0 19.8 16.3 5.1 10.7 0.6 0.5<br />
Female 100.0 59.0 7.0 5.2 5.7 38.6 2.3 0.2<br />
Race/ethnicity<br />
White 100.0 55.4 10.2 12.2 5.9 25.4 1.3 0.4<br />
Black 100.0 48.1 11.0 7.0 3.7 23.0 3.0 0.3 !<br />
Hispanic 100.0 43.6 9.4 11.1 3.6 17.5 1.5 0.6 !<br />
Asian 100.0 64.2 29.4 10.4 5.2 18.1 0.8 0.2 !<br />
Native Hawaiian/Pacific Isl<strong>and</strong>er ‡ ‡ ‡ ‡ ‡ ‡ ‡ ‡<br />
American Indian/Alaska Native 2 100.0 45.8 6.5 ! 18.7 ‡ 9.8 ‡ ‡<br />
American Indian 100.0 46.4 ‡ 20.8 ‡ 9.8 ! ‡ ‡<br />
Alaska Native ‡ ‡ ‡ ‡ ‡ ‡ ‡ ‡<br />
Two or more races 100.0 51.0 13.5 8.5 5.9 21.9 1.2 ! ‡<br />
Race/ethnicity by sex<br />
Male<br />
White 100.0 51.7 15.7 18.3 5.7 10.9 0.5 0.5<br />
Black 100.0 44.5 17.4 11.1 4.4 9.7 1.1 ! 0.7 !<br />
Hispanic 100.0 41.7 12.8 14.9 3.4 8.7 1.1 ! 0.8 !<br />
Asian 100.0 63.7 34.8 12.5 4.4 11.0 0.7 ‡<br />
Native Hawaiian/Pacific Isl<strong>and</strong>er ‡ ‡ ‡ ‡ ‡ ‡ ‡ ‡<br />
American Indian/Alaska Native 2 100.0 38.4 9.5 ! 19.8 ‡ 5.9 ! ‡ ‡<br />
American Indian 100.0 39.5 ‡ 23.9 ‡ ‡ ‡ ‡<br />
Alaska Native ‡ ‡ ‡ ‡ ‡ ‡ ‡ ‡<br />
Two or more races 100.0 49.4 18.6 13.0 4.5 ! 12.8 ‡ ‡<br />
Female<br />
White 100.0 59.8 3.4 4.8 6.1 43.1 2.2 0.2<br />
Black 100.0 50.8 6.1 4.0 3.2 33.1 4.4 ‡<br />
Hispanic 100.0 46.5 4.5 5.6 3.8 30.1 2.2 ‡<br />
Asian 100.0 64.9 21.2 7.2 6.4 28.8 1.1 ‡<br />
Native Hawaiian/Pacific Isl<strong>and</strong>er ‡ ‡ ‡ ‡ ‡ ‡ ‡ ‡<br />
American Indian/Alaska Native 2 100.0 61.9 ‡ ‡ ‡ 18.2 ! 27.3 ! ‡<br />
American Indian ‡ ‡ ‡ ‡ ‡ ‡ ‡ ‡<br />
Alaska Native ‡ ‡ ‡ ‡ ‡ ‡ ‡ ‡<br />
Two or more races 100.0 52.9 7.6 3.3 ! 7.4 32.6 2.0 ! ‡<br />
See notes at end of table.
Table 46-3. Percentage distribution of young adults ages 25 to 34 with a bachelor’s or higher degree who have a bachelor’s degree <strong>in</strong> a science, technology,<br />
eng<strong>in</strong>eer<strong>in</strong>g, or mathematics (STEM) field, are <strong>in</strong> the labor force, <strong>and</strong> are employed, by occupation type, sex, race/ethnicity, nativity, <strong>and</strong> citizenship<br />
status: 2010—Cont<strong>in</strong>ued<br />
Science, technology, eng<strong>in</strong>eer<strong>in</strong>g, or mathematics (STEM) occupation<br />
Sex, race/ethnicity, nativity,<br />
<strong>and</strong> citizenship status Total Total<br />
Computer<br />
scientists<br />
Eng<strong>in</strong>eers/<br />
architects Scientists<br />
Medical<br />
professionals<br />
Health<br />
professionals<br />
Agriculture <strong>and</strong><br />
forestry workers<br />
Total 1 100.0 55.7 14.1 11.4 5.4 23.1 1.3 0.4<br />
Nativity<br />
Hispanic<br />
Born with<strong>in</strong> the United States 3 100.0 48.2 8.9 12.5 4.0 21.0 1.4 ‡<br />
Born outside the United States 100.0 37.3 10.2 9.1 3.1 12.6 1.6 ! 0.8 !<br />
Asian<br />
Born with<strong>in</strong> the United States 3 100.0 56.4 12.5 10.6 4.7 27.3 1.3 ! ‡<br />
Born outside the United States 100.0 66.1 33.7 10.4 5.3 15.7 0.7 0.2 !<br />
Citizenship status<br />
U.S.-born citizen 100.0 54.5 9.9 12.0 5.2 25.7 1.4 0.4<br />
Naturalized citizen 100.0 57.7 17.2 9.3 3.3 26.4 1.2 ‡<br />
Noncitizen 100.0 59.5 30.0 9.8 7.2 11.2 1.1 0.3 !<br />
See notes at end of table.<br />
Postsecondary Outcomes <strong>and</strong> Employment 245<br />
7<br />
Outcomes <strong>and</strong> Employment<br />
46
246 <strong>Higher</strong> <strong>Education</strong>: <strong>Gaps</strong> <strong>in</strong> <strong>Access</strong> <strong>and</strong> <strong>Persistence</strong> <strong>Study</strong><br />
Table 46-3. Percentage distribution of young adults ages 25 to 34 with a bachelor’s or higher degree who have a bachelor’s degree <strong>in</strong> a science, technology,<br />
eng<strong>in</strong>eer<strong>in</strong>g, or mathematics (STEM) field, are <strong>in</strong> the labor force, <strong>and</strong> are employed, by occupation type, sex, race/ethnicity, nativity, <strong>and</strong> citizenship<br />
status: 2010—Cont<strong>in</strong>ued<br />
Non-STEM occupation<br />
Human/<br />
Sex, race/ethnicity, nativity,<br />
<strong>and</strong> citizenship status<br />
Total<br />
Bus<strong>in</strong>ess<br />
workers/<br />
managers Educators<br />
Legal<br />
professionals<br />
protective<br />
services<br />
workers<br />
Military<br />
personnel<br />
Other<br />
Total 1 44.3 17.5 7.8 1.0 1.6 0.4 15.9<br />
Sex<br />
Male 47.0 20.3 6.7 1.1 1.5 0.6 16.8<br />
Female 41.0 14.1 9.2 0.9 1.7 0.2 ! 14.9<br />
Race/ethnicity<br />
White 44.6 18.0 8.0 1.2 1.7 0.5 15.3<br />
Black 51.9 19.1 7.7 0.7 3.4 0.8 ! 20.2<br />
Hispanic 56.4 17.1 7.1 0.8 2.2 0.4 ! 28.8<br />
Asian 35.8 15.9 7.1 0.7 0.7 0.1 ! 11.4<br />
Native Hawaiian/Pacific Isl<strong>and</strong>er ‡ ‡ ‡ ‡ ‡ ‡ ‡<br />
American Indian/Alaska Native 2 54.2 19.8 5.7 ! ‡ ‡ ‡ 26.9<br />
American Indian 53.6 19.5 ‡ ‡ ‡ ‡ 25.8<br />
Alaska Native ‡ ‡ ‡ ‡ ‡ ‡ ‡<br />
Two or more races 49.0 17.2 9.9 ‡ 1.0 ! ‡ 18.7<br />
Race/ethnicity by sex<br />
Male<br />
White 48.3 21.3 6.7 1.3 1.6 0.7 16.6<br />
Black 55.5 21.9 6.1 ‡ 3.2 1.2 ! 22.4<br />
Hispanic 58.3 17.8 5.5 0.9 ! 2.0 0.7 ! 31.5<br />
Asian 36.3 17.6 7.1 0.6 0.8 0.1 ! 10.1<br />
Native Hawaiian/Pacific Isl<strong>and</strong>er ‡ ‡ ‡ ‡ ‡ ‡ ‡<br />
American Indian/Alaska Native 2 61.6 23.1 ‡ ‡ ‡ ‡ 31.3<br />
American Indian 60.5 22.3 ! ‡ ‡ ‡ ‡ 29.4<br />
Alaska Native ‡ ‡ ‡ ‡ ‡ ‡ ‡<br />
Two or more races 50.6 20.6 8.8 ‡ ‡ ‡ 18.6<br />
Female<br />
White 40.2 13.9 9.7 1.0 1.8 0.2 ! 13.7<br />
Black 49.2 17.0 9.0 0.8 ! 3.5 ‡ 18.5<br />
Hispanic 53.5 16.1 9.4 0.7 ! 2.4 ‡ 24.8<br />
Asian 35.1 13.2 7.1 0.9 0.5 ‡ 13.3<br />
Native Hawaiian/Pacific Isl<strong>and</strong>er ‡ ‡ ‡ ‡ ‡ ‡ ‡<br />
American Indian/Alaska Native 2 38.1 12.6 ! ‡ ‡ ‡ ‡ 17.5 !<br />
American Indian ‡ ‡ ‡ ‡ ‡ ‡ ‡<br />
Alaska Native ‡ ‡ ‡ ‡ ‡ ‡ ‡<br />
Two or more races 47.1 13.2 11.1 ‡ ‡ ‡ 18.9<br />
See notes at end of table.
Postsecondary Outcomes <strong>and</strong> Employment 247<br />
Table 46-3. Percentage distribution of young adults ages 25 to 34 with a bachelor’s or higher degree who have a bachelor’s degree <strong>in</strong> a science, technology,<br />
eng<strong>in</strong>eer<strong>in</strong>g, or mathematics (STEM) field, are <strong>in</strong> the labor force, <strong>and</strong> are employed, by occupation type, sex, race/ethnicity, nativity, <strong>and</strong> citizenship<br />
status: 2010—Cont<strong>in</strong>ued<br />
Non-STEM occupation<br />
Human/<br />
Sex, race/ethnicity, nativity,<br />
<strong>and</strong> citizenship status<br />
Total<br />
Bus<strong>in</strong>ess<br />
workers/<br />
managers Educators<br />
Legal<br />
professionals<br />
protective<br />
services<br />
workers<br />
Military<br />
personnel<br />
Other<br />
Total 1 44.3 17.5 7.8 1.0 1.6 0.4 15.9<br />
Nativity<br />
Hispanic<br />
Born with<strong>in</strong> the United States 3 51.8 17.7 7.5 1.1 2.4 0.6 ! 22.6<br />
Born outside the United States 62.7 16.4 6.5 ‡ 1.9 ! ‡ 37.3<br />
Asian<br />
Born with<strong>in</strong> the United States 3 43.6 20.6 5.8 1.9 0.8 ! ‡ 14.3<br />
Born outside the United States 33.9 14.7 7.5 0.4 0.6 ‡ 10.6<br />
Citizenship status<br />
U.S.-born citizen 45.5 18.1 7.7 1.2 1.8 0.5 16.1<br />
Naturalized citizen 42.3 19.0 4.9 0.7 ! 1.4 0.4 ! 15.8<br />
Noncitizen 40.5 14.5 9.5 0.3 0.8 ‡ 15.4<br />
! Interpret data with caution. The coefficient of variation (CV) for this estimate is 30 percent or greater.<br />
‡ Report<strong>in</strong>g st<strong>and</strong>ards not met. There are either too few cases or the coefficient of variation (CV) is 50 percent or greater.<br />
1<br />
Total <strong>in</strong>cludes other racial/ethnic groups not shown separately <strong>in</strong> the table.<br />
2<br />
Includes persons report<strong>in</strong>g American Indian alone, Alaska Native alone, <strong>and</strong> persons from American Indian <strong>and</strong>/or Alaska Native tribes specified or unspecified.<br />
3<br />
Born with<strong>in</strong> the United States <strong>in</strong>cludes the 50 states, the District of Columbia, Puerto Rico, Guam, the U.S. Virg<strong>in</strong> Isl<strong>and</strong>s, the Northern Marianas, <strong>and</strong> those born abroad of American parents.<br />
NOTE: Estimates are for the entire population <strong>in</strong> the <strong>in</strong>dicated age range, <strong>in</strong>clud<strong>in</strong>g persons <strong>in</strong> both households <strong>and</strong> group quarters. A household <strong>in</strong>cludes all the persons who occupy a hous<strong>in</strong>g unit. A group<br />
quarters is a nontypical household-type liv<strong>in</strong>g arrangement where people live or stay <strong>in</strong> a group liv<strong>in</strong>g arrangement that is owned or managed by an entity or organization provid<strong>in</strong>g hous<strong>in</strong>g <strong>and</strong>/or services for<br />
the residents. Group quarters <strong>in</strong>clude such places as college residence halls, residential treatment centers, skilled nurs<strong>in</strong>g facilities, group homes, military barracks, correctional facilities, <strong>and</strong> workers’ dormitories.<br />
Labor force status refers to the full calendar week prior to the week when the respondent answered the questions. Respondents were allowed to <strong>in</strong>dicate two major undergraduate fields of study; data reflect<br />
the first reported field of study. STEM fields, as def<strong>in</strong>ed here, <strong>in</strong>clude agriculture <strong>and</strong> natural resources, biology <strong>and</strong> biomedical sciences, computer <strong>and</strong> <strong>in</strong>formation sciences, eng<strong>in</strong>eer<strong>in</strong>g <strong>and</strong> eng<strong>in</strong>eer<strong>in</strong>g<br />
technologies, health professions <strong>and</strong> cl<strong>in</strong>ical sciences, mathematics <strong>and</strong> statistics, <strong>and</strong> physical sciences <strong>and</strong> science technologies. This <strong>in</strong>dicator provides <strong>in</strong>formation on the percentage of graduates <strong>in</strong><br />
undergraduate STEM fields, but does not provide an <strong>in</strong>dication of the percentage of graduates <strong>in</strong> other fields who also took significant amounts of STEM coursework or those who have a second major <strong>in</strong> a STEM<br />
field. Data are assembled based on major field aggregations. In the major field aggregations that were not classified as STEM, some <strong>in</strong>dividual fields could be classified as STEM (such as econometrics with<strong>in</strong><br />
social sciences <strong>and</strong> history). Scientists <strong>in</strong>clude those <strong>in</strong> various discipl<strong>in</strong>es such as astronomers, chemists, <strong>and</strong> social scientists. Medical professionals <strong>in</strong>clude medical doctors, pharmacists, registered nurses <strong>and</strong><br />
nurse practitioners, <strong>and</strong> emergency medical technicians. Health professionals <strong>in</strong>clude various support personnel such as occupational therapy aides <strong>and</strong> dental assistants. The field of <strong>in</strong>struction for educators is<br />
not specified <strong>in</strong> the survey. Detail may not sum to totals because of round<strong>in</strong>g. Race categories exclude persons of Hispanic ethnicity.<br />
SOURCE: U.S. Department of Commerce, Census Bureau, American Community Survey (ACS), 2010.<br />
7<br />
Outcomes <strong>and</strong> Employment<br />
46
Chapter 8<br />
Multivariate Analyses of Immediate<br />
Postsecondary Enrollment <strong>and</strong> Degree Atta<strong>in</strong>ment<br />
248 <strong>Higher</strong> <strong>Education</strong>: <strong>Gaps</strong> <strong>in</strong> <strong>Access</strong> <strong>and</strong> <strong>Persistence</strong> <strong>Study</strong>
The discussion of immediate postsecondary enrollment<br />
among 2004 high school seniors <strong>and</strong> degree atta<strong>in</strong>ment<br />
of 2004 beg<strong>in</strong>n<strong>in</strong>g postsecondary students (see <strong>in</strong>dicators<br />
34 <strong>and</strong> 37, respectively) demonstrated a number of<br />
bivariate relationships between these outcome measures<br />
<strong>and</strong> students’ sex <strong>and</strong> race/ethnicity. For example, among<br />
2004 high school seniors, a higher percentage of females<br />
than males immediately enrolled <strong>in</strong> a postsecondary<br />
<strong>in</strong>stitution after graduat<strong>in</strong>g from high school (77 vs. 71<br />
percent). Lower percentages of American Indians/Alaska<br />
Natives (60 percent), Hispanics (65 percent), Blacks (69<br />
percent), <strong>and</strong> students of two or more races (65 percent)<br />
than Whites (77 percent) <strong>and</strong> Asians (86 percent) enrolled<br />
<strong>in</strong> postsecondary education immediately after high<br />
school graduation. Also, a higher percentage of 2003–04<br />
beg<strong>in</strong>n<strong>in</strong>g postsecondary female students than male<br />
students had atta<strong>in</strong>ed some type of postsecondary degree<br />
(i.e., certificate, associate’s, or bachelor’s) by June 2009 (52<br />
vs. 46 percent). The percentages of Blacks (37 percent),<br />
American Indian/Alaska Natives (38 percent), Hispanics<br />
(41 percent), <strong>and</strong> students of two or more races (47<br />
percent) who atta<strong>in</strong>ed some type of postsecondary degree<br />
were lower than the percentages of Whites (54 percent)<br />
<strong>and</strong> Asians (58 percent) who atta<strong>in</strong>ed a degree.<br />
These bivariate analyses compare the overall percentages<br />
for different groups of students without adjust<strong>in</strong>g for<br />
student background characteristics. One of the limitations<br />
of bivariate analyses is that they compare <strong>in</strong>formation<br />
across groups without tak<strong>in</strong>g <strong>in</strong>to account the <strong>in</strong>fluence<br />
of other factors that may also be related to differences.<br />
Multivariate analyses, such as logistic multiple regression<br />
models, provide <strong>in</strong>formation on whether group differences<br />
persist after controll<strong>in</strong>g for other student, family, <strong>and</strong><br />
school/<strong>in</strong>stitutional characteristics. This chapter presents<br />
results from two sets of logistic regression analyses that<br />
can provide answers to questions about postsecondary<br />
enrollment <strong>and</strong> degree atta<strong>in</strong>ment, such as “How is a high<br />
school student’s participation <strong>in</strong> extracurricular activities<br />
associated with immediate enrollment <strong>in</strong> a postsecondary<br />
<strong>in</strong>stitution, hold<strong>in</strong>g other factors, such as socioeconomic<br />
status, constant?”<br />
The purpose of this chapter is to identify student, family,<br />
<strong>and</strong> school/<strong>in</strong>stitutional factors that are significantly<br />
associated with the odds that a student will immediately<br />
enroll <strong>in</strong> a postsecondary <strong>in</strong>stitution after complet<strong>in</strong>g<br />
high school <strong>and</strong> the odds that a student will atta<strong>in</strong> an<br />
associate’s or bachelor’s degree with<strong>in</strong> 6 years of beg<strong>in</strong>n<strong>in</strong>g<br />
postsecondary enrollment. By conduct<strong>in</strong>g separate logistic<br />
regression models for the overall sample as well as for each<br />
subgroup, associations between student characteristics<br />
<strong>and</strong> the two outcome variables can be presented for the<br />
full sample as well as separately for males <strong>and</strong> females;<br />
separately for Whites, Blacks, <strong>and</strong> Hispanics; <strong>and</strong><br />
separately for males <strong>and</strong> females with<strong>in</strong> each of these<br />
racial/ethnic groups. When attempt<strong>in</strong>g to exam<strong>in</strong>e the<br />
significance of <strong>in</strong>teractions between variables, the nature<br />
of the survey data available for the analyses (e.g., smaller<br />
sample sizes for m<strong>in</strong>ority males <strong>and</strong> females, low variance<br />
on some <strong>in</strong>dependent groups for some of the smaller<br />
subgroups) yielded poor results <strong>and</strong> precluded the use<br />
of <strong>in</strong>teraction terms <strong>in</strong> the f<strong>in</strong>al models. Multivariate<br />
analyses were not conducted for Asians, Native<br />
Hawaiians/Pacific Isl<strong>and</strong>ers, or American Indians/Alaska<br />
Natives due to small sample sizes. Also, for the Black<br />
male <strong>and</strong> female <strong>and</strong> Hispanic male <strong>and</strong> female subgroup<br />
models, some of the results that appear to be substantive<br />
<strong>in</strong> magnitude are not statistically significant due to small<br />
subgroup sample sizes.<br />
The variables <strong>in</strong>cluded as predictors <strong>and</strong> covariates for<br />
each analysis are supported by previous research <strong>and</strong><br />
reflect many of the factors <strong>in</strong>cluded <strong>in</strong> the <strong>in</strong>dicator<br />
chapters of this report. To identify early <strong>in</strong>dicators that<br />
may assist policymakers <strong>and</strong> practitioners <strong>in</strong> develop<strong>in</strong>g<br />
<strong>in</strong>tervention strategies, the analyses used base year<br />
covariates to the greatest extent possible. As noted <strong>in</strong> the<br />
chapter <strong>in</strong>troductions, many studies have documented<br />
the associations between student background variables<br />
(e.g., poverty, family <strong>in</strong>come, <strong>and</strong> parents’ education)<br />
<strong>and</strong> educational outcomes (e.g., postsecondary<br />
enrollment, persistence, <strong>and</strong> atta<strong>in</strong>ment rates) as well<br />
as between student behavior (e.g., grade retention,<br />
student employment, <strong>and</strong> participation <strong>in</strong> sports <strong>and</strong><br />
extracurricular activities) <strong>and</strong> educational outcomes. Some<br />
studies have shown that higher rates of postsecondary<br />
persistence <strong>and</strong> degree atta<strong>in</strong>ment are associated with such<br />
student characteristics as strong academic achievement<br />
<strong>in</strong> high school, immediate entry <strong>in</strong>to postsecondary<br />
education after high school, full-time <strong>and</strong> cont<strong>in</strong>uous<br />
enrollment, academic <strong>and</strong> social engagement with faculty<br />
<strong>and</strong> peers, work<strong>in</strong>g part time for less than 15 hours a<br />
week while enrolled, <strong>and</strong> beg<strong>in</strong>n<strong>in</strong>g at a 4-year <strong>in</strong>stitution<br />
<strong>in</strong>stead of a 2-year community college (see Pascarella<br />
<strong>and</strong> Terenz<strong>in</strong>i [2005] for a comprehensive review of the<br />
research).<br />
Methodology<br />
In order to further explore factors that are associated with<br />
immediate postsecondary enrollment after high school<br />
<strong>and</strong> atta<strong>in</strong>ment of an associate’s or bachelor’s degree<br />
with<strong>in</strong> 6 years of beg<strong>in</strong>n<strong>in</strong>g postsecondary education,<br />
two logistic regression analyses were conducted. The<br />
first logistic regression model, immediate postsecondary<br />
enrollment, used data from the <strong>Education</strong> Longitud<strong>in</strong>al<br />
<strong>Study</strong> of 2002 (ELS:2002), <strong>in</strong>clud<strong>in</strong>g data from the<br />
base-year data collection <strong>in</strong> 2002, the first follow-up<br />
round <strong>in</strong> 2004, <strong>and</strong> the second follow-up round <strong>in</strong><br />
2006. Independent variables for this model are based<br />
on data from students’ sophomore or freshman year<br />
<strong>in</strong> high school (e.g., 9th-grade GPA). The dependent<br />
variable—immediate postsecondary enrollment—is<br />
based on data collected dur<strong>in</strong>g the second follow-up <strong>in</strong><br />
2006. The second model, atta<strong>in</strong>ment of an associate’s<br />
or bachelor’s degree with<strong>in</strong> 6 years of beg<strong>in</strong>n<strong>in</strong>g<br />
postsecondary education, used data from the Beg<strong>in</strong>n<strong>in</strong>g<br />
Postsecondary Students Longitud<strong>in</strong>al <strong>Study</strong> (BPS:04/09),<br />
<strong>in</strong>clud<strong>in</strong>g data from the base-year data collection <strong>in</strong><br />
2004, the first follow-up round <strong>in</strong> 2006, <strong>and</strong> the second<br />
Multivariate Analyses of Immediate Postsecondary Enrollment <strong>and</strong> Degree Atta<strong>in</strong>ment 249
follow-up round <strong>in</strong> 2009. Independent variables for<br />
this model are based on data from students’ first year of<br />
postsecondary enrollment or high school (e.g., high school<br />
mathematics coursetak<strong>in</strong>g). The dependent variable—<br />
degree atta<strong>in</strong>ment by June 2009—is based on data<br />
collected dur<strong>in</strong>g the second follow-up <strong>in</strong> 2009. For each<br />
regression model, all <strong>in</strong>dependent variables were entered<br />
simultaneously so that relationships between <strong>in</strong>dividual<br />
<strong>in</strong>dependent variables <strong>and</strong> the dependent variable could be<br />
described after controll<strong>in</strong>g for the effect of all of the other<br />
<strong>in</strong>dependent variables <strong>in</strong> the model. Detailed <strong>in</strong>formation<br />
about the logistic regression models, <strong>in</strong>clud<strong>in</strong>g the<br />
accuracy of the models, is provided <strong>in</strong> the technical<br />
appendix of this report.<br />
Interpret<strong>in</strong>g Logistic Model Results<br />
For the most part, results from the logistic regression<br />
analyses are presented <strong>in</strong> the form of odds ratios that<br />
compare the odds 7 of an event occurr<strong>in</strong>g <strong>in</strong> one group<br />
to the odds of it occurr<strong>in</strong>g <strong>in</strong> another group, after<br />
controll<strong>in</strong>g for the effect of all of the other <strong>in</strong>dependent<br />
variables <strong>in</strong> the model. Odds ratios are calculated for<br />
each of the categorical <strong>in</strong>dependent variables used <strong>in</strong> the<br />
regression models <strong>and</strong> represent the likelihood of students<br />
<strong>in</strong> one category of an <strong>in</strong>dependent variable (referred to<br />
as the identity group) complet<strong>in</strong>g an event relative to a<br />
reference group. If the event is equally likely to occur<br />
for both groups, then the odds ratio value equals one.<br />
If a category has an odds ratio that is less than one,<br />
then students <strong>in</strong> the identity group have lower odds<br />
of immediate postsecondary enrollment than students<br />
<strong>in</strong> the reference group. For example, the odds ratio of<br />
0.65 for males (table ELS-2) is the ratio of the odds of<br />
males immediately enroll<strong>in</strong>g <strong>in</strong> postsecondary education<br />
after high school to the odds of females immediately<br />
enroll<strong>in</strong>g, after account<strong>in</strong>g for the effect of all of the other<br />
<strong>in</strong>dependent variables <strong>in</strong> the model. The odds ratio of 0.65<br />
<strong>in</strong>dicates that the odds of a male immediately enroll<strong>in</strong>g<br />
<strong>in</strong> postsecondary education after high school graduation<br />
are 35 percent lower ((odds ratio – 1) × 100) than the<br />
odds for a female (i.e., males are less likely than females<br />
to immediately enroll <strong>in</strong> postsecondary education). In<br />
this example, females are the reference category for the<br />
<strong>in</strong>dependent variable. If a group category has an odds<br />
ratio greater than one, then students <strong>in</strong> the identity<br />
category are more likely to exhibit a certa<strong>in</strong> outcome than<br />
students <strong>in</strong> the reference category. For example, the odds<br />
ratio of 1.63 for students who first enrolled <strong>in</strong> a 4-year<br />
postsecondary <strong>in</strong>stitution (table BPS-2) <strong>in</strong>dicates that a<br />
student who first enrolled <strong>in</strong> a 4-year <strong>in</strong>stitution has 63<br />
percent higher odds of atta<strong>in</strong><strong>in</strong>g a degree with<strong>in</strong> 6 years<br />
than a student who first enrolled <strong>in</strong> a less-than-4-year<br />
<strong>in</strong>stitution. For cont<strong>in</strong>uous <strong>in</strong>dependent variables such<br />
as st<strong>and</strong>ardized test scores or number of postsecondary<br />
<strong>in</strong>stitution transfers, results are also <strong>in</strong>terpreted <strong>in</strong> the<br />
form of odds ratios based on one unit of change <strong>in</strong> the<br />
<strong>in</strong>dependent variable. For example, <strong>in</strong> table ELS-2, the<br />
odds ratio of 1.88 for 9th-grade GPA <strong>in</strong>dicates that a<br />
7<br />
Odds represent a ratio between p, the probability that an event will occur,<br />
<strong>and</strong> 1-p, the probability that the event will not occur (computed p/(1-p)).<br />
one-po<strong>in</strong>t <strong>in</strong>crease <strong>in</strong> a student’s 9th-grade GPA value<br />
(e.g., from a 2.0 to a 3.0) is associated with an 88 percent<br />
<strong>in</strong>crease <strong>in</strong> the odds of the student immediately enroll<strong>in</strong>g<br />
<strong>in</strong> postsecondary education. Asterisks (*) are used <strong>in</strong><br />
tables to denote f<strong>in</strong>d<strong>in</strong>gs that are statistically significant<br />
at the .05 level. Detailed <strong>in</strong>formation about <strong>in</strong>terpretation<br />
of the logistic regression coefficients is provided <strong>in</strong> the<br />
technical appendix of this report.<br />
Immediate Postsecondary Enrollment<br />
Tables ELS-1a <strong>and</strong> ELS-1b compare the distributions<br />
of on-time 8 high school graduates <strong>in</strong> 2004 who did <strong>and</strong><br />
did not immediately enroll <strong>in</strong> postsecondary education<br />
after high school. Immediate enrollees had higher levels<br />
of socioeconomic status compared with students with<br />
no immediate postsecondary enrollment (0.20 st<strong>and</strong>ard<br />
deviations above the mean vs. 0.27 st<strong>and</strong>ard deviations<br />
below the mean), a higher mean 9th-grade grade po<strong>in</strong>t<br />
average (GPA) (3.02 vs. 2.38), <strong>and</strong> a higher mean<br />
10th-grade mathematics achievement test score (53.7<br />
vs. 46.5). In addition, higher percentages of immediate<br />
enrollees (than those who did not immediately enroll)<br />
were from two-parent/guardian households (80 percent<br />
vs. 72 percent), participated <strong>in</strong> sports (61 percent vs. 44<br />
percent), participated <strong>in</strong> two or more extracurricular<br />
activities (31 percent vs. 16 percent), <strong>and</strong> often discussed<br />
coursework with their parents (35 percent vs. 22 percent).<br />
Lower percentages of immediate enrollees (than those who<br />
did not immediately enroll) were ever reta<strong>in</strong>ed <strong>in</strong> 10th<br />
grade or earlier (19 percent vs. 36 percent), were absent<br />
from school seven or more times <strong>in</strong> the first semester (11<br />
percent vs. 19 percent), had cut or skipped classes seven<br />
or more times (3 percent vs. 7 percent), were employed<br />
<strong>and</strong> work<strong>in</strong>g more than 30 hours a week (6 percent vs. 9<br />
percent), or had at least one close friend who dropped out<br />
of school (14 percent vs. 29 percent).<br />
Associations between student characteristics <strong>and</strong><br />
immediate postsecondary enrollment were exam<strong>in</strong>ed for<br />
2004 on-time high school graduates overall, as well as<br />
separately for males <strong>and</strong> females; separately for Whites,<br />
Blacks, <strong>and</strong> Hispanics (table ELS-2); <strong>and</strong> separately for<br />
males <strong>and</strong> females with<strong>in</strong> each of these racial/ethnic<br />
groups (table ELS-3). Multivariate analyses were not<br />
conducted for Asians, Native Hawaiians/Pacific Isl<strong>and</strong>ers,<br />
or American Indians/Alaska Natives due to small sample<br />
sizes. Also, for the Black male <strong>and</strong> female <strong>and</strong> Hispanic<br />
male <strong>and</strong> female subgroup models, some of the results that<br />
appear to be substantive <strong>in</strong> magnitude are not statistically<br />
significant due to small subgroup sample sizes.<br />
Results from the first logistic model <strong>in</strong>dicate that the<br />
odds of a male immediately enroll<strong>in</strong>g <strong>in</strong> postsecondary<br />
education were 35 percent lower than the odds for a<br />
female, after account<strong>in</strong>g for all other student <strong>and</strong> family<br />
characteristics that were <strong>in</strong>cluded as <strong>in</strong>dependent variables<br />
<strong>in</strong> the model (table ELS-2). In terms of race/ethnicity,<br />
the odds of an Asian student immediately enroll<strong>in</strong>g <strong>in</strong><br />
postsecondary education after high school were 2.57<br />
8<br />
Students who graduated from high school by August 2004 or earlier.<br />
250 <strong>Higher</strong> <strong>Education</strong>: <strong>Gaps</strong> <strong>in</strong> <strong>Access</strong> <strong>and</strong> <strong>Persistence</strong> <strong>Study</strong>
times the odds for a White student. While the unadjusted<br />
bivariate results <strong>in</strong>dicate that lower percentages of Black<br />
than White high school graduates immediately enrolled<br />
<strong>in</strong> postsecondary education, the logistic regression models<br />
<strong>in</strong>dicate that Black students had 50 percent higher<br />
odds than White students of immediately enroll<strong>in</strong>g <strong>in</strong><br />
postsecondary education, after account<strong>in</strong>g for other<br />
student, family, <strong>and</strong> school factors. On-time high<br />
school graduates more likely to immediately enroll <strong>in</strong> a<br />
postsecondary <strong>in</strong>stitution also <strong>in</strong>cluded those with higher<br />
socioeconomic status, higher 10th-grade mathematics<br />
achievement, <strong>and</strong> a higher 9th-grade GPA. Additional<br />
results from the first logistic model are as follows:<br />
• Had been reta<strong>in</strong>ed: The odds of immediately<br />
enroll<strong>in</strong>g <strong>in</strong> postsecondary education for students<br />
who had been held back <strong>in</strong> 10th grade or earlier<br />
were 30 percent lower than the odds for those<br />
who had never been reta<strong>in</strong>ed.<br />
• High school sports: The odds of immediately<br />
enroll<strong>in</strong>g <strong>in</strong> postsecondary education for students<br />
who participated <strong>in</strong> high school sports were 57<br />
percent higher than the odds for those who did<br />
not participate <strong>in</strong> sports.<br />
• High school extracurricular activities: Students<br />
who participated <strong>in</strong> one extracurricular activity<br />
had 20 percent higher odds of immediate<br />
enrollment <strong>in</strong> postsecondary education than<br />
those who participated <strong>in</strong> no activities. Students<br />
who participated <strong>in</strong> two or more activities had<br />
43 percent higher odds of immediate enrollment<br />
than those who participated <strong>in</strong> no activities.<br />
• High school absenteeism: The odds of<br />
immediately enroll<strong>in</strong>g <strong>in</strong> postsecondary education<br />
for students who missed 7 or more days of school<br />
<strong>in</strong> the first semester or term of the school year<br />
were 29 percent lower than the odds for those<br />
who missed 0 to 2 days.<br />
• Cut or skipped class: The odds of immediately<br />
enroll<strong>in</strong>g <strong>in</strong> postsecondary education for<br />
students who skipped class at least once <strong>in</strong> the<br />
first semester or term of the school year were 18<br />
percent lower than the odds for those who had<br />
never skipped class.<br />
• Parental engagement: Students who often<br />
discussed school courses with their parents had<br />
44 percent higher odds of immediate enrollment<br />
<strong>in</strong> postsecondary education than those who never<br />
had these discussions with their parents.<br />
• High school student employment: The odds<br />
of immediately enroll<strong>in</strong>g <strong>in</strong> postsecondary<br />
education for students who worked more than 20<br />
hours per week were 29 percent lower than the<br />
odds for those who were not employed.<br />
• Close friends who dropped out: The odds of<br />
immediately enroll<strong>in</strong>g <strong>in</strong> postsecondary education<br />
for students who had one or more friends who<br />
dropped out of school were 19 percent lower than<br />
the odds for those who had no close friends who<br />
dropped out.<br />
Males <strong>and</strong> Females: Exam<strong>in</strong><strong>in</strong>g these variables<br />
separately for males <strong>and</strong> females (controll<strong>in</strong>g for race/<br />
ethnicity), the follow<strong>in</strong>g factors were related to a higher<br />
likelihood of immediate postsecondary enrollment for<br />
each sex: higher socioeconomic status, higher 10th-grade<br />
mathematics achievement, <strong>and</strong> higher 9th-grade GPA<br />
(table ELS-2). Other f<strong>in</strong>d<strong>in</strong>gs <strong>in</strong>clude the follow<strong>in</strong>g:<br />
• High school sports: Males who participated<br />
<strong>in</strong> high school sports had 58 percent higher<br />
odds of immediate enrollment <strong>in</strong> postsecondary<br />
education than those who did not participate <strong>in</strong><br />
sports. Females who participated <strong>in</strong> high school<br />
sports had 56 percent higher odds of immediate<br />
enrollment <strong>in</strong> postsecondary education than<br />
those who did not participate <strong>in</strong> sports.<br />
• High school extracurricular activities: Males<br />
participat<strong>in</strong>g <strong>in</strong> two or more activities had 54<br />
percent higher odds of immediate enrollment<br />
<strong>in</strong> postsecondary education than those who<br />
participated <strong>in</strong> no activities. Females participat<strong>in</strong>g<br />
<strong>in</strong> two or more activities had 33 percent higher<br />
odds of immediate enrollment <strong>in</strong> postsecondary<br />
education than those who participated <strong>in</strong> no<br />
activities.<br />
• High school absenteeism: The odds of<br />
immediately enroll<strong>in</strong>g <strong>in</strong> postsecondary education<br />
for females who missed 7 or more days of school<br />
<strong>in</strong> the first school term were 32 percent lower<br />
than the odds for those who missed 0 to 2 days.<br />
• Parental engagement: Males who often<br />
discussed school courses with their parents had<br />
40 percent higher odds of immediate enrollment<br />
<strong>in</strong> postsecondary education than those who never<br />
had these discussions with their parents. Females<br />
who often discussed school courses with their<br />
parents had 49 percent higher odds of immediate<br />
enrollment <strong>in</strong> postsecondary education than<br />
those who never had these discussions with their<br />
parents.<br />
• High school student employment: The odds<br />
of immediately enroll<strong>in</strong>g <strong>in</strong> postsecondary<br />
education for males who worked more than<br />
20 hours per week were 28 percent lower than<br />
the odds for those who were unemployed. The<br />
odds of immediately enroll<strong>in</strong>g <strong>in</strong> postsecondary<br />
education for females who worked more than 20<br />
hours per week were 33 percent lower than the<br />
odds for those who were unemployed.<br />
Multivariate Analyses<br />
8<br />
Multivariate Analyses of Immediate Postsecondary Enrollment <strong>and</strong> Degree Atta<strong>in</strong>ment 251
Whites: Exam<strong>in</strong><strong>in</strong>g these variables separately for<br />
Whites, the follow<strong>in</strong>g factors were related to a higher<br />
likelihood of immediate postsecondary enrollment: higher<br />
socioeconomic status, higher 10th-grade mathematics<br />
achievement, <strong>and</strong> higher 9th-grade GPA (table ELS-2).<br />
Other f<strong>in</strong>d<strong>in</strong>gs <strong>in</strong>clude the follow<strong>in</strong>g:<br />
• Sex: The odds of immediately enroll<strong>in</strong>g <strong>in</strong><br />
postsecondary education for White males were 36<br />
percent lower than the odds for White females.<br />
• High school sports: White students who<br />
participated <strong>in</strong> high school sports had 60<br />
percent higher odds of immediate enrollment <strong>in</strong><br />
postsecondary education than those who did not<br />
participate <strong>in</strong> sports.<br />
• High school extracurricular activities:<br />
White students participat<strong>in</strong>g <strong>in</strong> two or more<br />
extracurricular activities had 54 percent higher<br />
odds of immediate enrollment <strong>in</strong> postsecondary<br />
education than those who participated <strong>in</strong> no<br />
activities.<br />
• High school absenteeism: White students who<br />
missed 7 or more days of school <strong>in</strong> the first school<br />
term had 29 percent lower odds of immediate<br />
enrollment <strong>in</strong> postsecondary education than<br />
those who missed 0 to 2 days.<br />
• Cut or skipped class: White students who<br />
skipped class at least once had 23 percent lower<br />
odds of immediate enrollment <strong>in</strong> postsecondary<br />
education than those who had never skipped<br />
class.<br />
• Parental engagement: White students who often<br />
discussed school courses with their parents had<br />
38 percent higher odds of immediate enrollment<br />
<strong>in</strong> postsecondary education than those who never<br />
had these discussions with their parents.<br />
• High school student employment: The odds<br />
of immediately enroll<strong>in</strong>g <strong>in</strong> postsecondary<br />
education for White students who worked more<br />
than 20 hours per week were 28 percent lower<br />
than the odds for those who were unemployed.<br />
• Close friends who dropped out: The odds of<br />
immediately enroll<strong>in</strong>g <strong>in</strong> postsecondary education<br />
for White students who had one or more friends<br />
who dropped out of school were 31 percent lower<br />
than the odds of immediately enroll<strong>in</strong>g for those<br />
students who had no close friends who dropped<br />
out.<br />
White Males <strong>and</strong> Females: Exam<strong>in</strong><strong>in</strong>g these<br />
factors separately for White males <strong>and</strong> White females,<br />
the follow<strong>in</strong>g factors were related to a higher likelihood<br />
of immediate postsecondary enrollment for both<br />
groups: higher socioeconomic status, higher 10th-grade<br />
mathematics achievement, <strong>and</strong> a higher 9th-grade GPA<br />
(table ELS-3). Other f<strong>in</strong>d<strong>in</strong>gs <strong>in</strong>clude the follow<strong>in</strong>g:<br />
• Had been reta<strong>in</strong>ed: The odds of immediately<br />
enroll<strong>in</strong>g <strong>in</strong> postsecondary education for White<br />
males who had been held back <strong>in</strong> 10th grade or<br />
earlier were 34 percent lower than the odds for<br />
those who had never been reta<strong>in</strong>ed.<br />
• High school sports: White males who<br />
participated <strong>in</strong> high school sports had 64<br />
percent higher odds of immediate enrollment<br />
<strong>in</strong> postsecondary education than those who<br />
did not participate <strong>in</strong> sports. White females<br />
who participated <strong>in</strong> high school sports had 55<br />
percent higher odds of immediate enrollment <strong>in</strong><br />
postsecondary education than those who did not<br />
participate <strong>in</strong> sports.<br />
• High school extracurricular activities:<br />
White females participat<strong>in</strong>g <strong>in</strong> two or more<br />
extracurricular activities had 66 percent higher<br />
odds of immediate enrollment <strong>in</strong> postsecondary<br />
education than those who participated <strong>in</strong> no<br />
activities.<br />
• Parental engagement: White males who often<br />
discussed school courses with their parents had<br />
49 percent higher odds of immediate enrollment<br />
<strong>in</strong> postsecondary education than those who never<br />
had these discussions with their parents.<br />
• High school student employment: The odds<br />
of immediately enroll<strong>in</strong>g <strong>in</strong> postsecondary<br />
education for White females who worked more<br />
than 20 hours per week were 36 percent lower<br />
than the odds for those who were unemployed.<br />
• Close friends who dropped out: The odds of<br />
immediately enroll<strong>in</strong>g <strong>in</strong> postsecondary education<br />
for White males who had one or more friends<br />
who dropped out of school were 31 percent<br />
lower than the odds for those students who<br />
had no close friends who dropped out. White<br />
females who had at least one close friend who<br />
dropped out of school also had 31 percent lower<br />
odds of immediate enrollment <strong>in</strong> postsecondary<br />
education than those students who had no close<br />
friends who dropped out.<br />
Blacks: Exam<strong>in</strong><strong>in</strong>g these factors separately for Blacks,<br />
the follow<strong>in</strong>g factors were related to a higher likelihood<br />
of immediate postsecondary enrollment: higher<br />
socioeconomic status, higher 10th-grade mathematics<br />
achievement, <strong>and</strong> a higher 9th-grade GPA (table ELS-2).<br />
Other f<strong>in</strong>d<strong>in</strong>gs <strong>in</strong>clude the follow<strong>in</strong>g:<br />
• Had been reta<strong>in</strong>ed: Black students who had<br />
been held back <strong>in</strong> 10th grade or earlier had 46<br />
percent lower odds of immediate enrollment <strong>in</strong><br />
postsecondary education than those who had<br />
never been reta<strong>in</strong>ed.<br />
252 <strong>Higher</strong> <strong>Education</strong>: <strong>Gaps</strong> <strong>in</strong> <strong>Access</strong> <strong>and</strong> <strong>Persistence</strong> <strong>Study</strong>
Black Males <strong>and</strong> Females: Exam<strong>in</strong><strong>in</strong>g these factors<br />
separately for Black males <strong>and</strong> Black females, higher<br />
socioeconomic status <strong>and</strong> higher 10th-grade mathematics<br />
achievement were associated with a higher likelihood of<br />
immediate postsecondary enrollment for Black males,<br />
while a higher 9th-grade GPA was associated with a<br />
higher likelihood of immediate postsecondary enrollment<br />
for Black females (table ELS-3).<br />
Hispanics: Exam<strong>in</strong><strong>in</strong>g these factors separately for<br />
Hispanics, the follow<strong>in</strong>g factors were related to a higher<br />
likelihood of immediate postsecondary enrollment:<br />
higher 10th-grade mathematics achievement <strong>and</strong> a higher<br />
9th-grade GPA (table ELS-2). Other f<strong>in</strong>d<strong>in</strong>gs <strong>in</strong>clude the<br />
follow<strong>in</strong>g:<br />
• Sex: The odds of immediately enroll<strong>in</strong>g <strong>in</strong><br />
postsecondary education for Hispanic males<br />
were 41 percent lower than the odds for Hispanic<br />
females.<br />
• High school sports: Hispanic students who<br />
participated <strong>in</strong> high school sports had 73<br />
percent higher odds of immediate enrollment <strong>in</strong><br />
postsecondary education than those who did not<br />
participate <strong>in</strong> sports.<br />
Hispanic Males <strong>and</strong> Females: Exam<strong>in</strong><strong>in</strong>g these<br />
factors separately for Hispanic males <strong>and</strong> Hispanic<br />
females, higher 10th-grade mathematics achievement <strong>and</strong><br />
a higher 9th-grade GPA were associated with a higher<br />
likelihood of immediate postsecondary enrollment for<br />
both groups (table ELS-3). Additional f<strong>in</strong>d<strong>in</strong>gs <strong>in</strong>clude the<br />
follow<strong>in</strong>g:<br />
• Had been reta<strong>in</strong>ed: The odds of immediately<br />
enroll<strong>in</strong>g <strong>in</strong> postsecondary education for<br />
Hispanic females who had been held back <strong>in</strong> 10th<br />
grade or earlier were 59 percent lower than the<br />
odds for those who had never been reta<strong>in</strong>ed.<br />
• Had been reta<strong>in</strong>ed: The odds of immediately<br />
enroll<strong>in</strong>g <strong>in</strong> postsecondary education for<br />
Hispanic students who had been held back <strong>in</strong><br />
10th grade or earlier were 45 percent lower than<br />
the odds for those who had never been reta<strong>in</strong>ed.<br />
Multivariate Analyses<br />
8<br />
Multivariate Analyses of Immediate Postsecondary Enrollment <strong>and</strong> Degree Atta<strong>in</strong>ment 253
Table ELS-1a. Percentage distribution of immediate postsecondary enrollment status of on-time high school graduates, by<br />
sex, race, <strong>and</strong> other selected characteristics: 2006<br />
Characteristic<br />
Total<br />
Immediate postsecondary enrollment status<br />
Immediate<br />
enrollment<br />
No immediate<br />
enrollment<br />
Total 100.0 (†) 100.0 (†) 100.0 (†)<br />
Immediate postsecondary enrollment status<br />
Sex<br />
Immediate enrollment 69.7 (0.64) 100.0 (†) 0.0 (†)<br />
No immediate enrollment 30.4 (0.64) 0.0 (†) 100.0 (†)<br />
Male 48.2 (0.64) 45.5 (0.77) 54.3 (0.98)<br />
Female 51.8 (0.64) 54.5 (0.77) 45.7 (0.98)<br />
Race/ethnicity<br />
White 63.0 (0.95) 66.6 (1.04) 54.6 (1.40)<br />
Black 13.2 (0.61) 11.6 (0.60) 16.8 (0.98)<br />
Hispanic 14.2 (0.70) 11.7 (0.73) 20.1 (1.12)<br />
Asian 4.3 (0.27) 5.2 (0.35) 2.2 (0.25)<br />
Native Hawaiian/Pacific Isl<strong>and</strong>er 0.2 (0.04) ‡ (†) ‡ (†)<br />
American Indian/Alaska Native 0.9 (0.21) 0.6 (0.14) 1.4 ! (0.45)<br />
Two or more races 4.3 (0.24) 4.1 (0.30) 4.8 (0.42)<br />
Family composition<br />
Two-parent/two-guardian household 77.3 (0.50) 79.7 (0.56) 71.6 (0.89)<br />
S<strong>in</strong>gle-parent/s<strong>in</strong>gle-guardian household 22.7 (0.50) 20.3 (0.56) 28.4 (0.89)<br />
Previously reta<strong>in</strong>ed<br />
Never held back 76.3 (0.62) 81.5 (0.64) 64.4 (1.11)<br />
Held back <strong>in</strong> 10th grade or earlier 23.7 (0.62) 18.5 (0.64) 35.6 (1.11)<br />
Sports participation<br />
Did not participate <strong>in</strong> sports 43.7 (0.72) 38.7 (0.81) 55.6 (1.22)<br />
Participated <strong>in</strong> sports 56.3 (0.72) 61.3 (0.81) 44.4 (1.22)<br />
Extracurricular activities<br />
No extracurricular activities 46.3 (0.72) 40.9 (0.81) 58.8 (1.12)<br />
One extracurricular activity 27.2 (0.59) 28.1 (0.68) 25.1 (0.95)<br />
Two or more extracurricular activities 26.6 (0.62) 31.0 (0.74) 16.1 (0.74)<br />
Absences from school <strong>in</strong> first semester<br />
Absent 0 to 2 times 52.9 (0.70) 55.5 (0.81) 46.6 (1.18)<br />
Absent 3 to 6 times 33.6 (0.63) 33.3 (0.78) 34.1 (1.08)<br />
Absent 7 or more times 13.6 (0.41) 11.1 (0.48) 19.3 (0.96)<br />
Cut or skip school<br />
Never skipped class 73.0 (0.82) 76.8 (0.80) 64.2 (1.39)<br />
Skipped class 1 to 6 times 22.9 (0.70) 20.3 (0.73) 29.0 (1.13)<br />
Skipped class 7 or more times 4.1 (0.29) 2.9 (0.28) 6.8 (0.68)<br />
Parental engagement<br />
Never discuss coursework with parents 16.3 (0.62) 13.4 (0.66) 23.8 (1.12)<br />
Sometimes discuss coursework with parents 52.8 (0.65) 52.1 (0.77) 54.5 (1.23)<br />
Often discuss coursework with parents 30.9 (0.71) 34.5 (0.84) 21.6 (1.07)<br />
Hours work<strong>in</strong>g per week<br />
None 43.3 (0.76) 43.8 (0.88) 42.2 (1.36)<br />
1 to 20 hours per week 42.8 (0.76) 44.4 (0.87) 38.9 (1.36)<br />
21 to 30 hours per week 7.1 (0.34) 6.1 (0.38) 9.6 (0.66)<br />
More than 30 hours per week 6.7 (0.33) 5.7 (0.36) 9.3 (0.69)<br />
Close friends dropp<strong>in</strong>g out<br />
No friends dropped out of high school 82.1 (0.64) 86.1 (0.73) 71.4 (1.30)<br />
One or more friends dropped out of high school 17.9 (0.64) 13.9 (0.73) 28.6 (1.30)<br />
† Not applicable.<br />
! Interpret data with caution. The coefficient of variation (CV) for this estimate is 30 percent or greater.<br />
‡ Report<strong>in</strong>g st<strong>and</strong>ards not met (too few cases).<br />
NOTE: Estimates are based on the sample of students who had graduated from high school by August 2004 <strong>and</strong> who had a valid F2BYWT weight. St<strong>and</strong>ard<br />
errors appear <strong>in</strong> parentheses.<br />
SOURCE: U.S. Department of <strong>Education</strong>, National Center for <strong>Education</strong> Statistics, <strong>Education</strong> Longitud<strong>in</strong>al <strong>Study</strong> of 2002 (ELS:2002), “Second Follow-up, 2006.”<br />
254 <strong>Higher</strong> <strong>Education</strong>: <strong>Gaps</strong> <strong>in</strong> <strong>Access</strong> <strong>and</strong> <strong>Persistence</strong> <strong>Study</strong>
Table ELS-1b. Mean socioeconomic status score, 10th-grade mathematics score, <strong>and</strong> 9th-grade GPA for on-time high<br />
school graduates, overall <strong>and</strong> by immediate postsecondary enrollment status: 2006<br />
Characteristic<br />
Total<br />
Immediate postsecondary enrollment status<br />
Immediate<br />
enrollment<br />
No immediate<br />
enrollment<br />
St<strong>and</strong>ardized socioeconomic status (SES) score 0.06 (0.013) 0.20 (0.015) -0.27 (0.014)<br />
St<strong>and</strong>ardized 10th-grade mathematics test score 51.49 (0.165) 53.65 (0.176) 46.47 (0.214)<br />
Grade po<strong>in</strong>t average (GPA) <strong>in</strong> 9th grade 2.83 (0.013) 3.02 (0.014) 2.38 (0.018)<br />
NOTE: The SES score is based on five equally weighted, st<strong>and</strong>ardized components: father’s/guardian’s education, mother’s/guardian’s education,<br />
family <strong>in</strong>come, father’s/guardian’s occupation, <strong>and</strong> mother’s/guardian’s occupation. Estimates are based on the sample of students who had<br />
graduated from high school by August 2004 <strong>and</strong> who had a valid F2BYWT weight. St<strong>and</strong>ard errors appear <strong>in</strong> parentheses.<br />
SOURCE: U.S. Department of <strong>Education</strong>, National Center for <strong>Education</strong> Statistics, <strong>Education</strong> Longitud<strong>in</strong>al <strong>Study</strong> of 2002 (ELS:2002), “Second Follow-up,<br />
2006.”<br />
Multivariate Analyses<br />
8<br />
Multivariate Analyses of Immediate Postsecondary Enrollment <strong>and</strong> Degree Atta<strong>in</strong>ment 255
256 <strong>Higher</strong> <strong>Education</strong>: <strong>Gaps</strong> <strong>in</strong> <strong>Access</strong> <strong>and</strong> <strong>Persistence</strong> <strong>Study</strong><br />
Table ELS-2. Summary of logistic regression analyses for variables predict<strong>in</strong>g immediate enrollment <strong>in</strong> a postsecondary <strong>in</strong>stitution after complet<strong>in</strong>g high school, overall<br />
<strong>and</strong> by race/ethnicity <strong>and</strong> sex: 2006<br />
Characteristic<br />
Sex<br />
Coeff<br />
Total<br />
(n = 9,552)<br />
SE<br />
Race/ethnicity subgroup models<br />
Sex subgroup models<br />
White (n = 5,858) Black (n = 1,080) Hispanic (n = 1,189) Male (n = 4,518) Female (n = 5,034)<br />
Odds<br />
ratio Coeff SE<br />
Odds<br />
ratio Coeff SE<br />
Odds<br />
ratio Coeff SE<br />
Odds<br />
ratio Coeff SE<br />
Odds<br />
ratio Coeff SE<br />
Intercept -3.06 (0.276) † -3.16 (0.350) † -2.89 (0.855) † -2.45 (0.673) † -3.46 (0.402) † -3.08 (0.433) †<br />
Female † (†) † † (†) † † (†) † † (†) † † (†) † † (†) †<br />
Male -0.43 (0.075) 0.65 * -0.45 (0.101) 0.64 * -0.30 (0.218) 0.74 -0.52 (0.171) 0.59 * † (†) † † (†) †<br />
Race/ethnicity<br />
White † (†) † † (†) † † (†) † † (†) † † (†) † † (†) †<br />
Black 0.40 (0.174) 1.50 * † (†) † † (†) † † (†) † 0.43 (0.088) 1.54 * 0.37 (0.089) 1.45 *<br />
Hispanic 0.26 (0.106) 1.29 † (†) † † (†) † † (†) † 0.17 (#) 1.18 0.35 (#) 1.42<br />
Asian 0.94 (0.134) 2.57 * † (†) † † (†) † † (†) † 0.95 (0.121) 2.58 * 0.94 (0.113) 2.56 *<br />
Other -0.05 (0.176) 0.96 † (†) † † (†) † † (†) † -0.02 (0.006) 0.98 -0.08 (0.008) 0.92<br />
Socioeconomic status (SES)<br />
SES score 0.71 (0.065) 2.03 * 0.96 (0.096) 2.60 * 0.59 (0.171) 1.80 * 0.23 (0.136) 1.26 0.67 (0.088) 1.96 * 0.75 (0.089) 2.11 *<br />
Odds<br />
ratio<br />
Family composition<br />
Two-parent/two-guardian<br />
household † (†) † † (†) † † (†) † † (†) † † (†) † † (†) †<br />
S<strong>in</strong>gle-parent/s<strong>in</strong>gle-guardian<br />
household -0.01 (0.079) 0.99 0.02 (0.116) 1.02 -0.17 (0.204) 0.85 -0.04 (0.218) 0.96 -0.06 (0.121) 0.94 0.04 (0.113) 1.04<br />
Math score<br />
GPA<br />
St<strong>and</strong>ardized math test score 0.04 (0.005) 1.05 * 0.04 (0.006) 1.04 * 0.06 (0.017) 1.06 * 0.04 (0.011) 1.04 * 0.04 (0.006) 1.04 * 0.05 (0.008) 1.05 *<br />
9th-grade GPA 0.63 (0.051) 1.88 * 0.77 (0.072) 2.15 * 0.58 (0.180) 1.78 * 0.47 (0.128) 1.60 * 0.62 (0.080) 1.87 * 0.63 (0.078) 1.88 *<br />
Previously reta<strong>in</strong>ed<br />
Never held back † (†) † † (†) † † (†) † † (†) † † (†) † † (†) †<br />
Held back <strong>in</strong> 10th grade or<br />
earlier -0.35 (0.115) 0.70 * -0.21 (0.157) 0.81 -0.62 (0.293) 0.54 * -0.59 (0.267) 0.55 * -0.40 (0.158) 0.67 * -0.31 (0.171) 0.73<br />
Sports participation<br />
Did not participate <strong>in</strong> sports † (†) † † (†) † † (†) † † (†) † † (†) † † (†) †<br />
Participated <strong>in</strong> sports 0.45 (0.071) 1.57 * 0.47 (0.095) 1.60 * 0.28 (0.198) 1.32 0.55 (0.191) 1.73 * 0.46 (0.097) 1.58 * 0.44 (0.093) 1.56 *<br />
Extracurricular activities<br />
No extracurricular activities † (†) † † (†) † † (†) † † (†) † † (†) † † (†) †<br />
One extracurricular activity 0.18 (0.087) 1.20 * 0.17 (0.117) 1.18 0.29 (0.238) 1.33 0.32 (0.210) 1.37 0.25 (0.129) 1.28 0.11 (0.108) 1.12<br />
Two or more extracurricular<br />
activities 0.36 (0.092) 1.43 * 0.43 (0.120) 1.54 * 0.45 (0.273) 1.56 -0.07 (0.254) 0.94 0.43 (0.145) 1.54 * 0.28 (0.126) 1.33 *<br />
See notes at end of table.
Table ELS-2. Summary of logistic regression analyses for variables predict<strong>in</strong>g immediate enrollment <strong>in</strong> a postsecondary <strong>in</strong>stitution after complet<strong>in</strong>g high school, overall<br />
<strong>and</strong> by race/ethnicity <strong>and</strong> sex: 2006—Cont<strong>in</strong>ued<br />
Characteristic<br />
Absences from school<br />
Coeff<br />
Total<br />
(n = 9,552)<br />
SE<br />
Race/ethnicity subgroup models<br />
Sex subgroup models<br />
White (n = 5,858) Black (n = 1,080) Hispanic (n = 1,189) Male (n = 4,518) Female (n = 5,034)<br />
Odds<br />
ratio Coeff SE<br />
Odds<br />
ratio Coeff SE<br />
Odds<br />
ratio Coeff SE<br />
Odds<br />
ratio Coeff SE<br />
Odds<br />
ratio Coeff SE<br />
Absent 0 to 2 times † (†) † † (†) † † (†) † † (†) † † (†) † † (†) †<br />
Absent 3 to 6 times -0.07 (0.082) 0.93 -0.00 (0.106) 1.00 -0.31 (0.212) 0.74 -0.08 (0.194) 0.92 0.01 (0.112) 1.01 -0.17 (0.110) 0.85<br />
Absent 7 or more times -0.35 (0.114) 0.71 * -0.34 (0.138) 0.71 * -0.31 (0.339) 0.73 -0.28 (0.289) 0.75 -0.31 (0.171) 0.73 -0.39 (0.147) 0.68 *<br />
Cut or skip school<br />
Never skipped class † (†) † † (†) † † (†) † † (†) † † (†) † † (†) †<br />
Skipped class at least once -0.19 (0.083) 0.82 * -0.27 (0.122) 0.77 * -0.18 (0.193) 0.83 0.07 (0.199) 1.08 -0.20 (0.119) 0.82 -0.18 (0.111) 0.83<br />
Odds<br />
ratio<br />
Multivariate Analyses of Immediate Postsecondary Enrollment <strong>and</strong> Degree Atta<strong>in</strong>ment 257<br />
Parental engagement<br />
Never discuss coursework with parents † (†) † † (†) † † (†) † † (†) † † (†) † † (†) †<br />
Sometimes discuss coursework with<br />
parents 0.11 (0.092) 1.11 0.15 (0.121) 1.16 0.07 (0.295) 1.07 0.03 (0.240) 1.03 0.11 (0.120) 1.11 0.11 (0.143) 1.12<br />
Often discuss coursework with parents 0.37 (0.117) 1.44 * 0.32 (0.148) 1.38 * 0.49 (0.335) 1.63 0.40 (0.291) 1.50 0.34 (0.164) 1.40 * 0.40 (0.177) 1.49 *<br />
Hours work<strong>in</strong>g per week<br />
None † (†) † † (†) † † (†) † † (†) † † (†) † † (†) †<br />
1 to 20 hours per week -0.07 (0.083) 0.93 0.05 (0.103) 1.05 -0.20 (0.224) 0.82 -0.19 (0.196) 0.83 -0.17 (0.115) 0.84 0.04 (0.115) 1.04<br />
More than 20 hours per week -0.35 (0.120) 0.71 * -0.33 (0.140) 0.72 * -0.28 (0.303) 0.75 -0.39 (0.346) 0.67 -0.32 (0.153) 0.72 * -0.41 (0.160) 0.67 *<br />
Close friends dropp<strong>in</strong>g out<br />
No friends dropped out of high school † (†) † † (†) † † (†) † † (†) † † (†) † † (†) †<br />
One or more friends dropped out of<br />
high school -0.21 (0.096) 0.81 * -0.37 (0.114) 0.69 * -0.13 (0.303) 0.88 -0.08 (0.248) 0.92 -0.14 (0.155) 0.87 -0.29 (0.144) 0.75<br />
† Not applicable.<br />
# Rounds to zero.<br />
* p < .05.<br />
NOTE: Italics refer to reference categories. Estimates are based on the sample of students who had graduated from high school by August 2004 <strong>and</strong> who had a valid F2BYWT weight. Multivariate analyses were not<br />
conducted for Asians, Native Hawaiians/Pacific Isl<strong>and</strong>ers, or American Indians/Alaska Natives due to small sample sizes.<br />
SOURCE: U.S. Department of <strong>Education</strong>, National Center for <strong>Education</strong> Statistics, <strong>Education</strong> Longitud<strong>in</strong>al <strong>Study</strong> of 2002 (ELS:2002), “Second Follow-up, 2006.”<br />
8<br />
Multivariate Analyses
258 <strong>Higher</strong> <strong>Education</strong>: <strong>Gaps</strong> <strong>in</strong> <strong>Access</strong> <strong>and</strong> <strong>Persistence</strong> <strong>Study</strong><br />
Table ELS-3. Summary of logistic regression analyses for variables predict<strong>in</strong>g immediate enrollment <strong>in</strong> a postsecondary <strong>in</strong>stitution after complet<strong>in</strong>g high school, with<strong>in</strong><br />
race/ethnicity by sex subgroups: 2006<br />
Characteristic Coeff SE<br />
Race/ethnicity by sex subgroup models<br />
White Black Hispanic<br />
Male (n = 2,787) Female (n = 3,071) Male (n = 489) Female (n = 591 ) Male (n = 553) Female (n = 636)<br />
Odds<br />
ratio Coeff SE<br />
Odds<br />
ratio Coeff SE<br />
Odds<br />
ratio Coeff SE<br />
Odds<br />
ratio Coeff SE<br />
Odds<br />
ratio Coeff SE<br />
Intercept -3.30 (0.517) † -3.61 (0.550) † -2.99 (1.423) † -3.29 (1.225) † -3.42 (0.965) † -1.84 (0.905) †<br />
Socioeconomic status (SES)<br />
SES score 0.86 (0.132) 2.37 * 1.06 (0.125) 2.89 * 0.67 (0.222) 1.95 * 0.52 (0.267) 1.68 0.21 (0.201) 1.23 0.29 (0.220) 1.33<br />
Family composition<br />
Two-parent/two-guardian household † (†) † † (†) † † (†) † † (†) † † (†) † † (†) †<br />
S<strong>in</strong>gle-parent/s<strong>in</strong>gle-guardian household<br />
0.04 (0.154) 1.04 0.00 (0.179) 1.00 -0.24 (0.343) 0.79 -0.09 (0.291) 0.91 -0.24 (0.337) 0.79 0.18 (0.333) 1.19<br />
Math score<br />
GPA<br />
St<strong>and</strong>ardized math test score 0.03 (0.009) 1.03 * 0.05 (0.009) 1.05 * 0.06 (0.024) 1.07 * 0.05 (0.026) 1.05 0.05 (0.016) 1.05 * 0.04 (0.016) 1.04 *<br />
9th-grade GPA 0.78 (0.106) 2.17 * 0.75 (0.113) 2.11 * 0.47 (0.257) 1.59 0.74 (0.278) 2.09 * 0.50 (0.238) 1.65 * 0.42 (0.191) 1.52 *<br />
Odds<br />
ratio<br />
Previously reta<strong>in</strong>ed<br />
Never held back † (†) † † (†) † † (†) † † (†) † † (†) † † (†) †<br />
Held back <strong>in</strong> 10th grade or earlier -0.41 (0.204) 0.66 * 0.14 (0.252) 1.16 -0.65 (0.435) 0.52 -0.63 (0.400) 0.53 -0.26 (0.384) 0.77 -0.89 (0.441) 0.41 *<br />
Sports participation<br />
Did not participate <strong>in</strong> sports † (†) † † (†) † † (†) † † (†) † † (†) † † (†) †<br />
Participated <strong>in</strong> sports 0.49 (0.122) 1.64 * 0.44 (0.132) 1.55 * 0.37 (0.324) 1.44 0.23 (0.263) 1.25 0.52 (0.279) 1.68 0.57 (0.288) 1.76<br />
Extracurricular activities<br />
No extracurricular activities † (†) † † (†) † † (†) † † (†) † † (†) † † (†) †<br />
One extracurricular activity 0.18 (0.169) 1.20 0.16 (0.155) 1.18 0.51 (0.410) 1.66 0.13 (0.363) 1.14 0.53 (0.358) 1.71 0.20 (0.272) 1.23<br />
Two or more extracurricular activities 0.36 (0.184) 1.43 0.50 (0.164) 1.66 * 0.67 (0.404) 1.95 0.29 (0.396) 1.33 0.03 (0.435) 1.03 -0.22 (0.351) 0.80<br />
Absences from school<br />
Absent 0 to 2 times † (†) † † (†) † † (†) † † (†) † † (†) † † (†) †<br />
Absent 3 to 6 times 0.06 (0.156) 1.06 -0.08 (0.154) 0.93 -0.29 (0.295) 0.75 -0.36 (0.320) 0.70 0.11 (0.283) 1.11 -0.34 (0.293) 0.71<br />
Absent 7 or more times -0.33 (0.200) 0.72 -0.33 (0.205) 0.72 -0.15 (0.652) 0.86 -0.45 (0.421) 0.63 -0.15 (0.439) 0.86 -0.47 (0.412) 0.62<br />
See notes at end of table.
Table ELS-3. Summary of logistic regression analyses for variables predict<strong>in</strong>g immediate enrollment <strong>in</strong> a postsecondary <strong>in</strong>stitution after complet<strong>in</strong>g high school, with<strong>in</strong><br />
race/ethnicity by sex subgroups: 2006—Cont<strong>in</strong>ued<br />
Characteristic Coeff SE<br />
Cut or skip school<br />
Race/ethnicity by sex subgroup models<br />
White Black Hispanic<br />
Male (n = 2,787) Female (n = 3,071) Male (n = 489) Female (n = 591 ) Male (n = 553) Female (n = 636)<br />
Odds<br />
ratio Coeff SE<br />
Odds<br />
ratio Coeff SE<br />
Odds<br />
ratio Coeff SE<br />
Odds<br />
ratio Coeff SE<br />
Odds<br />
ratio Coeff SE<br />
Never skipped class † (†) † † (†) † † (†) † † (†) † † (†) † † (†) †<br />
Skipped class at least once -0.26 (0.162) 0.77 -0.27 (0.164) 0.77 -0.42 (0.322) 0.66 0.02 (0.308) 1.02 0.25 (0.330) 1.28 -0.08 (0.276) 0.92<br />
Parental engagement<br />
Never discuss coursework with parents † (†) † † (†) † † (†) † † (†) † † (†) † † (†) †<br />
Sometimes discuss coursework with<br />
parents 0.14 (0.159) 1.15 0.16 (0.209) 1.17 -0.39 (0.507) 0.67 0.54 (0.392) 1.72 0.12 (0.347) 1.13 -0.14 (0.327) 0.87<br />
Often discuss coursework with parents 0.40 (0.189) 1.49 * 0.25 (0.242) 1.28 0.19 (0.594) 1.21 0.81 (0.440) 2.26 0.00 (0.415) 1.00 0.67 (0.464) 1.96<br />
Odds<br />
ratio<br />
Multivariate Analyses of Immediate Postsecondary Enrollment <strong>and</strong> Degree Atta<strong>in</strong>ment 259<br />
Hours work<strong>in</strong>g per week<br />
None † (†) † † (†) † † (†) † † (†) † † (†) † † (†) †<br />
1 to 20 hours per week -0.08 (0.152) 0.93 0.16 (0.149) 1.18 -0.34 (0.351) 0.71 0.02 (0.318) 1.02 -0.29 (0.291) 0.75 -0.12 (0.293) 0.89<br />
More than 20 hours per week -0.30 (0.183) 0.74 -0.44 (0.203) 0.64 * -0.27 (0.442) 0.76 -0.31 (0.521) 0.73 -0.71 (0.543) 0.49 -0.18 (0.467) 0.83<br />
Close friends dropp<strong>in</strong>g out<br />
No friends dropped out of high school † (†) † † (†) † † (†) † † (†) † † (†) † † (†) †<br />
One or more friends dropped out of<br />
high school -0.37 (0.176) 0.69 * -0.37 (0.152) 0.69 * 0.03 (0.492) 1.03 -0.38 (0.392) 0.68 0.11 (0.338) 1.12 -0.24 (0.370) 0.79<br />
† Not applicable.<br />
* p < .05.<br />
NOTE: Italics refer to reference categories. Estimates are based on the sample of students who had graduated from high school by August 2004 <strong>and</strong> who had a valid F2BYWT weight. Multivariate analyses were not<br />
conducted for Asians, Native Hawaiians/Pacific Isl<strong>and</strong>ers, or American Indians/Alaska Natives due to small sample sizes.<br />
SOURCE: U.S. Department of <strong>Education</strong>, National Center for <strong>Education</strong> Statistics, <strong>Education</strong> Longitud<strong>in</strong>al <strong>Study</strong> of 2002 (ELS:2002), “Second Follow-up, 2006.”<br />
8<br />
Multivariate Analyses
Degree Atta<strong>in</strong>ment<br />
Table BPS-1 compares the distributions of recent high<br />
school graduates 9 who began postsecondary education <strong>in</strong><br />
academic year 2003–04 who did <strong>and</strong> did not complete<br />
an associate’s or bachelor’s degree by 2009. <strong>Higher</strong><br />
percentages of students who did atta<strong>in</strong> a degree by 2009<br />
than those who did not atta<strong>in</strong> a degree had a parent<br />
who held a bachelor’s degree or higher (57 percent vs.<br />
35 percent), were from the highest <strong>in</strong>come quartile (31<br />
percent vs. 15 percent), had taken precalculus/calculus<br />
<strong>in</strong> high school (54 percent vs. 28 percent), had earned<br />
college-level credits <strong>in</strong> high school (43 percent vs. 24<br />
percent), had taken the SAT or ACT (94 percent vs. 77<br />
percent), first attended a private nonprofit postsecondary<br />
<strong>in</strong>stitution (27 percent vs. 12 percent), first attended<br />
a 4-year postsecondary <strong>in</strong>stitution (76 percent vs. 40<br />
percent), declared a major dur<strong>in</strong>g their first year of<br />
enrollment (70 percent vs. 67 percent), sometimes or<br />
often met with a college advisor <strong>in</strong> 2004 (82 percent vs.<br />
62 percent), sometimes or often participated <strong>in</strong> school<br />
clubs <strong>in</strong> 2004 (46 percent vs. 22 percent), sometimes or<br />
often participated <strong>in</strong> school sports <strong>in</strong> 2004 (36 percent vs.<br />
19 percent), <strong>and</strong> were always enrolled full time through<br />
2009 (71 percent vs. 42 percent). In addition, lower<br />
percentages of students who did atta<strong>in</strong> an associate’s or<br />
bachelor’s degree by 2009 (compared to those with no<br />
degree atta<strong>in</strong>ment) took any remedial classes <strong>in</strong> 2004 (20<br />
percent vs. 27 percent), worked more than 20 hours a<br />
week (<strong>in</strong>clud<strong>in</strong>g work-study) (23 percent vs. 42 percent),<br />
experienced two or more stopout periods through 2009<br />
(3 percent vs. 17 percent), <strong>and</strong> transferred between<br />
<strong>in</strong>stitutions two or more times through 2009 (5 percent<br />
vs. 9 percent).<br />
Associations between student characteristics <strong>and</strong> degree<br />
atta<strong>in</strong>ment were exam<strong>in</strong>ed for 2003–04 beg<strong>in</strong>n<strong>in</strong>g<br />
postsecondary students who were recent high school<br />
graduates overall <strong>and</strong> separately for males <strong>and</strong> females;<br />
separately for Whites, Blacks, <strong>and</strong> Hispanics (table<br />
BPS-2); <strong>and</strong> separately for males <strong>and</strong> females with<strong>in</strong> each<br />
of these racial/ethnic groups (table BPS-3). Multivariate<br />
analyses were not conducted for Asians, Native<br />
Hawaiians/Pacific Isl<strong>and</strong>ers, or American Indians/Alaska<br />
Natives due to small sample sizes. Also, for the Black<br />
male <strong>and</strong> female <strong>and</strong> Hispanic male <strong>and</strong> female subgroup<br />
models, some of the results that appear to be substantive<br />
<strong>in</strong> magnitude are not statistically significant due to small<br />
subgroup sample sizes.<br />
Results from the second logistic model <strong>in</strong>dicate that the<br />
odds of atta<strong>in</strong><strong>in</strong>g either an associate’s or bachelor’s degree<br />
9<br />
In the BPS sample, recent high school graduates are students who graduated<br />
from high school <strong>in</strong> 2003 or 2004. BPS data are collected at the end of the<br />
first year of postsecondary enrollment. A small number of students <strong>in</strong> the sample<br />
(fewer than 150) reported that they graduated from high school <strong>in</strong> 2004.<br />
Students who were enrolled <strong>in</strong> high school <strong>and</strong> at a postsecondary <strong>in</strong>stitution<br />
concurrently were not eligible to be sampled for the BPS; however, students<br />
who completed high school <strong>in</strong> 2004 <strong>and</strong> then enrolled <strong>in</strong> a postsecondary<br />
course by June 2004 were eligible to be sampled.<br />
by 2009 for males were 32 percent lower than the odds<br />
of degree atta<strong>in</strong>ment for females, after account<strong>in</strong>g for<br />
other student, family, high school, <strong>and</strong> postsecondary<br />
<strong>in</strong>stitutional characteristics that were <strong>in</strong>cluded as<br />
<strong>in</strong>dependent variables <strong>in</strong> the model (table BPS-2).<br />
Compared with White students, Black students had 43<br />
percent lower odds <strong>and</strong> Hispanic students had 25 percent<br />
lower odds of atta<strong>in</strong><strong>in</strong>g an associate’s or bachelor’s degree,<br />
after account<strong>in</strong>g for other factors. After controll<strong>in</strong>g for<br />
sex, race/ethnicity, <strong>and</strong> other characteristics listed <strong>in</strong> table<br />
BPS-1, f<strong>in</strong>d<strong>in</strong>gs for academic year 2003–04 beg<strong>in</strong>n<strong>in</strong>g<br />
postsecondary students who were recent high school<br />
graduates <strong>in</strong>clude the follow<strong>in</strong>g:<br />
• Income quartile <strong>in</strong> 2003–04: The odds of<br />
complet<strong>in</strong>g a degree program for students who<br />
were <strong>in</strong> the highest <strong>in</strong>come quartile were 2.08<br />
times the odds for those <strong>in</strong> the lowest <strong>in</strong>come<br />
quartile.<br />
• Parents’ educational atta<strong>in</strong>ment: Students<br />
whose parents had completed a bachelor’s or<br />
higher degree had about 38 percent higher odds<br />
of complet<strong>in</strong>g a degree program than students<br />
whose parents’ educational atta<strong>in</strong>ment was high<br />
school completion or less education.<br />
• Highest high school math completed: The odds<br />
of complet<strong>in</strong>g a degree program for students who<br />
reported tak<strong>in</strong>g algebra II/trigonometry were<br />
40 percent higher <strong>and</strong> the odds for those who<br />
reported tak<strong>in</strong>g precalculus/calculus were 93<br />
percent higher than the odds for those who had<br />
not taken any of those courses.<br />
• Earned college-level credits <strong>in</strong> high school:<br />
Students who earned college credits <strong>in</strong> high<br />
school had 39 percent higher odds of complet<strong>in</strong>g<br />
a degree program than those who had not<br />
received any college credits.<br />
• SAT or ACT test tak<strong>in</strong>g: Students who took the<br />
SAT or ACT exams had 52 percent higher odds<br />
of complet<strong>in</strong>g a degree program than those who<br />
had not taken either exam.<br />
• First <strong>in</strong>stitution control: Students who started<br />
their postsecondary education at private for-profit<br />
<strong>in</strong>stitutions had 59 percent lower odds of<br />
complet<strong>in</strong>g a degree program than those who<br />
started <strong>in</strong> public <strong>in</strong>stitutions.<br />
• Attend<strong>in</strong>g a 4-year <strong>in</strong>stitution at entry:<br />
Students who began their postsecondary<br />
education at a 4-year <strong>in</strong>stitution had 63 percent<br />
higher odds of complet<strong>in</strong>g a degree program<br />
than those who started at a less-than-4-year<br />
<strong>in</strong>stitution.<br />
260 <strong>Higher</strong> <strong>Education</strong>: <strong>Gaps</strong> <strong>in</strong> <strong>Access</strong> <strong>and</strong> <strong>Persistence</strong> <strong>Study</strong>
• Advisor <strong>in</strong>teraction: Students who met with<br />
their college advisor <strong>in</strong> their first year at their<br />
<strong>in</strong>stitutions had 30 percent higher odds of<br />
complet<strong>in</strong>g a degree program than those who did<br />
not.<br />
• School clubs: Students participat<strong>in</strong>g <strong>in</strong> clubs <strong>in</strong><br />
their first year at their <strong>in</strong>stitutions had 39 percent<br />
higher odds of complet<strong>in</strong>g a degree program than<br />
those who did not.<br />
• Work hours: The odds of complet<strong>in</strong>g a degree<br />
program for students who worked more than 20<br />
hours a week, <strong>in</strong>clud<strong>in</strong>g work study programs,<br />
were 19 percent lower than the odds of<br />
complet<strong>in</strong>g a degree program for those who did<br />
not work.<br />
• Full-time enrollment: The odds of complet<strong>in</strong>g<br />
a degree program for students who were always<br />
enrolled full time <strong>in</strong> their postsecondary program<br />
were over twice the odds for those who attended<br />
part time for some or all semesters.<br />
• Stopouts: Each stopout dur<strong>in</strong>g a student’s<br />
postsecondary education was associated with a<br />
60 percent decrease <strong>in</strong> the odds of the student<br />
complet<strong>in</strong>g a degree program.<br />
Males <strong>and</strong> Females: Exam<strong>in</strong><strong>in</strong>g these factors<br />
separately for males <strong>and</strong> females (controll<strong>in</strong>g for race/<br />
ethnicity <strong>and</strong> other variables), higher <strong>in</strong>come quartiles<br />
were related to a higher likelihood of degree atta<strong>in</strong>ment<br />
among both groups (table BPS-2). Other f<strong>in</strong>d<strong>in</strong>gs <strong>in</strong>clude<br />
the follow<strong>in</strong>g:<br />
• Parents’ educational atta<strong>in</strong>ment: Females<br />
whose parents had completed a bachelor’s or<br />
higher degree had 57 percent higher odds of<br />
complet<strong>in</strong>g a degree program than those whose<br />
parents’ educational atta<strong>in</strong>ment was high school<br />
completion or less education.<br />
• Highest high school math completed: Males<br />
whose highest math course <strong>in</strong> high school was<br />
algebra II/trigonometry had 67 percent higher<br />
odds of complet<strong>in</strong>g a degree program than males<br />
whose highest math course was less than algebra<br />
II/trigonometry. The odds of complet<strong>in</strong>g a degree<br />
program for males whose highest math course <strong>in</strong><br />
high school was precalculus/calculus were over<br />
twice the odds of males whose highest math<br />
course was less than those courses. Females who<br />
reported that their highest math course <strong>in</strong> high<br />
school was precalculus/calculus had 75 percent<br />
higher odds of complet<strong>in</strong>g a degree program than<br />
females whose highest math course was less than<br />
those courses.<br />
• Earned college-level credits <strong>in</strong> high school:<br />
Males who earned college credits <strong>in</strong> high school<br />
had 36 percent higher odds of complet<strong>in</strong>g a<br />
degree program than those who had not received<br />
any college credits. Females who earned college<br />
credits <strong>in</strong> high school had 42 percent higher odds<br />
of complet<strong>in</strong>g a degree program than those who<br />
had not received any college credits.<br />
• SAT or ACT test tak<strong>in</strong>g: Males who took the<br />
SAT or ACT exams had 57 percent higher odds<br />
of complet<strong>in</strong>g a degree program than those who<br />
had not taken either exam.<br />
• First <strong>in</strong>stitution control: Females who started<br />
their postsecondary education at private for-profit<br />
<strong>in</strong>stitutions had 74 percent lower odds of<br />
complet<strong>in</strong>g a degree program than those who<br />
started <strong>in</strong> public <strong>in</strong>stitutions.<br />
• Attend<strong>in</strong>g a 4-year <strong>in</strong>stitution at entry: Males<br />
who began their postsecondary education at a<br />
4-year <strong>in</strong>stitution had 72 percent higher odds<br />
of complet<strong>in</strong>g a degree program than those who<br />
started at a less-than-4-year <strong>in</strong>stitution. Females<br />
who began their postsecondary education at a<br />
4-year <strong>in</strong>stitution had 49 percent higher odds<br />
of complet<strong>in</strong>g a degree program than those who<br />
started at a less-than-4-year <strong>in</strong>stitution.<br />
• Declar<strong>in</strong>g a major at college entry: Males who<br />
declared a major at college entry had 25 percent<br />
higher odds of complet<strong>in</strong>g a degree program than<br />
those who did not declare a major.<br />
• Advisor <strong>in</strong>teraction: Females who met with<br />
their college advisor <strong>in</strong> their first year at their<br />
<strong>in</strong>stitutions had 62 percent higher odds of<br />
complet<strong>in</strong>g a degree program than those who did<br />
not.<br />
• School clubs: Males participat<strong>in</strong>g <strong>in</strong> clubs <strong>in</strong><br />
their first year at their <strong>in</strong>stitutions had 40 percent<br />
higher odds of complet<strong>in</strong>g a degree program<br />
than those who did not. Females participat<strong>in</strong>g <strong>in</strong><br />
clubs <strong>in</strong> their first year at their <strong>in</strong>stitutions had<br />
35 percent higher odds of complet<strong>in</strong>g a degree<br />
program than those who did not.<br />
• Work hours: The odds of complet<strong>in</strong>g a degree<br />
program for males who worked more than 20<br />
hours a week, <strong>in</strong>clud<strong>in</strong>g work study programs,<br />
were 30 percent lower than the odds of<br />
complet<strong>in</strong>g a degree program for those who did<br />
not work.<br />
Multivariate Analyses<br />
8<br />
Multivariate Analyses of Immediate Postsecondary Enrollment <strong>and</strong> Degree Atta<strong>in</strong>ment 261
• Full-time enrollment: The odds of complet<strong>in</strong>g<br />
a degree program for males who were always<br />
enrolled full time <strong>in</strong> their postsecondary program<br />
were 2.3 times the odds for males who attended<br />
part time for some or all semesters. Females<br />
who were always enrolled full time <strong>in</strong> their<br />
postsecondary program had 92 percent higher<br />
odds of complet<strong>in</strong>g a degree program than those<br />
who attended part time for some or all semesters.<br />
• Stopouts: Each stopout <strong>in</strong> a male student’s<br />
postsecondary education was associated with a<br />
57 percent decrease <strong>in</strong> the odds of the student<br />
complet<strong>in</strong>g a degree program. Each stopout <strong>in</strong><br />
a female student’s postsecondary education was<br />
associated with a 62 percent decrease <strong>in</strong> the odds<br />
of the student complet<strong>in</strong>g a degree program.<br />
Whites: Exam<strong>in</strong><strong>in</strong>g these factors separately for Whites,<br />
hav<strong>in</strong>g a higher <strong>in</strong>come quartile was related to a higher<br />
likelihood of degree atta<strong>in</strong>ment (table BPS-2). Other<br />
f<strong>in</strong>d<strong>in</strong>gs <strong>in</strong>clude the follow<strong>in</strong>g:<br />
• Sex: White males had 28 percent lower odds<br />
of complet<strong>in</strong>g a degree program than White<br />
females.<br />
• Parents’ educational atta<strong>in</strong>ment: White<br />
students whose parents had completed a<br />
bachelor’s or higher degree had 46 percent higher<br />
odds of complet<strong>in</strong>g a degree program than<br />
students whose parents’ educational atta<strong>in</strong>ment<br />
was high school completion or less education.<br />
• Highest high school math completed: White<br />
students whose highest high school math was<br />
algebra II/trigonometry had 34 percent higher<br />
odds of complet<strong>in</strong>g a degree program than<br />
those whose highest high school math course<br />
was less than algebra II/trigonometry. White<br />
students whose highest high school math was<br />
precalculus/calculus had 92 percent higher odds<br />
of complet<strong>in</strong>g a degree program than those<br />
whose highest high school math was less than<br />
precalculus or calculus.<br />
• Earned college-level credits <strong>in</strong> high school:<br />
White students who earned college credits <strong>in</strong> high<br />
school had 43 percent higher odds of complet<strong>in</strong>g<br />
a degree program than those who had not<br />
received any college credits.<br />
• SAT or ACT test tak<strong>in</strong>g: White students who<br />
took the SAT or ACT exams had 54 percent<br />
higher odds of complet<strong>in</strong>g a degree program than<br />
those who had not taken either exam.<br />
• First <strong>in</strong>stitution control: White students who<br />
started their postsecondary education at private<br />
for-profit <strong>in</strong>stitutions had 59 percent lower odds<br />
of complet<strong>in</strong>g a degree program than those who<br />
started <strong>in</strong> public <strong>in</strong>stitutions.<br />
• Attend<strong>in</strong>g a 4-year <strong>in</strong>stitution at entry:<br />
White students who began their postsecondary<br />
education at a 4-year <strong>in</strong>stitution had 63 percent<br />
higher odds of complet<strong>in</strong>g a degree program<br />
than those who started at a less-than-4-year<br />
<strong>in</strong>stitution.<br />
• Advisor <strong>in</strong>teraction: White students who met<br />
with their college advisor <strong>in</strong> their first year at<br />
their <strong>in</strong>stitutions had 34 percent higher odds of<br />
complet<strong>in</strong>g a degree program than those who did<br />
not.<br />
• School clubs: White students participat<strong>in</strong>g <strong>in</strong><br />
clubs <strong>in</strong> their first year at their <strong>in</strong>stitutions had<br />
34 percent higher odds of complet<strong>in</strong>g a degree<br />
program than those who did not.<br />
• Work hours: White students who worked<br />
more than 20 hours a week, <strong>in</strong>clud<strong>in</strong>g work<br />
study programs, had 22 percent lower odds of<br />
complet<strong>in</strong>g a degree program than those who did<br />
not work.<br />
• Full-time enrollment: The odds of complet<strong>in</strong>g<br />
a degree program for White students who were<br />
always enrolled full time <strong>in</strong> their postsecondary<br />
program were more than twice the odds for those<br />
who attended part time for some or all semesters.<br />
• Stopouts: Each stopout <strong>in</strong> a White student’s<br />
postsecondary education was associated with a<br />
59 percent decrease <strong>in</strong> the odds of the student<br />
complet<strong>in</strong>g a degree program.<br />
White Males <strong>and</strong> Females: Exam<strong>in</strong><strong>in</strong>g these factors<br />
separately for White males <strong>and</strong> White females, higher<br />
<strong>in</strong>come quartiles were related to a higher likelihood of<br />
degree atta<strong>in</strong>ment for both groups (table BPS-3). Other<br />
f<strong>in</strong>d<strong>in</strong>gs <strong>in</strong>clude the follow<strong>in</strong>g:<br />
• Parents’ educational atta<strong>in</strong>ment: White females<br />
whose parents had completed a bachelor’s or<br />
higher degree had 63 percent higher odds of<br />
complet<strong>in</strong>g a degree program than those whose<br />
parents’ educational atta<strong>in</strong>ment was high school<br />
completion or less education.<br />
• Highest high school math completed: White<br />
males whose highest math course <strong>in</strong> high school<br />
was algebra II/trigonometry had 65 percent<br />
higher odds of complet<strong>in</strong>g a degree program<br />
than White males whose highest math course<br />
was less than algebra II/trigonometry. The odds<br />
of complet<strong>in</strong>g a degree program for White<br />
males whose highest math <strong>in</strong> high school was<br />
precalculus/calculus were over twice the odds<br />
for White males whose highest math course was<br />
262 <strong>Higher</strong> <strong>Education</strong>: <strong>Gaps</strong> <strong>in</strong> <strong>Access</strong> <strong>and</strong> <strong>Persistence</strong> <strong>Study</strong>
less than algebra II/trigonometry. White females<br />
whose highest math course was precalculus/<br />
calculus had 82 percent higher odds of<br />
complet<strong>in</strong>g a degree program than those whose<br />
highest math course was less than algebra II/<br />
trigonometry.<br />
Blacks: F<strong>in</strong>d<strong>in</strong>gs result<strong>in</strong>g from the exam<strong>in</strong>ation of these<br />
factors separately for Blacks <strong>in</strong>clude the follow<strong>in</strong>g (table<br />
BPS-2):<br />
• Sex: Black males had 35 percent lower odds of<br />
complet<strong>in</strong>g a degree program than Black females.<br />
• Earned college-level credits <strong>in</strong> high school:<br />
White males who earned college credits <strong>in</strong> high<br />
school had 62 percent higher odds of complet<strong>in</strong>g<br />
a degree program than those who had not<br />
received any college credits. White females<br />
who earned college credits <strong>in</strong> high school had<br />
28 percent higher odds of complet<strong>in</strong>g a degree<br />
program than those who had not received any<br />
college credits.<br />
• First <strong>in</strong>stitution control: White females who<br />
started their postsecondary education at private<br />
for-profit <strong>in</strong>stitutions had 74 percent lower odds<br />
of complet<strong>in</strong>g a degree program than those who<br />
started <strong>in</strong> public <strong>in</strong>stitutions.<br />
• Attend<strong>in</strong>g a 4-year <strong>in</strong>stitution at entry: White<br />
males who began their postsecondary education<br />
at a 4-year <strong>in</strong>stitution had 63 percent higher odds<br />
of complet<strong>in</strong>g a degree program than those who<br />
started at a less-than-4-year <strong>in</strong>stitution. White<br />
females who began their postsecondary education<br />
at a 4-year <strong>in</strong>stitution had 60 percent higher odds<br />
of complet<strong>in</strong>g a degree program than those who<br />
started at a less-than-4-year <strong>in</strong>stitution.<br />
• Advisor <strong>in</strong>teraction: White females who met<br />
with their college advisor <strong>in</strong> their first year at<br />
their <strong>in</strong>stitutions had 67 percent higher odds of<br />
complet<strong>in</strong>g a degree program than those who did<br />
not.<br />
• Full-time enrollment: The odds of complet<strong>in</strong>g<br />
a degree program for White males who were<br />
always enrolled full time <strong>in</strong> their postsecondary<br />
program were 2.6 times the odds for those who<br />
attended part time for some or all semesters.<br />
White females who were always enrolled full<br />
time <strong>in</strong> their postsecondary program had 92<br />
percent higher odds of complet<strong>in</strong>g a degree<br />
program than those who attended part time for<br />
some or all semesters.<br />
• Stopouts: Each stopout <strong>in</strong> a White male<br />
student’s postsecondary education was associated<br />
with a 54 percent decrease <strong>in</strong> the odds of<br />
the student complet<strong>in</strong>g a degree program.<br />
Each stopout <strong>in</strong> a White female student’s<br />
postsecondary education was associated with a<br />
63 percent decrease <strong>in</strong> the odds of the student<br />
complet<strong>in</strong>g a degree program.<br />
• Parents’ educational atta<strong>in</strong>ment: Black students<br />
whose parents had completed a bachelor’s or<br />
higher degree had 60 percent higher odds of<br />
complet<strong>in</strong>g a degree program than students<br />
whose parents’ educational atta<strong>in</strong>ment was high<br />
school completion or less education.<br />
• Attend<strong>in</strong>g a 4-year <strong>in</strong>stitution at entry:<br />
Black students who began their postsecondary<br />
education at a 4-year <strong>in</strong>stitution had 90 percent<br />
higher odds of complet<strong>in</strong>g a degree program<br />
than those who started at a less-than-4-year<br />
<strong>in</strong>stitution.<br />
• Declar<strong>in</strong>g a major at college entry: Black<br />
students who declared a major at college entry<br />
had 70 percent higher odds of complet<strong>in</strong>g a<br />
degree program than those who did not declare a<br />
major.<br />
• School clubs: Black students participat<strong>in</strong>g <strong>in</strong><br />
clubs <strong>in</strong> their first year at their <strong>in</strong>stitutions had<br />
67 percent higher odds of complet<strong>in</strong>g a degree<br />
program than those who did not.<br />
• Stopouts: Each stopout <strong>in</strong> a Black student’s<br />
postsecondary education was associated with a<br />
63 percent decrease <strong>in</strong> the odds of the student<br />
complet<strong>in</strong>g a degree program.<br />
Black Males <strong>and</strong> Females: F<strong>in</strong>d<strong>in</strong>gs result<strong>in</strong>g from<br />
the exam<strong>in</strong>ation of these factors separately for Black males<br />
<strong>and</strong> Black females <strong>in</strong>clude the follow<strong>in</strong>g (table BPS-3):<br />
• Income quartile <strong>in</strong> 2003–04: The odds of<br />
complet<strong>in</strong>g a degree program for Black males who<br />
were <strong>in</strong> the highest <strong>in</strong>come quartile were almost<br />
4 times the odds for those <strong>in</strong> the lowest <strong>in</strong>come<br />
quartile.<br />
• Full-time enrollment: The odds of complet<strong>in</strong>g a<br />
degree program for Black males who were always<br />
enrolled full time <strong>in</strong> their postsecondary program<br />
were 2.3 times the odds for those who attended<br />
part time for some or all semesters.<br />
• Parents’ educational atta<strong>in</strong>ment: The odds of<br />
complet<strong>in</strong>g a degree program for Black females<br />
whose parents had completed a bachelor’s or<br />
higher degree were 2.2 times the odds for those<br />
whose parents’ educational atta<strong>in</strong>ment was high<br />
school completion or less education.<br />
Multivariate Analyses<br />
8<br />
Multivariate Analyses of Immediate Postsecondary Enrollment <strong>and</strong> Degree Atta<strong>in</strong>ment 263
• School clubs: Black females participat<strong>in</strong>g <strong>in</strong><br />
clubs <strong>in</strong> their first year at their <strong>in</strong>stitutions had<br />
65 percent higher odds of complet<strong>in</strong>g a degree<br />
program than those who did not.<br />
• Stopouts: Each stopout <strong>in</strong> a Black female<br />
student’s postsecondary education was associated<br />
with a 68 percent decrease <strong>in</strong> the odds of the<br />
student complet<strong>in</strong>g a degree program.<br />
Hispanics: Exam<strong>in</strong><strong>in</strong>g these factors separately for<br />
Hispanics, the highest <strong>in</strong>come quartile was related to<br />
a higher likelihood of degree atta<strong>in</strong>ment (table BPS-2).<br />
Other f<strong>in</strong>d<strong>in</strong>gs <strong>in</strong>clude the follow<strong>in</strong>g:<br />
• First <strong>in</strong>stitution control: Hispanic students who<br />
started their postsecondary education at private<br />
for-profit <strong>in</strong>stitutions had 62 percent lower odds<br />
of complet<strong>in</strong>g a degree program than those who<br />
started <strong>in</strong> public <strong>in</strong>stitutions.<br />
• Attend<strong>in</strong>g a 4-year <strong>in</strong>stitution at entry:<br />
Hispanic students who began their postsecondary<br />
education at a 4-year <strong>in</strong>stitution had 77 percent<br />
higher odds of complet<strong>in</strong>g a degree program<br />
than those who started at a less-than-4-year<br />
<strong>in</strong>stitution.<br />
• Full-time enrollment: Hispanic students<br />
who were always enrolled full time <strong>in</strong> their<br />
postsecondary program had 93 percent higher<br />
odds of complet<strong>in</strong>g a degree program than those<br />
who attended part time for some or all semesters.<br />
Hispanic Males <strong>and</strong> Females: F<strong>in</strong>d<strong>in</strong>gs result<strong>in</strong>g<br />
from the exam<strong>in</strong>ation of these factors separately for<br />
Hispanic males <strong>and</strong> Hispanic females <strong>in</strong>clude the<br />
follow<strong>in</strong>g (table BPS-3):<br />
• Attend<strong>in</strong>g a 4-year <strong>in</strong>stitution at entry:<br />
The odds of complet<strong>in</strong>g a degree program for<br />
Hispanic males who began their postsecondary<br />
education at a 4-year <strong>in</strong>stitution were 2.6 times<br />
the odds for those who started at a less-than-4-<br />
year <strong>in</strong>stitution.<br />
• First <strong>in</strong>stitution control: Hispanic females who<br />
started their postsecondary education at private<br />
for-profit <strong>in</strong>stitutions had 73 percent lower odds<br />
of complet<strong>in</strong>g a degree program than those who<br />
started <strong>in</strong> public <strong>in</strong>stitutions.<br />
• Full-time enrollment: The odds of complet<strong>in</strong>g<br />
a degree program for Hispanic females who were<br />
always enrolled full time <strong>in</strong> their postsecondary<br />
program were 2.6 times the odds for those who<br />
attended part time for some or all semesters.<br />
• Stopouts: Each stopout <strong>in</strong> a Hispanic male<br />
student’s postsecondary education was associated<br />
with a 59 percent decrease <strong>in</strong> the odds of<br />
the student complet<strong>in</strong>g a degree program.<br />
Each stopout <strong>in</strong> a Hispanic female student’s<br />
postsecondary education was associated with a<br />
53 percent decrease <strong>in</strong> the odds of the student<br />
complet<strong>in</strong>g a degree program.<br />
• Stopouts: Each stopout <strong>in</strong> a Hispanic student’s<br />
postsecondary education was associated with a<br />
55 percent decrease <strong>in</strong> the odds of the student<br />
complet<strong>in</strong>g a degree program.<br />
264 <strong>Higher</strong> <strong>Education</strong>: <strong>Gaps</strong> <strong>in</strong> <strong>Access</strong> <strong>and</strong> <strong>Persistence</strong> <strong>Study</strong>
Conclusion<br />
This chapter used logistic regression analyses to explore<br />
relationships among student, family, <strong>and</strong> school/<br />
<strong>in</strong>stitutional characteristics <strong>and</strong> two outcomes for recent<br />
high school graduates: the likelihood of immediate<br />
postsecondary enrollment <strong>and</strong> the likelihood of atta<strong>in</strong><strong>in</strong>g<br />
an associate’s or bachelor’s degree with<strong>in</strong> 6 years of<br />
beg<strong>in</strong>n<strong>in</strong>g postsecondary education, with a focus on Black<br />
<strong>and</strong> Hispanic males. For males overall, the likelihood of<br />
immediate postsecondary enrollment was higher for males<br />
with higher socioeconomic status, a higher 9th-grade<br />
GPA, <strong>and</strong> higher 10th-grade mathematics achievement<br />
scores, as well as higher for those who participated <strong>in</strong><br />
multiple high school sports <strong>and</strong> extracurricular activities<br />
<strong>and</strong> those who often discussed school courses with their<br />
parents (table ELS-2). In contrast, the likelihood of<br />
immediate postsecondary enrollment was lower for males<br />
who worked more than 20 hours per week while enrolled<br />
<strong>in</strong> high school. In subgroup analyses of White, Black,<br />
<strong>and</strong> Hispanic males, higher 10th-grade mathematics<br />
achievement scores were associated with a greater<br />
likelihood of immediate postsecondary enrollment for all<br />
three groups, higher socioeconomic status was associated<br />
with a greater likelihood of immediate enrollment for<br />
White <strong>and</strong> Black males, <strong>and</strong> a higher 9th-grade GPA<br />
was associated with a greater likelihood of immediate<br />
enrollment for White <strong>and</strong> Hispanic males (table ELS-3).<br />
Factors associated with a higher likelihood of immediate<br />
postsecondary enrollment for females overall <strong>in</strong>cluded<br />
higher socioeconomic status, a higher 9th-grade GPA,<br />
<strong>and</strong> higher 10th-grade mathematics achievement scores,<br />
as well as higher for those who participated <strong>in</strong> multiple<br />
high school sports <strong>and</strong> extracurricular activities <strong>and</strong> those<br />
who often discussed school courses with their parents<br />
(table ELS-2). In contrast, the likelihood of immediate<br />
postsecondary enrollment was lower for females who<br />
missed 7 or more days of school dur<strong>in</strong>g the first term of<br />
the year <strong>and</strong> for those who worked more than 20 hours<br />
per week while enrolled <strong>in</strong> high school. In subgroup<br />
analyses of White, Black, <strong>and</strong> Hispanic females, higher<br />
9th-grade GPA was associated with a greater likelihood of<br />
immediate postsecondary enrollment for all three groups,<br />
higher 10th-grade mathematics achievement scores<br />
were associated with a greater likelihood of immediate<br />
enrollment for White <strong>and</strong> Hispanic females, <strong>and</strong> higher<br />
socioeconomic status was associated with a greater<br />
likelihood of immediate enrollment for White females<br />
(table ELS-3).<br />
Factors associated with a higher likelihood of associate’s<br />
or bachelor’s degree atta<strong>in</strong>ment by June 2009 for males<br />
overall <strong>in</strong>cluded higher socioeconomic status, completion<br />
of algebra II/trigonometry or precalculus/calculus courses<br />
<strong>in</strong> high school, earn<strong>in</strong>g college-level credits <strong>in</strong> high school,<br />
tak<strong>in</strong>g the SAT or ACT exam, beg<strong>in</strong>n<strong>in</strong>g <strong>in</strong> a 4-year<br />
postsecondary <strong>in</strong>stitution, declar<strong>in</strong>g a major <strong>in</strong> the first<br />
year, participat<strong>in</strong>g <strong>in</strong> school clubs <strong>in</strong> the first year at their<br />
<strong>in</strong>stitutions, <strong>and</strong> always be<strong>in</strong>g enrolled full time (table<br />
BPS-2). In contrast, the likelihood for degree atta<strong>in</strong>ment<br />
with<strong>in</strong> 6 years was lower for males who worked 20 or<br />
more hours per week <strong>and</strong> those who stopped out of their<br />
postsecondary programs at least one time. Many of the<br />
relationships between these factors <strong>and</strong> degree atta<strong>in</strong>ment<br />
for males overall were also observed for White males (table<br />
BPS-3). In subgroup analysis of Black males, those from<br />
the highest <strong>in</strong>come quartile <strong>and</strong> those who were always<br />
enrolled full time at their <strong>in</strong>stitutions were more likely<br />
than other Black males to atta<strong>in</strong> a degree with<strong>in</strong> 6 years<br />
of entry. For Hispanic males, those who first attended a<br />
4-year postsecondary <strong>in</strong>stitution were more likely to have<br />
atta<strong>in</strong>ed a degree with<strong>in</strong> 6 years than those who started <strong>in</strong><br />
less-than-4-year <strong>in</strong>stitutions.<br />
Factors associated with a higher likelihood of associate’s<br />
or bachelor’s degree atta<strong>in</strong>ment by June 2009 for females<br />
overall <strong>in</strong>cluded higher socioeconomic status, hav<strong>in</strong>g<br />
a parent who completed a bachelor’s or higher degree,<br />
completion of precalculus/calculus courses <strong>in</strong> high school,<br />
earn<strong>in</strong>g college-level credits <strong>in</strong> high school, beg<strong>in</strong>n<strong>in</strong>g <strong>in</strong><br />
a 4-year postsecondary <strong>in</strong>stitution, meet<strong>in</strong>g with their<br />
college advisor <strong>in</strong> their first year, participat<strong>in</strong>g <strong>in</strong> school<br />
clubs <strong>in</strong> the first year at their <strong>in</strong>stitutions, <strong>and</strong> always<br />
be<strong>in</strong>g enrolled full time (table BPS-2). In contrast, the<br />
likelihood for degree atta<strong>in</strong>ment with<strong>in</strong> 6 years was lower<br />
for females who started their postsecondary education<br />
at private for-profit <strong>in</strong>stitutions <strong>and</strong> those who stopped<br />
out of their postsecondary programs at least one time.<br />
Many of the relationships between these factors <strong>and</strong><br />
degree atta<strong>in</strong>ment for females overall were also observed<br />
for White females (table BPS-3). In subgroup analysis of<br />
Black females, those who had a parent who completed a<br />
bachelor’s degree or higher <strong>and</strong> those who participated<br />
<strong>in</strong> clubs <strong>in</strong> their first year were more likely than other<br />
Black females to atta<strong>in</strong> a degree with<strong>in</strong> 6 years of entry.<br />
For Hispanic females, those who were always enrolled<br />
full time <strong>in</strong> their postsecondary programs were more<br />
likely to have atta<strong>in</strong>ed a degree with<strong>in</strong> 6 years than<br />
Hispanic females who did not always attend full time. The<br />
likelihood for degree atta<strong>in</strong>ment with<strong>in</strong> 6 years was lower<br />
for Hispanic females who started their postsecondary<br />
education at private for-profit <strong>in</strong>stitutions <strong>and</strong> those who<br />
stopped out of their postsecondary programs at least one<br />
time.<br />
In addition, some student, family, <strong>and</strong> school/<strong>in</strong>stitutional<br />
factors were related to a higher likelihood of both<br />
outcomes—immediate postsecondary enrollment<br />
<strong>and</strong> degree atta<strong>in</strong>ment with<strong>in</strong> 6 years of beg<strong>in</strong>n<strong>in</strong>g<br />
postsecondary education—for students overall (tables<br />
ELS-2 <strong>and</strong> BPS-2). These factors <strong>in</strong>cluded be<strong>in</strong>g female,<br />
hav<strong>in</strong>g a higher socioeconomic status, participation <strong>in</strong><br />
extracurricular activities or school clubs, <strong>and</strong> not work<strong>in</strong>g<br />
more than 20 hours per week.<br />
Multivariate Analyses<br />
8<br />
Multivariate Analyses of Immediate Postsecondary Enrollment <strong>and</strong> Degree Atta<strong>in</strong>ment 265
Table BPS-1. Percentage distribution of 2003–04 beg<strong>in</strong>n<strong>in</strong>g postsecondary students who were recent high school<br />
graduates, by June 2009 degree atta<strong>in</strong>ment status <strong>and</strong> other selected characteristics<br />
Characteristic<br />
Total<br />
Associate’s or bachelor’s degree<br />
atta<strong>in</strong>ment status <strong>in</strong> June 2009<br />
Degree<br />
No degree<br />
Total 100.0 (†) 100.0 (†) 100.0 (†)<br />
Associate’s or bachelor’s degree atta<strong>in</strong>ment status <strong>in</strong> June 2009<br />
Sex<br />
Degree 53.2 (0.81) 100.0 (†) 0.0 (†)<br />
No degree 46.8 (0.81) 0.0 (†) 100.0 (†)<br />
Male 44.6 (0.79) 41.5 (0.96) 48.2 (1.14)<br />
Female 55.4 (0.79) 58.5 (0.96) 51.8 (1.14)<br />
Race/ethnicity<br />
White 65.8 (1.09) 73.4 (1.00) 57.2 (1.56)<br />
Black 10.6 (0.83) 7.0 (0.68) 14.8 (1.17)<br />
Hispanic 13.3 (0.66) 9.1 (0.56) 18.1 (1.12)<br />
Asian 5.1 (0.34) 5.9 (0.37) 4.2 (0.56)<br />
Other 5.1 (0.32) 4.5 (0.35) 5.7 (0.50)<br />
Parent’s highest level of education<br />
High school diploma or less <strong>and</strong> vocationaltechnical<br />
tra<strong>in</strong><strong>in</strong>g 30.3 (0.66) 22.5 (0.83) 39.2 (1.13)<br />
Some college, less than bachelor’s degree 22.7 (0.68) 20.1 (0.77) 25.6 (1.08)<br />
Bachelor’s or higher degree 47.0 (0.75) 57.4 (0.91) 35.2 (0.94)<br />
Income quartile <strong>in</strong> 2004<br />
Low 26.4 (0.58) 18.3 (0.58) 35.7 (1.02)<br />
Low middle 25.6 (0.67) 24.2 (0.73) 27.2 (1.13)<br />
High middle 24.7 (0.59) 26.9 (0.70) 22.1 (0.98)<br />
High 23.3 (0.58) 30.6 (0.79) 15.0 (0.73)<br />
Highest level of high school mathematics<br />
None of these courses 12.4 (0.46) 6.3 (0.47) 19.3 (0.87)<br />
Algebra II/trigonometry 45.7 (0.78) 39.2 (0.91) 53.0 (1.22)<br />
Precalculus/calculus 41.9 (0.74) 54.4 (0.93) 27.7 (1.00)<br />
Earned any college-level credits <strong>in</strong> high school<br />
No 65.6 (0.90) 56.8 (1.04) 75.6 (1.10)<br />
Yes 34.4 (0.90) 43.2 (1.04) 24.4 (1.10)<br />
Took the SAT or ACT exams<br />
No 13.7 (0.69) 5.6 (0.52) 22.9 (1.19)<br />
Yes 86.3 (0.69) 94.4 (0.52) 77.1 (1.19)<br />
First <strong>in</strong>stitution control 2003–04<br />
Public 72.4 (0.59) 70.0 (0.73) 75.2 (1.05)<br />
Private nonprofit 19.9 (0.39) 27.2 (0.61) 11.7 (0.62)<br />
Private for-profit 7.6 (0.53) 2.8 (0.45) 13.1 (0.93)<br />
First <strong>in</strong>stitution level 2003–04<br />
Less-than-4-year 41.0 (0.81) 24.1 (1.04) 60.1 (1.26)<br />
4-year 59.0 (0.81) 75.9 (1.04) 39.9 (1.26)<br />
Declared a major dur<strong>in</strong>g first year<br />
No 31.3 (0.85) 29.7 (0.91) 33.2 (1.32)<br />
Yes 68.7 (0.85) 70.3 (0.91) 66.8 (1.32)<br />
Took any remedial classes <strong>in</strong> 2004<br />
No 76.7 (0.66) 80.0 (0.72) 73.0 (1.02)<br />
Yes 23.3 (0.66) 20.0 (0.72) 27.0 (1.02)<br />
See notes at end of table.<br />
266 <strong>Higher</strong> <strong>Education</strong>: <strong>Gaps</strong> <strong>in</strong> <strong>Access</strong> <strong>and</strong> <strong>Persistence</strong> <strong>Study</strong>
Table BPS-1. Percentage distribution of 2003–04 beg<strong>in</strong>n<strong>in</strong>g postsecondary students who were recent high school<br />
graduates, by June 2009 degree atta<strong>in</strong>ment status <strong>and</strong> other selected characteristics—Cont<strong>in</strong>ued<br />
Characteristic<br />
Total<br />
Associate’s or bachelor’s degree<br />
atta<strong>in</strong>ment status <strong>in</strong> June 2009<br />
Degree<br />
No degree<br />
Total 100.0 (†) 100.0 (†) 100.0 (†)<br />
Met with college advisor <strong>in</strong> 2004<br />
Never 1 27.3 (0.70) 18.2 (0.67) 37.6 (1.13)<br />
Sometimes or often 72.7 (0.70) 81.8 (0.67) 62.4 (1.13)<br />
Participated <strong>in</strong> school clubs <strong>in</strong> 2004<br />
Never 1 65.5 (0.65) 54.1 (0.81) 78.4 (0.88)<br />
Sometimes or often 34.5 (0.65) 45.9 (0.81) 21.6 (0.88)<br />
Participated <strong>in</strong> school sports <strong>in</strong> 2004<br />
Never 1 72.0 (0.72) 64.2 (0.92) 80.9 (0.99)<br />
Sometimes or often 28.0 (0.72) 35.8 (0.92) 19.1 (0.99)<br />
Hours worked, <strong>in</strong>clud<strong>in</strong>g work-study<br />
Not work<strong>in</strong>g 33.5 (0.68) 37.8 (0.84) 28.7 (0.97)<br />
Up to 20 hours a week 34.9 (0.64) 39.6 (0.83) 29.5 (0.89)<br />
More than 20 hours a week 31.6 (0.79) 22.6 (0.88) 41.8 (1.17)<br />
Attendance <strong>in</strong>tensity pattern through 2009<br />
Always full-time 57.2 (0.75) 70.6 (0.78) 42.0 (1.23)<br />
Part-time for some/all semesters 42.8 (0.75) 29.4 (0.78) 58.0 (1.23)<br />
Number of stopouts 2 through 2009<br />
Zero 63.0 (0.78) 79.5 (0.72) 44.3 (1.12)<br />
One 27.3 (0.74) 17.7 (0.70) 38.3 (1.17)<br />
Two or more 9.6 (0.52) 2.8 (0.25) 17.3 (1.01)<br />
Number of transfers through 2009<br />
Zero 64.8 (0.82) 71.0 (0.88) 57.8 (1.23)<br />
One 28.2 (0.76) 23.8 (0.79) 33.1 (1.16)<br />
Two or more 7.0 (0.34) 5.2 (0.43) 9.1 (0.63)<br />
† Not applicable.<br />
1<br />
Students who started their postsecondary education at less-than-2-year <strong>in</strong>stitutions skipped this item on the questionnaire. In such <strong>in</strong>stances, student<br />
values were collapsed with the “Never” category for analysis purposes.<br />
2<br />
A “stopout” is def<strong>in</strong>ed as a temporary withdrawal of 5 or more consecutive months from enrollment at a postsecondary <strong>in</strong>stitution.<br />
NOTE: Estimates are based on the sample of students who graduated from high school <strong>in</strong> 2003 or 2004 <strong>and</strong> who had a valid WTB000 weight. A small<br />
number of students <strong>in</strong> the sample (fewer than 150) reported that they graduated from high school <strong>in</strong> 2004. Students who were enrolled <strong>in</strong> high school<br />
<strong>and</strong> at a postsecondary <strong>in</strong>stitution concurrently were not eligible to be sampled for the BPS; however, students who completed high school <strong>in</strong> 2004<br />
<strong>and</strong> then enrolled <strong>in</strong> a postsecondary course by June 2004 were eligible to be sampled. St<strong>and</strong>ard errors appear <strong>in</strong> parentheses. Detail may not sum to<br />
totals because of round<strong>in</strong>g.<br />
SOURCE: U.S. Department of <strong>Education</strong>, National Center for <strong>Education</strong> Statistics, 2003–04 Beg<strong>in</strong>n<strong>in</strong>g Postsecondary Students Longitud<strong>in</strong>al <strong>Study</strong>,<br />
Second Follow-up (BPS:04/09).<br />
Multivariate Analyses<br />
8<br />
Multivariate Analyses of Immediate Postsecondary Enrollment <strong>and</strong> Degree Atta<strong>in</strong>ment 267
268 <strong>Higher</strong> <strong>Education</strong>: <strong>Gaps</strong> <strong>in</strong> <strong>Access</strong> <strong>and</strong> <strong>Persistence</strong> <strong>Study</strong><br />
Table BPS-2. Summary of logistic regression analyses for variables predict<strong>in</strong>g that recent high school graduates who entered a postsecondary <strong>in</strong>stitution <strong>in</strong> academic year<br />
2003–04 would have completed an associate’s or bachelor’s degree as of spr<strong>in</strong>g 2009, overall <strong>and</strong> by race/ethnicity <strong>and</strong> sex: 2004–09<br />
Characteristic<br />
Sex<br />
Coeff<br />
Total<br />
(n = 11,410)<br />
SE<br />
Race/ethnicity subgroup models<br />
Sex subgroup models<br />
White (n = 7,806) Black (n = 1,205) Hispanic (n = 1,270) Male (n = 4,866) Female (n = 6,544)<br />
Odds<br />
ratio Coeff SE<br />
Odds<br />
ratio Coeff SE<br />
Odds<br />
ratio Coeff SE<br />
Odds<br />
ratio Coeff SE<br />
Odds<br />
ratio Coeff SE<br />
Intercept -1.59 (0.200) † -1.70 (0.240) † -1.97 (0.570) † -1.89 (0.510) † -1.89 (0.270) † -1.65 (0.270) †<br />
Female † (†) † † (†) † † (†) † † (†) † † (†) † † (†) †<br />
Male -0.38 (0.070 0.68 * -0.33 (0.080) 0.72 * -0.43 (0.210) 0.65 * -0.41 (0.220) 0.66 † (†) † † (†) †<br />
Race/ethnicity<br />
White † (†) † † (†) † † (†) † † (†) † † (†) † † (†) †<br />
Black -0.56 (0.110) 0.57 * † (†) † † (†) † † (†) † -0.68 (0.170) 0.51 * -0.42 (0.130) 0.66 *<br />
Hispanic -0.29 (0.130) 0.75 * † (†) † † (†) † † (†) † -0.45 (0.220) 0.64 * -0.14 (0.140) 0.87<br />
Asian 0.17 (0.160) 1.19 † (†) † † (†) † † (†) † -0.11 (0.220) 0.90 0.61 (0.240) 1.84 *<br />
Other -0.34 (0.140) 0.71 * † (†) † † (†) † † (†) † -0.13 (0.210) 0.88 -0.49 (0.190) 0.61 *<br />
Parent’s highest level of education<br />
High school diploma or less <strong>and</strong><br />
vocational-technical tra<strong>in</strong><strong>in</strong>g † (†) † † (†) † † (†) † † (†) † † (†) † † (†) †<br />
Some college, less than bachelor’s<br />
degree 0.13 (0.100) 1.14 0.24 (0.140) 1.27 0.08 (0.230) 1.08 -0.09 (0.300) 0.91 0.02 (0.170) 1.02 0.21 (0.120) 1.23<br />
Bachelor’s or higher degree 0.32 (0.090) 1.38 * 0.38 (0.120) 1.46 * 0.47 (0.240) 1.60 * -0.04 (0.270) 0.96 0.18 (0.140) 1.20 0.45 (0.120) 1.57 *<br />
Odds<br />
ratio<br />
Income quartile <strong>in</strong> 2004<br />
Low † (†) † † (†) † † (†) † † (†) † † (†) † † (†) †<br />
Low middle 0.38 (0.100) 1.46 * 0.38 (0.140) 1.46 * 0.19 (0.270) 1.21 0.49 (0.280) 1.63 0.35 (0.150) 1.42 * 0.40 (0.140) 1.49 *<br />
High middle 0.52 (0.100) 1.68 * 0.57 (0.130) 1.77 * 0.28 (0.340) 1.32 0.41 (0.380) 1.51 0.45 (0.150) 1.57 * 0.59 (0.150) 1.80 *<br />
High 0.73 (0.110) 2.08 * 0.70 (0.120) 2.01 * 0.69 (0.390) 1.99 0.91 (0.390) 2.48 * 0.64 (0.150) 1.90 * 0.83 (0.150) 2.29 *<br />
Highest level of high school mathematics<br />
None of these courses † (†) † † (†) † † (†) † † (†) † † (†) † † (†) †<br />
Algebra II/trigonometry 0.34 (0.120) 1.40 * 0.29 (0.140) 1.34 * 0.21 (0.340) 1.23 0.54 (0.320) 1.72 0.51 (0.190) 1.67 * 0.23 (0.160) 1.26<br />
Precalculus/calculus 0.66 (0.130) 1.93 * 0.65 (0.150) 1.92 * 0.55 (0.400) 1.73 0.67 (0.380) 1.95 0.81 (0.230) 2.25 * 0.56 (0.180) 1.75 *<br />
Earned any college-level credits <strong>in</strong> high<br />
school 0.33 (0.070) 1.39 * 0.36 (0.090) 1.43 * 0.11 (0.250) 1.12 0.41 (0.240) 1.51 0.31 (0.100) 1.36 * 0.35 (0.100) 1.42 *<br />
Took the SAT or ACT exams 0.42 (0.140) 1.52 * 0.43 (0.170) 1.54 * 0.23 (0.420) 1.26 0.43 (0.290) 1.54 0.45 (0.200) 1.57 * 0.40 (0.210) 1.49<br />
First <strong>in</strong>stitution control 2003–04<br />
Public † (†) † † (†) † † (†) † † (†) † † (†) † † (†) †<br />
Private nonprofit 0.08 (0.080) 1.08 0.14 (0.100) 1.15 0.13 (0.280) 1.14 -0.38 (0.360) 0.68 0.11 (0.120) 1.12 0.08 (0.120) 1.08<br />
Private for-profit -0.88 (0.190) 0.41 * -0.89 (0.250) 0.41 * -1.13 (0.660) 0.32 -0.96 (0.440) 0.38 * -0.41 (0.300) 0.66 -1.36 (0.320) 0.26 *<br />
See notes at end of table.
Table BPS-2. Summary of logistic regression analyses for variables predict<strong>in</strong>g that recent high school graduates who entered a postsecondary <strong>in</strong>stitution <strong>in</strong> academic<br />
year 2003–04 would have ompleted an associate’s or bachelor’s degree as of spr<strong>in</strong>g 2009, overall <strong>and</strong> by race/ethnicity <strong>and</strong> sex: 2004–09—Cont<strong>in</strong>ued<br />
Characteristic<br />
First <strong>in</strong>stitution level 2003–04<br />
Coeff<br />
Total<br />
(n = 11,410)<br />
SE<br />
Race/ethnicity subgroup models<br />
Sex subgroup models<br />
White (n = 7,806) Black (n = 1,205) Hispanic (n = 1,270) Male (n = 4,866) Female (n = 6,544)<br />
Odds<br />
ratio Coeff SE<br />
Odds<br />
ratio Coeff SE<br />
Odds<br />
ratio Coeff SE<br />
Odds<br />
ratio Coeff SE<br />
Odds<br />
ratio Coeff SE<br />
Less-than-4-year † (†) † † (†) † † (†) † † (†) † † (†) † † (†) †<br />
4-year 0.49 (0.100) 1.63 * 0.49 (0.110) 1.63 * 0.64 (0.310) 1.90 * 0.57 (0.250) 1.77 * 0.54 (0.150) 1.72 * 0.40 (0.120) 1.49 *<br />
Declared a major dur<strong>in</strong>g first year 0.09 (0.070) 1.09 0.07 (0.090) 1.07 0.53 (0.220) 1.70 * 0.09 (0.230) 1.09 0.22 (0.120) 1.25 * -0.04 (0.100) 0.96<br />
Took any remedial classes <strong>in</strong> 2004 -0.04 (0.080) 0.96 -0.05 (0.100) 0.95 -0.14 (0.200) 0.87 0.20 (0.260) 1.22 -0.05 (0.120) 0.95 -0.04 (0.100) 0.96<br />
Met with college advisor <strong>in</strong> 2004 0.26 (0.080) 1.30 * 0.29 (0.100) 1.34 * 0.12 (0.280) 1.13 0.19 (0.260) 1.21 -0.01 (0.130) 0.99 0.48 (0.110) 1.62 *<br />
Participated <strong>in</strong> school clubs <strong>in</strong> 2004 0.33 (0.080) 1.39 * 0.29 (0.110) 1.34 * 0.51 (0.240) 1.67 * 0.38 (0.280) 1.46 0.34 (0.120) 1.40 * 0.30 (0.110) 1.35 *<br />
Participated <strong>in</strong> school sports <strong>in</strong> 2004 -0.05 (0.080) 0.95 -0.17 (0.090) 0.84 0.04 (0.250) 1.04 0.16 (0.320) 1.17 -0.03 (0.110) 0.97 -0.03 (0.110) 0.97<br />
Odds<br />
ratio<br />
Multivariate Analyses of Immediate Postsecondary Enrollment <strong>and</strong> Degree Atta<strong>in</strong>ment 269<br />
Hours worked, <strong>in</strong>clud<strong>in</strong>g work-study<br />
Not work<strong>in</strong>g † (†) † † (†) † † (†) † † (†) † † (†) † † (†) †<br />
Up to 20 hours a week 0.08 (0.070) 1.08 0.12 (0.090) 1.13 0.25 (0.270) 1.28 -0.18 (0.260) 0.84 -0.03 (0.100) 0.97 0.17 (0.100) 1.19<br />
More than 20 hours a week -0.21 (0.090) 0.81 * -0.25 (0.110) 0.78 * -0.15 (0.260) 0.86 -0.37 (0.250) 0.69 -0.35 (0.130) 0.70 * -0.12 (0.110) 0.89<br />
Attendance <strong>in</strong>tensity pattern through<br />
2009<br />
Part-time for some/all semesters † (†) † † (†) † † (†) † † (†) † † (†) † † (†) †<br />
Always full-time 0.73 (0.070) 2.08 * 0.81 (0.080) 2.25 * 0.45 (0.240) 1.57 0.66 (0.260) 1.93 * 0.83 (0.110) 2.29 * 0.65 (0.100) 1.92 *<br />
Number of stopouts 1 through 2009 -0.91 (0.050) 0.40 * -0.88 (0.070) 0.41 * -1.00 (0.240) 0.37 * -0.79 (0.160) 0.45 * -0.85 (0.090) 0.43 * -0.96 (0.090) 0.38 *<br />
Number of transfers through 2009 -0.03 (0.060) 0.97 -0.01 (0.080) 0.99 -0.09 (0.170) 0.91 0.17 (0.170) 1.19 -0.08 (0.090) 0.92 0.02 (0.090) 1.02<br />
† Not applicable.<br />
* p < .05.<br />
1<br />
A “stopout” is def<strong>in</strong>ed as a temporary withdrawal of 5 or more consecutive months from enrollment at a postsecondary <strong>in</strong>stitution.<br />
NOTE: Italics refer to reference categories. Estimates are based on the sample of students who graduated from high school <strong>in</strong> 2003 or 2004 <strong>and</strong> who had a valid WTB000 weight. A small number of students <strong>in</strong> the<br />
sample (less than 150) reported that they graduated from high school <strong>in</strong> 2004. Students who were enrolled <strong>in</strong> high school <strong>and</strong> at a postsecondary <strong>in</strong>stitution concurrently were not eligible to be sampled for the<br />
BPS; however, students who completed high school <strong>in</strong> 2004 <strong>and</strong> then enrolled <strong>in</strong> a postsecondary course by June 2004 were eligible to be sampled. Multivariate analyses were not conducted for Asians, Native<br />
Hawaiians/Pacific Isl<strong>and</strong>ers, or American Indians/Alaska Natives due to small sample sizes.<br />
SOURCE: U.S. Department of <strong>Education</strong>, National Center for <strong>Education</strong> Statistics, 2003–04 Beg<strong>in</strong>n<strong>in</strong>g Postsecondary Students Longitud<strong>in</strong>al <strong>Study</strong>, Second Follow-up (BPS:04/09).<br />
8<br />
Multivariate Analyses
270 <strong>Higher</strong> <strong>Education</strong>: <strong>Gaps</strong> <strong>in</strong> <strong>Access</strong> <strong>and</strong> <strong>Persistence</strong> <strong>Study</strong><br />
Table BPS-3. Summary of logistic regression analyses for variables predict<strong>in</strong>g that recent high school graduates who entered a postsecondary <strong>in</strong>stitution <strong>in</strong> academic<br />
year 2003–04 would have completed an associate’s or bachelor’s degree as of spr<strong>in</strong>g 2009, overall <strong>and</strong> by race/ethnicity <strong>and</strong> sex: 2004–09<br />
Race/ethnicity by sex subgroup models<br />
White Black Hispanic<br />
Male (n = 3,393) Female (n = 4,413) Male (n = 465) Female (n = 740) Male (n = 510) Female (n = 760)<br />
Odds<br />
Odds<br />
Odds<br />
Odds<br />
Odds<br />
Odds<br />
Characteristic<br />
Coeff SE ratio Coeff SE ratio Coeff SE ratio Coeff SE ratio Coeff SE ratio Coeff SE ratio<br />
Intercept -2.07 (0.330) † -1.67 (0.340) † -1.60 (1.030) † -2.16 (0.860) † -2.11 (0.760) † -2.22 (0.730) †<br />
Parent’s highest level of education<br />
High school diploma or less <strong>and</strong><br />
vocational-technical tra<strong>in</strong><strong>in</strong>g † (†) † † (†) † † (†) † † (†) † † (†) † † (†) †<br />
Some college, less than bachelor’s<br />
degree 0.20 (0.240) 1.22 0.28 (0.160) 1.32 -0.32 (0.480) 0.73 0.13 (0.280) 1.14 -0.60 (0.520) 0.55 0.18 (0.390) 1.20<br />
Bachelor’s or higher degree 0.30 (0.190) 1.35 0.49 (0.150) 1.63 * -0.27 (0.470) 0.76 0.79 (0.330) 2.20 * -0.26 (0.460) 0.77 0.15 (0.370) 1.16<br />
Income quartile <strong>in</strong> 2004<br />
Low † (†) † † (†) † † (†) † † (†) † † (†) † † (†) †<br />
Low middle 0.36 (0.210) 1.43 0.39 (0.220) 1.48 0.24 (0.480) 1.27 0.33 (0.370) 1.39 0.44 (0.430) 1.55 0.41 (0.370) 1.51<br />
High middle 0.44 (0.200) 1.55 * 0.68 (0.200) 1.97 * 0.75 (0.580) 2.12 0.11 (0.340) 1.12 0.12 (0.570) 1.13 0.56 (0.480) 1.75<br />
High 0.58 (0.190) 1.79 * 0.81 (0.200) 2.25 * 1.37 (0.630) 3.94 * 0.24 (0.480) 1.27 0.61 (0.610) 1.84 1.09 (0.590) 2.97<br />
Highest level of high school mathematics<br />
None of these courses † (†) † † (†) † † (†) † † (†) † † (†) † † (†) †<br />
Algebra II/trigonometry 0.50 (0.230) 1.65 * 0.13 (0.210) 1.14 -0.44 (0.610) 0.64 0.43 (0.360) 1.54 0.82 (0.610) 2.27 0.33 (0.430) 1.39<br />
Precalculus/calculus 0.73 (0.260) 2.08 * 0.60 (0.230) 1.82 * 0.03 (0.630) 1.03 0.63 (0.450) 1.88 1.18 (0.730) 3.25 0.41 (0.520) 1.51<br />
Earned any college-level credits <strong>in</strong> high<br />
school 0.48 (0.130) 1.62 * 0.25 (0.120) 1.28 * 0.26 (0.420) 1.30 0.18 (0.370) 1.20 0.25 (0.370) 1.28 0.62 (0.320) 1.86<br />
Took the SAT or ACT exams 0.42 (0.250) 1.52 0.46 (0.270) 1.58 0.04 (0.760) 1.04 0.44 (0.700) 1.55 0.69 (0.540) 1.99 0.27 (0.460) 1.31<br />
First <strong>in</strong>stitution control 2003–04<br />
Public † (†) † † (†) † † (†) † † (†) † † (†) † † (†) †<br />
Private nonprofit 0.25 (0.140) 1.28 0.05 (0.150) 1.05 -0.16 (0.530) 0.85 0.33 (0.360) 1.39 -0.64 (0.560) 0.53 -0.12 (0.480) 0.89<br />
Private for-profit -0.55 (0.390) 0.58 -1.35 (0.380) 0.26 * 0.28 (0.860) 1.32 ‡ (†) † -0.49 (0.970) 0.61 -1.30 (0.630) 0.27 *<br />
First <strong>in</strong>stitution level 2003–04<br />
Less-than-4-year † (†) † † (†) † † (†) † † (†) † † (†) † † (†) †<br />
4-year 0.49 (0.180) 1.63 * 0.47 (0.150) 1.60 * 1.07 (0.570) 2.92 0.30 (0.330) 1.35 0.95 (0.480) 2.59 * 0.38 (0.350) 1.46<br />
Declared a major dur<strong>in</strong>g first year 0.19 (0.140) 1.21 -0.06 (0.140) 0.94 0.59 (0.370) 1.80 0.28 (0.330) 1.32 0.50 (0.450) 1.65 -0.08 (0.260) 0.92<br />
Took any remedial classes <strong>in</strong> 2004 -0.06 (0.150) 0.94 -0.04 (0.130) 0.96 -0.01 (0.380) 0.99 -0.27 (0.300) 0.76 0.40 (0.440) 1.49 0.09 (0.360) 1.09<br />
See notes at end of table.
Table BPS-3. Summary of logistic regression analyses for variables predict<strong>in</strong>g that recent high school graduates who entered a postsecondary <strong>in</strong>stitution <strong>in</strong> academic<br />
year 2003–04 would have completed an associate’s or bachelor’s degree as of spr<strong>in</strong>g 2009, overall <strong>and</strong> by race/ethnicity <strong>and</strong> sex: 2004–09—Cont<strong>in</strong>ued<br />
Characteristic<br />
Race/ethnicity by sex subgroup models<br />
White Black Hispanic<br />
Male (n = 3,393) Female (n = 4,413) Male (n = 465) Female (n = 740) Male (n = 510) Female (n = 760)<br />
Coeff<br />
SE<br />
Odds<br />
ratio Coeff SE<br />
Odds<br />
ratio Coeff SE<br />
Odds<br />
ratio Coeff SE<br />
Odds<br />
ratio Coeff SE<br />
Odds<br />
ratio Coeff SE<br />
Met with college advisor <strong>in</strong> 2004 0.05 (0.160) 1.05 0.51 (0.150) 1.67 * -0.57 (0.520) 0.57 0.53 (0.420) 1.70 -0.39 (0.470) 0.68 0.61 (0.340) 1.84<br />
Participated <strong>in</strong> school clubs <strong>in</strong> 2004 0.27 (0.150) 1.31 0.30 (0.140) 1.35 0.62 (0.410) 1.86 0.50 (0.250) 1.65 * 0.43 (0.470) 1.54 0.43 (0.410) 1.54<br />
Participated <strong>in</strong> school sports <strong>in</strong> 2004 -0.15 (0.140) 0.86 -0.13 (0.120) 0.88 0.06 (0.380) 1.06 0.23 (0.450) 1.26 0.11 (0.470) 1.12 0.17 (0.460) 1.19<br />
Hours worked, <strong>in</strong>clud<strong>in</strong>g work-study<br />
Not work<strong>in</strong>g † (†) † † (†) † † (†) † † (†) † † (†) † † (†) †<br />
Up to 20 hours a week 0.05 (0.130) 1.05 0.16 (0.120) 1.17 0.18 (0.470) 1.20 0.30 (0.290) 1.35 -0.60 (0.460) 0.55 0.18 (0.360) 1.20<br />
More than 20 hours a week -0.30 (0.170) 0.74 -0.24 (0.150) 0.79 -0.69 (0.500) 0.50 -0.01 (0.300) 0.99 -0.82 (0.430) 0.44 # (†) †<br />
Odds<br />
ratio<br />
Multivariate Analyses of Immediate Postsecondary Enrollment <strong>and</strong> Degree Atta<strong>in</strong>ment 271<br />
Attendance <strong>in</strong>tensity pattern through<br />
2009<br />
Part-time for some/all semesters † (†) † † (†) † † (†) † † (†) † † (†) † † (†) †<br />
Always full-time 0.97 (0.130) 2.64 * 0.65 (0.110) 1.92 * 0.85 (0.420) 2.34 * 0.27 (0.320) 1.31 0.20 (0.390) 1.22 0.94 (0.350) 2.56 *<br />
Number of stopouts 1 through 2009 -0.77 (0.100) 0.46 * -0.99 (0.110) 0.37 * -0.68 (0.400) 0.51 -1.14 (0.350) 0.32 * -0.88 (0.310) 0.41 * -0.75 (0.220) 0.47 *<br />
Number of transfers through 2009 -0.09 (0.120) 0.91 0.06 (0.110) 1.06 -0.21 (0.310) 0.81 -0.13 (0.220) 0.88 0.23 (0.260) 1.26 0.21 (0.240) 1.23<br />
† Not applicable.<br />
# Rounds to zero.<br />
‡ Report<strong>in</strong>g st<strong>and</strong>ards not met (too few cases).<br />
* p < .05.<br />
1<br />
A “stopout” is def<strong>in</strong>ed as a temporary withdrawal of 5 or more consecutive months from enrollment at a postsecondary <strong>in</strong>stitution.<br />
NOTE: Italics refer to reference categories. Estimates are based on the sample of students who graduated from high school <strong>in</strong> 2003 or 2004 <strong>and</strong> who had a valid WTB000 weight. A small number of students <strong>in</strong> the<br />
sample (less than 150) reported that they graduated from high school <strong>in</strong> 2004. Students who were enrolled <strong>in</strong> high school <strong>and</strong> at a postsecondary <strong>in</strong>stitution concurrently were not eligible to be sampled for the<br />
BPS; however, students who completed high school <strong>in</strong> 2004 <strong>and</strong> then enrolled <strong>in</strong> a postsecondary course by June 2004 were eligible to be sampled. Multivariate analyses were not conducted for Asians, Native<br />
Hawaiians/Pacific Isl<strong>and</strong>ers, or American Indians/Alaska Natives due to small sample sizes.<br />
SOURCE: U.S. Department of <strong>Education</strong>, National Center for <strong>Education</strong> Statistics, 2003–04 Beg<strong>in</strong>n<strong>in</strong>g Postsecondary Students Longitud<strong>in</strong>al <strong>Study</strong>, Second Follow-up (BPS:04/09).<br />
8<br />
Multivariate Analyses
272 <strong>Higher</strong> <strong>Education</strong>: <strong>Gaps</strong> <strong>in</strong> <strong>Access</strong> <strong>and</strong> <strong>Persistence</strong> <strong>Study</strong><br />
References
References<br />
Adelman, C. (2004). Pr<strong>in</strong>cipal Indicators of Student<br />
Academic Histories <strong>in</strong> Postsecondary <strong>Education</strong>, 1972–<br />
2000. Institute of <strong>Education</strong> Sciences, U.S. Department<br />
of <strong>Education</strong>. Wash<strong>in</strong>gton, DC.<br />
Adelman, C. (2006). The Toolbox Revisited: Paths to<br />
Degree Completion From High School Through College. U.S.<br />
Department of <strong>Education</strong>. Wash<strong>in</strong>gton, DC.<br />
Aud, S., Fox, M., <strong>and</strong> KewalRamani, A. (2010). Status<br />
<strong>and</strong> Trends <strong>in</strong> the <strong>Education</strong> of Racial <strong>and</strong> Ethnic Groups<br />
(NCES 2010-015). National Center for <strong>Education</strong><br />
Statistics, Institute of <strong>Education</strong> Sciences, U.S.<br />
Department of <strong>Education</strong>. Wash<strong>in</strong>gton, DC.<br />
Aud, S., Hussar, W., Kena, G., Bianco, K., Frohlich,<br />
L., Kemp, J., <strong>and</strong> Tahan, K. (2011). The Condition of<br />
<strong>Education</strong> 2011 (NCES 2011-033). National Center for<br />
<strong>Education</strong> Statistics, Institute of <strong>Education</strong> Sciences, U.S.<br />
Department of <strong>Education</strong>. Wash<strong>in</strong>gton, DC.<br />
Beauvais, F., Chavez, E., Oett<strong>in</strong>g, E., Deffenbacher,<br />
J., <strong>and</strong> Cornell, G. (1996). Drug Use, Violence, <strong>and</strong><br />
Victimization Among White American, Mexican<br />
American, <strong>and</strong> American Indian Dropouts, Students<br />
With Academic Problems, <strong>and</strong> Students <strong>in</strong> Good<br />
Academic St<strong>and</strong><strong>in</strong>g. Journal of Counsel<strong>in</strong>g Psychology,<br />
43(3): 292–299.<br />
Berkner, L., Cuccaro-Alam<strong>in</strong>, S., <strong>and</strong> McCormick,<br />
A. (1996). Descriptive Summary of 1989–90 Beg<strong>in</strong>n<strong>in</strong>g<br />
Postsecondary Students: Five Years Later, With an Essay<br />
on Postsecondary <strong>Persistence</strong> <strong>and</strong> Atta<strong>in</strong>ment (NCES<br />
96-155). National Center for <strong>Education</strong> Statistics,<br />
Office of <strong>Education</strong>al Research <strong>and</strong> Improvement, U.S.<br />
Department of <strong>Education</strong>. Wash<strong>in</strong>gton, DC.<br />
Bers, T.H., <strong>and</strong> Galowich, P.M. (2002). Us<strong>in</strong>g Survey<br />
<strong>and</strong> Focus Group Research to Learn About Parents’ Roles<br />
<strong>in</strong> the Community College Choice Process. Community<br />
College Review, 29(4): 67.<br />
Bett<strong>in</strong>ger, E., Long, B.T., Oreopoulos, P., <strong>and</strong><br />
Sanbonmatsu, L. (2009). The Role of Simplification <strong>and</strong><br />
Information <strong>in</strong> College Decisions: Results From the H&R<br />
Block FAFSA Experiment (NBER Work<strong>in</strong>g Paper 15361).<br />
Cambridge, MA: National Bureau of Economic Research.<br />
Black, M.M., Hess, C., <strong>and</strong> Berenson-Howard, J. (2000).<br />
Toddlers From Low-Income Families Have Below Normal<br />
Mental, Motor, <strong>and</strong> Behavior Scores on the Revised<br />
Bayley Scales. Journal of Applied Developmental Psychology,<br />
21(6): 655–666.<br />
Brady, D., Ow<strong>in</strong>gs, J., <strong>and</strong> Qu<strong>in</strong>n, P. (1992). Language<br />
Characteristics <strong>and</strong> Academic Achievement: A Look at Asian<br />
<strong>and</strong> Hispanic Eighth-Graders <strong>in</strong> NELS:88 (NCES 92-479).<br />
National Center for <strong>Education</strong> Statistics, Institute of<br />
<strong>Education</strong> Sciences, U.S. Department of <strong>Education</strong>.<br />
Wash<strong>in</strong>gton, DC.<br />
Braley, R., <strong>and</strong> Ogden, W. (1997). When Fail<strong>in</strong>g Indicates<br />
<strong>Higher</strong> Graduation Potential. College Student Journal, 31:<br />
243–250.<br />
Broh, B.A. (2002). L<strong>in</strong>k<strong>in</strong>g Extracurricular Programm<strong>in</strong>g<br />
to Academic Achievement: Who Benefits <strong>and</strong> Why?<br />
Sociology of <strong>Education</strong>, 75(1): 69–95.<br />
Brooks-Gunn, J., <strong>and</strong> Duncan, G. (1997). Effects of<br />
Poverty on Children. The Future of Children: Children <strong>and</strong><br />
Poverty, Summer/Fall 1997: 55–71.<br />
Bryant, A.L., Schulenberg, J.E., O’Malley, P.M.,<br />
Bachman, J.G., <strong>and</strong> Johnston, L.D. (2003). How<br />
Academic Achievement, Attitudes, <strong>and</strong> Behaviors Relate<br />
to the Course of Substance Use Dur<strong>in</strong>g Adolescence: A<br />
6-Year, Multiwave National Longitud<strong>in</strong>al <strong>Study</strong>. Journal<br />
of Research on Adolescence, 13(3): 361–397.<br />
Bryant, A.L., <strong>and</strong> Zimmerman, M.A. (2002). Exam<strong>in</strong><strong>in</strong>g<br />
the Effects of Academic Beliefs <strong>and</strong> Behaviors on Changes<br />
<strong>in</strong> Substance Use Among Urban Adolescents. Journal of<br />
<strong>Education</strong>al Psychology, 94(3): 621–637.<br />
Butner, B., Caldera, Y., Herrera, P., Kennedy, F., Frame,<br />
M., <strong>and</strong> Childers, C. (2001). The College Choice Process<br />
of African American <strong>and</strong> Hispanic Women: Implications<br />
for College Transitions. Journal of College Orientation <strong>and</strong><br />
Transition, 9(1): 24–32.<br />
Cabrera, A.F., <strong>and</strong> La Nasa, S.M. (2000). Underst<strong>and</strong><strong>in</strong>g<br />
the College Choice of Disadvantaged Students. San<br />
Francisco: Jossey-Bass.<br />
Cahalan, M., Farris, E., Pavel, M., Sk<strong>in</strong>ner, R.,<br />
Tippeconnic, J. (1988). American Indians <strong>and</strong> Alaska<br />
Natives <strong>in</strong> Postsecondary <strong>Education</strong> (NCES 98-291).<br />
National Center for <strong>Education</strong> Statistics, Institute of<br />
<strong>Education</strong> Sciences, U.S. Department of <strong>Education</strong>.<br />
Wash<strong>in</strong>gton, DC.<br />
Camara, W.J. (2005). Broaden<strong>in</strong>g Predictors of College<br />
Success. In W.J. Camara <strong>and</strong> E.W. Kimmel (Eds.),<br />
Choos<strong>in</strong>g Students: <strong>Higher</strong> <strong>Education</strong> Admissions Tools for<br />
the 21st Century (pp. 81–105). Mahwah, NJ: Lawrence<br />
Erlbaum Associates.<br />
References<br />
References 273
Campbell, F.A., Pungello, E.P., Miller-Johnson, S.,<br />
Burch<strong>in</strong>al, M., <strong>and</strong> Ramey, C.T. (2001). The Development<br />
of Cognitive <strong>and</strong> Academic Abilities: Growth Curves<br />
From an Early Childhood <strong>Education</strong>al Experiment.<br />
Developmental Psychology, 37(2): 231–242.<br />
Chen, X. (2009). Students Who <strong>Study</strong> Science, Technology,<br />
Eng<strong>in</strong>eer<strong>in</strong>g, <strong>and</strong> Mathematics (STEM) <strong>in</strong> Postsecondary<br />
<strong>Education</strong> (NCES 2009-161). National Center for<br />
<strong>Education</strong> Statistics, Institute of <strong>Education</strong> Sciences, U.S.<br />
Department of <strong>Education</strong>. Wash<strong>in</strong>gton, DC.<br />
Choy, S.P., Horn, L.J., Nunez, A., <strong>and</strong> Chen, X. (2000).<br />
Transition to College: What Helps At-Risk Students <strong>and</strong><br />
Students Whose Parents Did Not Attend College. New<br />
Directions for Institutional Research, 107: 45–63.<br />
Clotfelter, C.T. (2001). Are Whites Still Flee<strong>in</strong>g? Racial<br />
Patterns <strong>and</strong> Enrollment Shifts <strong>in</strong> Urban Public Schools,<br />
1987–1996. Journal of Policy Analysis & Management,<br />
20(2): 199–221.<br />
Clotfelter, C.T. (2004). After Brown: The Rise <strong>and</strong><br />
Retreat of School Desegregation. Pr<strong>in</strong>ceton, NJ: Pr<strong>in</strong>ceton<br />
University Press.<br />
Constant<strong>in</strong>e, J.M., Seftor, N.S., Sama Mart<strong>in</strong>, E., Silva,<br />
T., <strong>and</strong> Myers, D. (2006). <strong>Study</strong> of the Effect of the Talent<br />
Search Program on Secondary <strong>and</strong> Postsecondary Outcomes<br />
<strong>in</strong> Florida, Indiana, <strong>and</strong> Texas: F<strong>in</strong>al Report From Phase II<br />
of the National Evaluation. Pr<strong>in</strong>ceton, NJ: Mathematica<br />
Policy Research.<br />
Cooper, H., Rob<strong>in</strong>son, J.C., <strong>and</strong> Patall, E.A. (2006). Does<br />
Homework Improve Academic Achievement? A Synthesis<br />
of Research, 1987–2003. Review of <strong>Education</strong>al Research,<br />
76(1): 1–62.<br />
Crick, N.R., <strong>and</strong> Bigbee, M.A. (1998). Relational <strong>and</strong><br />
Overt Forms of Peer Victimization: A Multi-Informant<br />
Approach. Journal of Consult<strong>in</strong>g <strong>and</strong> Cl<strong>in</strong>ical Psychology,<br />
66: 337–347.<br />
Crick, N.R., <strong>and</strong> Grotpeter, J.K. (1996). Children’s<br />
Treatment by Peers: Victims of Relational <strong>and</strong> Overt<br />
Aggression. Development <strong>and</strong> Psychopathology, 8(2):<br />
367–380.<br />
Cunn<strong>in</strong>gham, A.F., Erisman, W., <strong>and</strong> Looney, S.M.<br />
(2007). From Aspirations to Action: The Role of Middle<br />
School Parents <strong>in</strong> Mak<strong>in</strong>g the Dream of College a Reality.<br />
Wash<strong>in</strong>gton, DC: Institute of <strong>Higher</strong> <strong>Education</strong> Policy.<br />
Engberg, M.E., <strong>and</strong> Wolniak, G.C. (2010). Exam<strong>in</strong><strong>in</strong>g<br />
the Effects of High School Contexts on Postsecondary<br />
Enrollment. Research <strong>in</strong> <strong>Higher</strong> <strong>Education</strong>, 51(2): 132–153.<br />
Ensm<strong>in</strong>ger, M., <strong>and</strong> Slusarick, A. (1992). Paths to High<br />
School Graduation or Dropout: A Longitud<strong>in</strong>al <strong>Study</strong> of a<br />
First Grade Cohort. Sociology of <strong>Education</strong>, 65: 95–113.<br />
Entwisle, D., Alex<strong>and</strong>er, K., <strong>and</strong> Olson, L. (2005). First<br />
Grade <strong>and</strong> <strong>Education</strong>al Atta<strong>in</strong>ment by Age 22: A New<br />
Story. American Journal of Sociology, 110(5): 1458–1502.<br />
Epste<strong>in</strong>, J.L., <strong>and</strong> Van Voorhis, F.L. (2001). More Than<br />
M<strong>in</strong>utes: Teachers’ Roles <strong>in</strong> Design<strong>in</strong>g Homework.<br />
<strong>Education</strong>al Psychologist, 36(3): 181–193.<br />
Evans, G.W., <strong>and</strong> Schamberg, M.A. (2009). Childhood<br />
Poverty, Chronic Stress, <strong>and</strong> Adult Work<strong>in</strong>g Memory.<br />
Proceed<strong>in</strong>gs of the National Academy of Sciences, 106(16):<br />
6545–6549.<br />
Feldman, A.M., <strong>and</strong> Matjasko, J.L. (2007). Profiles <strong>and</strong><br />
Portfolios of Adolescent School-Based Extracurricular<br />
Activity Participation. Journal of Adolescence, 30(2):<br />
313–322.<br />
F<strong>in</strong>n, J.D. (1993). School Engagement <strong>and</strong> Students at Risk<br />
(NCES 93-470). National Center for <strong>Education</strong> Statistics,<br />
Office of <strong>Education</strong>al Research <strong>and</strong> Improvement, U.S.<br />
Department of <strong>Education</strong>. Wash<strong>in</strong>gton, DC.<br />
Frankenberg, E., Lee, C., <strong>and</strong> Orfield, G. (2003). A<br />
Multiracial Society With Segregated Schools: Are We<br />
Los<strong>in</strong>g the Dream? Cambridge, MA: Civil Rights Project,<br />
Harvard University.<br />
G<strong>and</strong>erton, P., <strong>and</strong> Santos, R. (1995). Hispanic College<br />
Attendance <strong>and</strong> Completion: Evidence From the High<br />
School <strong>and</strong> Beyond Surveys. Economics of <strong>Education</strong><br />
Review, 14: 35–46.<br />
Grissom, J., <strong>and</strong> Shepard, L. (1989). Repeat<strong>in</strong>g <strong>and</strong><br />
Dropp<strong>in</strong>g Out of School. In L.A. Shepard <strong>and</strong> M.L.<br />
Smith (Eds.), Flunk<strong>in</strong>g Grades: Research <strong>and</strong> Policies on<br />
Retention (pp. 16–33). London: Falmer.<br />
Grodsky, E., <strong>and</strong> Jones, M.T. (2007). Real <strong>and</strong> Imag<strong>in</strong>ed<br />
Barriers to College Entry: Perceptions of Cost. Social<br />
Science Research, 36(2): 745–766.<br />
Gutman, L.M., <strong>and</strong> Midgley, C. (2000). The Role<br />
of Protective Factors <strong>in</strong> Support<strong>in</strong>g the Academic<br />
Achievement of Poor African American Students Dur<strong>in</strong>g<br />
the Middle School Transition. Journal of Youth <strong>and</strong><br />
Adolescence, 29(2): 223–248.<br />
Hill, L.D. (2008). School Strategies <strong>and</strong> the ‘‘College-<br />
L<strong>in</strong>k<strong>in</strong>g’’ Process: Reconsider<strong>in</strong>g the Effects of High<br />
Schools on College Enrollment. Sociology of <strong>Education</strong>,<br />
81(1): 53–76.<br />
274 <strong>Higher</strong> <strong>Education</strong>: <strong>Gaps</strong> <strong>in</strong> <strong>Access</strong> <strong>and</strong> <strong>Persistence</strong> <strong>Study</strong>
Horn, L. (1998). Stopouts or Stayouts? Undergraduates<br />
Who Leave College <strong>in</strong> Their First Year (NCES 1999-<br />
087). National Center for <strong>Education</strong> Statistics, Office<br />
of <strong>Education</strong>al Research <strong>and</strong> Improvement, U.S.<br />
Department of <strong>Education</strong>. Wash<strong>in</strong>gton, DC.<br />
Horn, L., <strong>and</strong> Berktold, J. (1999). Students With<br />
Disabilities <strong>in</strong> Postsecondary <strong>Education</strong>: A Profile of<br />
Preparation, Participation, <strong>and</strong> Outcomes (NCES 1999-<br />
187). National Center for <strong>Education</strong> Statistics, Institute<br />
of <strong>Education</strong> Sciences, U.S. Department of <strong>Education</strong>.<br />
Wash<strong>in</strong>gton, DC.<br />
Horn, L., <strong>and</strong> Kojaku, L.K. (2001). High School Academic<br />
Curriculum <strong>and</strong> the <strong>Persistence</strong> Path Through College<br />
(NCES 2001–163). National Center for <strong>Education</strong><br />
Statistics, Institute of <strong>Education</strong> Sciences, U.S.<br />
Department of <strong>Education</strong>. Wash<strong>in</strong>gton, DC.<br />
Horn, L.J., <strong>and</strong> Chen, X. (1998). Toward Resiliency:<br />
At-Risk Students Who Make It to College. Office<br />
of <strong>Education</strong>al Research <strong>and</strong> Improvement, U.S.<br />
Department of <strong>Education</strong>. Wash<strong>in</strong>gton, DC.<br />
Horn, L.J., Chen, X., <strong>and</strong> Chapman, C. (2003). Gett<strong>in</strong>g<br />
Ready to Pay for College: What Students <strong>and</strong> Their Parents<br />
Know About the Cost of College Tuition <strong>and</strong> What They Are<br />
Do<strong>in</strong>g to F<strong>in</strong>d Out (NCES 2003-030). National Center<br />
for <strong>Education</strong> Statistics, Institute of <strong>Education</strong> Sciences,<br />
U.S. Department of <strong>Education</strong>. Wash<strong>in</strong>gton, DC.<br />
Hossler, D., Schmit, J., <strong>and</strong> Vesper, N. (1999). Go<strong>in</strong>g to<br />
College. How Social, Economic, <strong>and</strong> <strong>Education</strong>al Factors<br />
Influence the Decisions Students Make. Baltimore: Johns<br />
Hopk<strong>in</strong>s University Press.<br />
Ingels, S.J., <strong>and</strong> Dalton, B.W. (2008). Trends Among High<br />
School Seniors, 1972–2004 (NCES 2008-320). National<br />
Center for <strong>Education</strong> Statistics, Institute of <strong>Education</strong><br />
Sciences, U.S. Department of <strong>Education</strong>. Wash<strong>in</strong>gton,<br />
DC.<br />
Ishitani, T.T., <strong>and</strong> Snider, K.G. (May 2004). Longitud<strong>in</strong>al<br />
Effects of College Preparation Programs on College<br />
Retention. Paper presented at the 44th Annual Forum of<br />
the Association for Institutional Research, Boston.<br />
Jimerson, S.R. (1999). On the Failure of Failure:<br />
Exam<strong>in</strong><strong>in</strong>g the Association Between Early Grade<br />
Retention <strong>and</strong> <strong>Education</strong> <strong>and</strong> Employment Outcomes<br />
Dur<strong>in</strong>g Late Adolescence. Journal of School Psychology,<br />
37(3): 243–272.<br />
Jimerson, S.R. (2001). Meta-Analysis of Grade Retention<br />
Research: Implications for Practice <strong>in</strong> the 21st Century.<br />
School Psychology Review, 30(3): 420–437.<br />
Jimerson, S.R., Anderson, G.E., <strong>and</strong> Whipple, A.D.<br />
(2002). W<strong>in</strong>n<strong>in</strong>g the Battle <strong>and</strong> Los<strong>in</strong>g the War:<br />
Exam<strong>in</strong><strong>in</strong>g the Relation Between Grade Retention <strong>and</strong><br />
Dropp<strong>in</strong>g Out of High School. Psychology <strong>in</strong> the Schools,<br />
39(4): 441–457.<br />
Jimerson, S.R., Ferguson, P., Whipple, A.D., Anderson,<br />
G.E., <strong>and</strong> Dalton, M.J. (2002). Explor<strong>in</strong>g the Association<br />
Between Grade Retention <strong>and</strong> Dropout: A Longitud<strong>in</strong>al<br />
<strong>Study</strong> Exam<strong>in</strong><strong>in</strong>g Socioemotional, Behavioral, <strong>and</strong><br />
Achievement Characteristics of Reta<strong>in</strong>ed Students. The<br />
California School Psychologist, 7: 51–62.<br />
Johnson, A.W. (1998). An Evaluation of the Long-Term<br />
Impacts of the Sponsor-a-Scholar Program on Student<br />
Achievement. Pr<strong>in</strong>ceton, NJ: Mathematica Policy<br />
Research.<br />
Jordan, G.E., Snow, C.E., <strong>and</strong> Porche, M.V. (2000).<br />
Project EASE: The Effect of a Family Literacy Project<br />
on K<strong>in</strong>dergarten Students’ Early Literacy Skills. Read<strong>in</strong>g<br />
Research Quarterly, 35(4): 524–546.<br />
Jordan, W.J. (1999). High School Students’ Participation<br />
<strong>in</strong> School-Sponsored Sports Activities: Effects on<br />
School Engagement <strong>and</strong> Achievement. Journal of Negro<br />
<strong>Education</strong>, 68(1): 54–71.<br />
Jordan, W.J., <strong>and</strong> Nettles, S.M. (1999). How Students<br />
Invest Their Time Out of School: Effects on School<br />
Engagement, Perceptions of Life Chances, <strong>and</strong> Achievement.<br />
(Report 29). Center for Research on the <strong>Education</strong> of<br />
Students Placed at Risk.<br />
Kao, G., <strong>and</strong> Tienda, M. (1998). <strong>Education</strong>al Aspirations<br />
of M<strong>in</strong>ority Youth. American Journal of <strong>Education</strong>, 106(3):<br />
349–384.<br />
K<strong>in</strong>g, J.E. (2006). Missed Opportunities Revisited: New<br />
Information on Students Who Do Not Apply for F<strong>in</strong>ancial<br />
Aid. Wash<strong>in</strong>gton, DC: American Council on <strong>Education</strong>.<br />
Kle<strong>in</strong>, S., Bugar<strong>in</strong>, R., Beltranena, R., <strong>and</strong> McArthur, E.<br />
(2004). Language M<strong>in</strong>orities <strong>and</strong> Their <strong>Education</strong>al <strong>and</strong><br />
Labor Market Indicators—Recent Trends (NCES 2004-<br />
009). National Center for <strong>Education</strong> Statistics, Institute<br />
of <strong>Education</strong> Sciences, U.S. Department of <strong>Education</strong>.<br />
Wash<strong>in</strong>gton, DC.<br />
Lamborn, S.D., Brown, B.B., Mounts, N.S., <strong>and</strong><br />
Ste<strong>in</strong>berg, L. (1992). Putt<strong>in</strong>g School <strong>in</strong> Perspective: The<br />
Influence of Family, Peers, Extracurricular Participation,<br />
<strong>and</strong> Part-Time Work on Academic Engagement. In F.M.<br />
Newmann (Ed.), Student Engagement <strong>and</strong> Achievement <strong>in</strong><br />
American Secondary Schools. New York: Teachers’ College<br />
Press.<br />
Lee, V.E., <strong>and</strong> Burkman, D.T. (2002). Inequality at<br />
the Start<strong>in</strong>g Gate: Social Background Differences <strong>in</strong><br />
Achievement as Children Beg<strong>in</strong> School. Wash<strong>in</strong>gton, DC:<br />
Economic Policy Institute.<br />
Lipscomb, S. (2007). Secondary School Extracurricular<br />
Involvement <strong>and</strong> Academic Achievement: A Fixed<br />
Approach. Economics of <strong>Education</strong> Review, 26(4):<br />
463–472.<br />
References<br />
References 275
MacMillan, R., <strong>and</strong> Hagan, J. (2004). Violence <strong>in</strong> the<br />
Transition to Adulthood: Adolescent Victimization,<br />
<strong>Education</strong>, <strong>and</strong> Socioeconomic Atta<strong>in</strong>ment <strong>in</strong> Later Life.<br />
Journal of Research on Adolescence, 14(2): 127–158.<br />
Matthews, M.S., <strong>and</strong> Farmer, J.L. (2008). Factors<br />
Affect<strong>in</strong>g the Algebra I Achievement of Academically<br />
Talented Learners. Journal of Advanced Academics, 19(3):<br />
472–501.<br />
McDonough, P. (1997). Choos<strong>in</strong>g Colleges: How Social<br />
Class <strong>and</strong> Schools Structure Opportunity. Albany, NY: State<br />
University of New York Press.<br />
McDonough, P.M. (2005). Counsel<strong>in</strong>g <strong>and</strong> College<br />
Counsel<strong>in</strong>g <strong>in</strong> America’s High Schools. Alex<strong>and</strong>ria, VA:<br />
National Association for College Admission Counsel<strong>in</strong>g.<br />
Nansel, T.R., Overpeck, M.D., Haynie, D.L., Ruan, W.J.,<br />
<strong>and</strong> Scheidt, P.C. (2003). Relationships Between Bully<strong>in</strong>g<br />
<strong>and</strong> Violence Among U.S. Youth. Archives of Pediatric <strong>and</strong><br />
Adolescent Medic<strong>in</strong>e, 157(4): 348–353.<br />
Nansel, T.R., Overpeck, M., Pilla, R., Ruan, W., Simons-<br />
Morton, B., <strong>and</strong> Scheidt, P. (2001). Bully<strong>in</strong>g Behaviors<br />
Among U.S. Youth: Prevalence <strong>and</strong> Association With<br />
Psychosocial Adjustment. Journal of the American Medical<br />
Association, 285(16): 2094–2100.<br />
National Mathematics Advisory Panel. (2008).<br />
Foundations for Success: The F<strong>in</strong>al Report of the National<br />
Mathematics Advisory Panel. U.S. Department of<br />
<strong>Education</strong>. Wash<strong>in</strong>gton, DC.<br />
Nunez, A.-M., <strong>and</strong> Cuccaro-Alam<strong>in</strong>, S. (1998). First-<br />
Generation Students: Undergraduates Whose Parents Never<br />
Enrolled <strong>in</strong> Postsecondary <strong>Education</strong> (NCES 98-082).<br />
National Center for <strong>Education</strong> Statistics, Institute of<br />
<strong>Education</strong> Sciences, U.S. Department of <strong>Education</strong>.<br />
Wash<strong>in</strong>gton, DC.<br />
Pascarella, E.T., <strong>and</strong> Terenz<strong>in</strong>i, P.T. (2005). How College<br />
Affects Students: A Third Decade of Research (2nd ed.). San<br />
Francisco: Jossey-Bass.<br />
Plank, S.B., <strong>and</strong> Jordan, W.J. (2001). Effects of<br />
Information, Guidance, <strong>and</strong> Actions on Postsecondary<br />
Dest<strong>in</strong>ations: A <strong>Study</strong> of Talent Loss. American<br />
<strong>Education</strong>al Research Journal, 38(4): 947–979.<br />
Planty, M., Hussar, W., Snyder, T., Kena, G.,<br />
KewalRamani, A., Kemp, J., Bianco, K., <strong>and</strong> D<strong>in</strong>kes, R.<br />
(2009). The Condition of <strong>Education</strong> 2009 (NCES 2009-<br />
081). National Center for <strong>Education</strong> Statistics, Institute<br />
of <strong>Education</strong> Sciences, U.S. Department of <strong>Education</strong>.<br />
Wash<strong>in</strong>gton, DC.<br />
Pr<strong>in</strong>ste<strong>in</strong>, M.J., Boergers, J., <strong>and</strong> Vernberg, E.M. (2001).<br />
Overt <strong>and</strong> Relational Aggression <strong>in</strong> Adolescents: Social-<br />
Psychological Adjustment of Aggressors <strong>and</strong> Victims.<br />
Journal of Cl<strong>in</strong>ical Child Psychology, 30(4): 479–491.<br />
Raghunathan, T.E., Lepkowski, J.M., Van Hoewyk, J.,<br />
<strong>and</strong> Solenberger, P. (2001). A Multivariate Technique for<br />
Multiply Imput<strong>in</strong>g Miss<strong>in</strong>g Values Us<strong>in</strong>g a Sequence of<br />
Regression Models. Survey Methodology, 27(1): 85–95.<br />
R<strong>in</strong>gwalt, C.L., Ennett, S., <strong>and</strong> Johnson, R. (2003).<br />
Factors Associated With Fidelity to Substance Use<br />
Prevention Curriculum Guides <strong>in</strong> the Nation’s Middle<br />
Schools. Health <strong>Education</strong> & Behavior, 30(3): 375–391.<br />
Roderick, M., Nagaoka, J., Coca, V., <strong>and</strong> Moeller, E.<br />
(2008). From High School to the Future: Potholes on the<br />
Road to College. Chicago: Consortium on Chicago School<br />
Research.<br />
Rumberger, R. (1987). High School Dropouts: A Review<br />
of Issues <strong>and</strong> Evidence. Review of <strong>Education</strong>al Research,<br />
57(2): 101–121.<br />
Rumberger, R. (1995). Dropp<strong>in</strong>g Out of Middle School:<br />
A Multilevel Analysis of Students <strong>and</strong> Schools. American<br />
<strong>Education</strong>al Research Journal, 32(3): 583–625.<br />
Rumberger, R.W., <strong>and</strong> Palardy, G.J. (2005). Does<br />
Segregation Still Matter? The Impact of Student<br />
Composition on Academic Achievement <strong>in</strong> High School.<br />
Teachers College Record 107(9): 1999–2045.<br />
S<strong>and</strong>oval, J., <strong>and</strong> Fitzgerald, P. (1985). A High School<br />
Follow-up of Children Who Were Nonpromoted or<br />
Attended a Junior First Grade. Psychology <strong>in</strong> the Schools,<br />
22(2): 164–170.<br />
Schmidt, W.H. (2004). A Vision for Mathematics.<br />
<strong>Education</strong>al Leadership, 61(5): 6–11.<br />
Schneider, B., Swanson, C.B., <strong>and</strong> Riegle-Crumb, C.<br />
(1998). Opportunities for Learn<strong>in</strong>g: Course Sequences<br />
<strong>and</strong> Positional Advantages. Social Psychology of <strong>Education</strong>,<br />
2(1): 25–53.<br />
Shulruf, B., Tumen, S., <strong>and</strong> Tolley, H. (2008).<br />
Extracurricular Activities <strong>in</strong> School: Do They Matter?<br />
Children <strong>and</strong> Youth Services Review, 30(4): 418–426.<br />
Shumow, L., <strong>and</strong> Miller, J.D. (2001). Parents’ At-Home<br />
<strong>and</strong> At-School Academic Involvement With Young<br />
Adolescents. Journal of Early Adolescence, 21(1): 68–91.<br />
S<strong>in</strong>gh, K. (1998). Part-Time Employment <strong>in</strong> High School<br />
<strong>and</strong> Its Effect on Academic Achievement. Journal of<br />
<strong>Education</strong>al Research, 91(3): 131–139.<br />
S<strong>in</strong>gh, K., <strong>and</strong> Ozturk, M. (2000). Effect of Part-Time<br />
Work on High School Mathematics <strong>and</strong> Science Course<br />
Tak<strong>in</strong>g. Journal of <strong>Education</strong>al Research, 91(2): 67–74.<br />
St. John, E.P., Paulsen, M.B., <strong>and</strong> Starkey, J.B. (1996).<br />
The Nexus Between College Choice <strong>and</strong> <strong>Persistence</strong>.<br />
Research <strong>in</strong> <strong>Higher</strong> <strong>Education</strong>, 37(2): 175–220.<br />
276 <strong>Higher</strong> <strong>Education</strong>: <strong>Gaps</strong> <strong>in</strong> <strong>Access</strong> <strong>and</strong> <strong>Persistence</strong> <strong>Study</strong>
Starkey, P., <strong>and</strong> Kle<strong>in</strong>, A. (2000). Foster<strong>in</strong>g Parental<br />
Support for Children’s Mathematical Development: An<br />
Intervention With Head Start Families. Early <strong>Education</strong><br />
<strong>and</strong> Development, 11(5): 659–680.<br />
Storch, E.A., Nock, M.K., Masia-Warner, C., <strong>and</strong> Barlas,<br />
M.E. (2003). Peer Victimization <strong>and</strong> Social-Psychological<br />
Adjustment <strong>in</strong> Hispanic <strong>and</strong> African-American Children.<br />
Journal of Child & Family Studies, 12(4): 439–455.<br />
Terenz<strong>in</strong>i, P., Cabrera, A., <strong>and</strong> Bernal, E. (2001).<br />
Swimm<strong>in</strong>g Aga<strong>in</strong>st the Tide: The Poor <strong>in</strong> American <strong>Higher</strong><br />
<strong>Education</strong>. New York: College Board.<br />
Titus, M.A. (2004). An Exam<strong>in</strong>ation of the Influence<br />
of Institutional Content on Student <strong>Persistence</strong> at Four-<br />
Year Colleges <strong>and</strong> Universities: A Multilevel Approach.<br />
Research <strong>in</strong> <strong>Higher</strong> <strong>Education</strong>, 45(7): 673–699.<br />
U.S. Department of Labor, Bureau of Labor Statistics<br />
(1995). A Test of Methods for Collect<strong>in</strong>g Racial <strong>and</strong> Ethnic<br />
Information (USDL 95-428). Wash<strong>in</strong>gton DC: Author.<br />
Venezia, A., <strong>and</strong> Kirst, M.W. (2005). Inequitable<br />
Opportunities: How Current <strong>Education</strong> Systems <strong>and</strong><br />
Policies Underm<strong>in</strong>e the Chances for Student <strong>Persistence</strong><br />
<strong>and</strong> Success <strong>in</strong> College. <strong>Education</strong>al Policy, 19(2):<br />
283–307.<br />
Walston, J., <strong>and</strong> McCarroll, J.C. (2010). Eighth-Grade<br />
Algebra: F<strong>in</strong>d<strong>in</strong>gs From the Eighth-Grade Round of the<br />
Early Childhood Longitud<strong>in</strong>al <strong>Study</strong>, K<strong>in</strong>dergarten Class of<br />
1998–99 (ECLS-K) (NCES 2010-016). U.S. Department<br />
of <strong>Education</strong>, National Center for <strong>Education</strong> Statistics.<br />
Wash<strong>in</strong>gton, DC.<br />
Wei, C.C., <strong>and</strong> Horn, L. (2009). A Profile of Successful<br />
Pell Grant Recipients: Time to Bachelor’s Degree <strong>and</strong> Early<br />
Graduate School Enrollment (NCES 2009-156). National<br />
Center for <strong>Education</strong> Statistics, Institute of <strong>Education</strong><br />
Sciences, U.S. Department of <strong>Education</strong>. Wash<strong>in</strong>gton,<br />
DC.<br />
Wei, H., <strong>and</strong> Williams, J.H. (2004). Relationship<br />
Between Peer Victimization <strong>and</strong> School Adjustment <strong>in</strong><br />
Sixth-Grade Students: Investigat<strong>in</strong>g Mediation Effects.<br />
Violence <strong>and</strong> Victims, 19(5): 557–571.<br />
Weissman, J., Silke, E., <strong>and</strong> Bulakowski, C. (1997).<br />
Assess<strong>in</strong>g Developmental <strong>Education</strong> Policies. Research <strong>in</strong><br />
<strong>Higher</strong> <strong>Education</strong>, 38(2): 187–200.<br />
Whitaker, D., <strong>and</strong> Pascarella, E. (1994). Two-Year College<br />
Attendance <strong>and</strong> Socioeconomic Atta<strong>in</strong>ment: Some<br />
Additional Evidence. Journal of <strong>Higher</strong> <strong>Education</strong>, 65:<br />
194–210.<br />
References<br />
References 277
Appendix A<br />
Technical Appendix—Logistic Regression Analysis<br />
<strong>and</strong> Imputation Procedures<br />
278 <strong>Higher</strong> <strong>Education</strong>: <strong>Gaps</strong> <strong>in</strong> <strong>Access</strong> <strong>and</strong> <strong>Persistence</strong> <strong>Study</strong>
Appendix A: TECHNICAL APPENDIX—LOGISTIC<br />
REGRESSION ANALYSIS AND IMPUTATION PROCEDURES<br />
In chapter 8 of this report, two logistic regression<br />
analyses were conducted to explore factors associated<br />
with students’ immediate enrollment <strong>in</strong> postsecondary<br />
education after high school <strong>and</strong> their atta<strong>in</strong>ment of an<br />
associate’s or bachelor’s degree with<strong>in</strong> 6 years of beg<strong>in</strong>n<strong>in</strong>g<br />
postsecondary education. Multivariate analyses, such as<br />
logistic multiple regression models, provide <strong>in</strong>formation<br />
on whether group differences <strong>in</strong> immediate postsecondary<br />
enrollment <strong>and</strong> degree atta<strong>in</strong>ment persist after<br />
controll<strong>in</strong>g for student, family, <strong>and</strong> school/<strong>in</strong>stitutional<br />
characteristics. The analysis for the first model, immediate<br />
postsecondary enrollment, was conducted us<strong>in</strong>g data from<br />
the <strong>Education</strong> Longitud<strong>in</strong>al <strong>Study</strong> of 2002 (ELS:2002),<br />
<strong>in</strong>clud<strong>in</strong>g variables from the base year (2002), first<br />
follow-up (2004), <strong>and</strong> second follow-up (2006). The<br />
analysis for the second model, atta<strong>in</strong>ment of an associate’s<br />
or bachelor’s degree with<strong>in</strong> 6 years of beg<strong>in</strong>n<strong>in</strong>g<br />
postsecondary education, was conducted us<strong>in</strong>g data from<br />
the Beg<strong>in</strong>n<strong>in</strong>g Postsecondary Students Longitud<strong>in</strong>al<br />
<strong>Study</strong> (BPS:04/09), <strong>in</strong>clud<strong>in</strong>g data from the base year<br />
(2004), first follow-up (2006), <strong>and</strong> second follow-up<br />
(2009). Descriptions of the ELS:2002 <strong>and</strong> BPS:04/09<br />
surveys are provided <strong>in</strong> the Guide to Sources section of this<br />
report.<br />
This technical appendix provides details on the logistic<br />
regression models used with the ELS:2002 <strong>and</strong> BPS:04/09<br />
analysis datasets. In addition, this appendix provides<br />
details on the procedures used to impute miss<strong>in</strong>g data<br />
for key variables used <strong>in</strong> the ELS:2002 logistic regression<br />
model. The BPS:04/09 dataset variables were imputed<br />
before release, so no additional imputation procedures<br />
were performed. The appendix concludes with a glossary<br />
of def<strong>in</strong>itions of the ELS:2002 <strong>and</strong> BPS:04/09 variables<br />
used <strong>in</strong> the logistic regression models.<br />
Logistic regression procedures<br />
The analyses conducted <strong>in</strong> chapter 8 employed the<br />
technique of logistic regression for categorical outcomes,<br />
which produces coefficients estimat<strong>in</strong>g the relationship<br />
between <strong>in</strong>dependent variables on the probability of the<br />
dependent outcome. To aid <strong>in</strong> the <strong>in</strong>terpretation of results,<br />
the effect of a change <strong>in</strong> a given <strong>in</strong>dependent variable,<br />
X, is transformed <strong>in</strong>to an odds ratio <strong>and</strong> the percentage<br />
likelihood of the dependent outcome. The formula for<br />
calculat<strong>in</strong>g an odds ratio is<br />
exp (beta j<br />
)c<br />
where exp equals base e (a constant equal to<br />
2.71828182845904, the base of the natural logarithm),<br />
beta equals the logistic regression coefficient (represented<br />
<strong>in</strong> the equation as an exponent), <strong>and</strong> c equals the number<br />
of units of change <strong>in</strong> X (e.g., 1, 2, 30). For categorical<br />
variables, the value of c is set to 1 <strong>and</strong> the odds ratio<br />
equals the exponent of the logistic regression coefficient.<br />
Both the ELS:2002 <strong>and</strong> BPS:04/09 logistic regression<br />
analyses were conducted with the SUDAAN-callable<br />
procedure “PROC RLOGIST” us<strong>in</strong>g SAS, version 9.2.<br />
For the ELS:2002 analyses, the multiple imputation<br />
option was <strong>in</strong>cluded <strong>in</strong> the SUDAAN procedure to<br />
<strong>in</strong>clude five imputed datasets, which are discussed <strong>in</strong><br />
the next section (“Imputation procedures for ELS:2002<br />
data”). The ELS:2002 analysis was weighted by the<br />
full sample weight (F2BYWT), <strong>and</strong> st<strong>and</strong>ard errors<br />
were calculated us<strong>in</strong>g balanced repeated replication<br />
(BRR) procedures with the replicate weights (F2BYP1<br />
– F2BYP200). The BPS:04/09 analysis was weighted by<br />
the full sample weight (WTB000), <strong>and</strong> st<strong>and</strong>ard errors<br />
were calculated us<strong>in</strong>g BRR procedures with the replicate<br />
weights (WTB001 – WTB200).<br />
In the ELS:2002 logistic regression model, the b<strong>in</strong>ary<br />
dependent variable was an <strong>in</strong>dicator of whether an<br />
on-time 2004 high school graduate enrolled immediately<br />
<strong>in</strong> a postsecondary <strong>in</strong>stitution (i.e., by December 2004).<br />
Multiple categorical <strong>and</strong> cont<strong>in</strong>uous <strong>in</strong>dependent variables<br />
were entered simultaneously for the regression analysis<br />
to allow for the <strong>in</strong>terpretation of relationships between<br />
each <strong>in</strong>dependent variable <strong>and</strong> immediate postsecondary<br />
enrollment, after controll<strong>in</strong>g for other <strong>in</strong>dependent<br />
variables <strong>in</strong>cluded <strong>in</strong> the model. The <strong>in</strong>dependent<br />
variables <strong>in</strong>cluded <strong>in</strong> the ELS:2002 regression model<br />
<strong>in</strong>clude student’s sex, race/ethnicity, socioeconomic status,<br />
family composition (i.e., number of parents/guardians <strong>in</strong><br />
the household), st<strong>and</strong>ardized 10th-grade mathematics test<br />
score, 9th-grade GPA, previous grade retention status,<br />
sports <strong>and</strong> extracurricular activities participation status,<br />
number of absences from school, number of times skipped<br />
classes, parent engagement <strong>in</strong> discuss<strong>in</strong>g coursework with<br />
student, number of hours worked per week, <strong>and</strong> number<br />
of close friends who dropped out of high school. Only<br />
students who graduated from high school by August<br />
2004 were used <strong>in</strong> the logistic model for immediate<br />
postsecondary enrollment.<br />
In the BPS:04/09 logistic regression model, the b<strong>in</strong>ary<br />
dependent variable was an <strong>in</strong>dicator of whether a<br />
recent high school graduate who began postsecondary<br />
enrollment <strong>in</strong> academic year 2003–04 atta<strong>in</strong>ed an<br />
associate’s or bachelor’s degree by June 2009 (i.e., with<strong>in</strong><br />
6 years of enter<strong>in</strong>g postsecondary education). Multiple<br />
categorical <strong>and</strong> cont<strong>in</strong>uous <strong>in</strong>dependent variables were<br />
entered simultaneously for the regression analysis to<br />
allow for the <strong>in</strong>terpretation of relationships between<br />
each <strong>in</strong>dependent variable <strong>and</strong> associate’s or bachelor’s<br />
degree atta<strong>in</strong>ment, after controll<strong>in</strong>g for other <strong>in</strong>dependent<br />
variables <strong>in</strong>cluded <strong>in</strong> the model. The <strong>in</strong>dependent<br />
variables <strong>in</strong>cluded <strong>in</strong> the BPS:04/09 regression model<br />
<strong>in</strong>clude student’s sex, race/ethnicity, parents’ educational<br />
atta<strong>in</strong>ment, <strong>in</strong>come quartile <strong>in</strong> 2004, highest level of high<br />
school mathematics, <strong>in</strong>dicators for college-level credits<br />
Appendix A<br />
Appendix A 279
earned <strong>in</strong> high school, SAT/ACT test tak<strong>in</strong>g, control<br />
<strong>and</strong> level of first postsecondary <strong>in</strong>stitution, whether the<br />
student declared a major dur<strong>in</strong>g the first year, whether<br />
remedial classes were taken <strong>in</strong> the first year, whether the<br />
student met with advisor <strong>in</strong> the first year, school club<br />
<strong>and</strong> sports participation status <strong>in</strong> the first year, number<br />
of hours worked per week, attendance <strong>in</strong>tensity pattern<br />
through 2009 (e.g., always enrolled full time), <strong>and</strong><br />
number of “stopouts” 1 <strong>and</strong> transfers through 2009. Only<br />
students who graduated from high school <strong>in</strong> the year prior<br />
to enter<strong>in</strong>g postsecondary education were used <strong>in</strong> the<br />
logistic model for degree atta<strong>in</strong>ment.<br />
Associations between student characteristics <strong>and</strong> the two<br />
outcome variables were exam<strong>in</strong>ed for the full sample as<br />
well as separately for males <strong>and</strong> females; separately for<br />
Whites, Blacks, <strong>and</strong> Hispanics; <strong>and</strong> separately for males<br />
<strong>and</strong> females with<strong>in</strong> each of these racial/ethnic groups.<br />
Multivariate analyses were not conducted for Asians,<br />
Native Hawaiians/Pacific Isl<strong>and</strong>ers, or American Indians/<br />
Alaska Natives due to small sample sizes. Also, for the<br />
Black male <strong>and</strong> female <strong>and</strong> Hispanic male <strong>and</strong> female<br />
subgroup models, some of the results that appear to be<br />
substantive <strong>in</strong> magnitude are not statistically significant<br />
due to small subgroup sample sizes.<br />
The global fit of the full sample <strong>and</strong> subgroup logistic<br />
models were assessed us<strong>in</strong>g different diagnostic measures,<br />
<strong>in</strong>clud<strong>in</strong>g chi-squared statistics, pseudo r squared values,<br />
<strong>and</strong> measures of the <strong>in</strong>crease <strong>in</strong> the percentage accuracy<br />
<strong>in</strong> classify<strong>in</strong>g cases on the dichotomous outcome variable<br />
based on comparisons between an <strong>in</strong>tercept-only model<br />
<strong>and</strong> a fully specified model. The Likelihood Ratio (LR)<br />
Chi-Square test results <strong>in</strong>dicate that the fully specified<br />
model is a better fit than the <strong>in</strong>tercept-only model for the<br />
full sample <strong>and</strong> subgroup logistic models. The diagnostic<br />
results also <strong>in</strong>dicate that the percentage accuracy <strong>in</strong><br />
predict<strong>in</strong>g the outcome variable <strong>in</strong>creased across all of the<br />
logistic regression models when the selected <strong>in</strong>dependent<br />
variables were <strong>in</strong>cluded. For example, the overall<br />
ELS:2002 logistic regression model percentage accuracy<br />
<strong>in</strong>creased from 69.65 percent for the <strong>in</strong>tercept-only model<br />
to 77.12 percent for the fully specified model. For the<br />
BPS:04/09 model, the percentage accuracy <strong>in</strong>creased<br />
from 53.17 percent for the <strong>in</strong>tercept-only model to 75.47<br />
percent for the fully specified model. The diagnostic<br />
results <strong>in</strong>dicated adequate global fit of both regression<br />
models.<br />
Odds ratios are calculated for each of the categorical<br />
<strong>in</strong>dependent variables used <strong>in</strong> the regression models <strong>and</strong><br />
represent the likelihood of students <strong>in</strong> one category of an<br />
<strong>in</strong>dependent variable (referred to as the identity group)<br />
complet<strong>in</strong>g an event relative to a reference group. If the<br />
event is equally likely to occur for both groups, then the<br />
odds ratio value equals one. If a category has an odds<br />
ratio that is less than one, then students <strong>in</strong> the identity<br />
group have lower odds of immediate postsecondary<br />
enrollment than students <strong>in</strong> the reference group. For<br />
1<br />
A “stopout” is def<strong>in</strong>ed as a temporary withdrawal of 5 or more consecutive months<br />
from enrollment at a postsecondary <strong>in</strong>stitution.<br />
example, the odds ratio of 0.65 for males (table ELS-2)<br />
is the ratio of the odds of males immediately enroll<strong>in</strong>g <strong>in</strong><br />
postsecondary education after high school to the odds of<br />
females immediately enroll<strong>in</strong>g, after account<strong>in</strong>g for the<br />
effect of all of the other predictor variables <strong>in</strong> the model.<br />
The odds ratio of 0.65 <strong>in</strong>dicates that the odds of a male<br />
immediately enroll<strong>in</strong>g <strong>in</strong> postsecondary education after<br />
high school graduation are 35 percent lower [computed<br />
as ((odds ratio – 1) × 100) = ((0.65 – 1) * 100)] than the<br />
odds for a female (i.e., males are less likely than females to<br />
immediately enroll <strong>in</strong> postsecondary education). In this<br />
example, females are the reference group for the predictor<br />
variable. If a group category has an odds ratio greater than<br />
one, then students <strong>in</strong> the identity group are more likely to<br />
exhibit a certa<strong>in</strong> outcome than students <strong>in</strong> the reference<br />
group. For example, the odds ratio of 1.63 for students<br />
who first enrolled <strong>in</strong> a 4-year postsecondary <strong>in</strong>stitution<br />
(table BPS-2) <strong>in</strong>dicates that such a student has 63 percent<br />
higher odds of atta<strong>in</strong><strong>in</strong>g a degree with<strong>in</strong> 6 years than a<br />
student who first enrolled <strong>in</strong> a less-than-4-year <strong>in</strong>stitution.<br />
For cont<strong>in</strong>uous predictor variables, such as st<strong>and</strong>ardized<br />
test scores or number of postsecondary <strong>in</strong>stitution<br />
transfers, results are also <strong>in</strong>terpreted <strong>in</strong> the form of odds<br />
ratios based on one unit of change <strong>in</strong> the <strong>in</strong>dependent<br />
variable. For example, <strong>in</strong> table ELS-2, the odds ratio of<br />
1.88 for 9th-grade GPA <strong>in</strong>dicates that a one-po<strong>in</strong>t <strong>in</strong>crease<br />
<strong>in</strong> a student’s 9th-grade GPA value (e.g., from a 2.0 to a<br />
3.0) is associated with an 88 percent <strong>in</strong>crease <strong>in</strong> the odds<br />
of the student immediately enroll<strong>in</strong>g <strong>in</strong> postsecondary<br />
education. Asterisks (*) are used <strong>in</strong> the chapter tables to<br />
denote f<strong>in</strong>d<strong>in</strong>gs that are statistically significant at the .05<br />
level.<br />
Imputation procedures for ELS:2002<br />
data<br />
Prior to conduct<strong>in</strong>g logistic regression analyses with the<br />
ELS:2002 data, sequential regression multiple imputation<br />
(SRMI) was used to impute miss<strong>in</strong>g values for the subset<br />
of variables that were planned for <strong>in</strong>clusion <strong>in</strong> the analysis.<br />
This method was implemented <strong>in</strong> IVEware: Imputation<br />
<strong>and</strong> Variance Estimation Software®. Research Triangle<br />
Institute conducted the imputation procedures <strong>and</strong><br />
prepared the technical documentation for the analysis.<br />
This section provides justification for us<strong>in</strong>g the SRMI<br />
imputation method <strong>and</strong> details about the steps taken to<br />
conduct imputation procedures for the purposes of this<br />
report. More <strong>in</strong>formation about the SRMI procedure can<br />
be found <strong>in</strong> Raghunathan et al. (2001).<br />
The SRMI methodology provides two ma<strong>in</strong> advantages.<br />
The first is that it can be used to impute miss<strong>in</strong>g values<br />
for many types of variables—that is, categorical (b<strong>in</strong>ary<br />
<strong>and</strong> nom<strong>in</strong>al), cont<strong>in</strong>uous, count, <strong>and</strong> mixed 2 —so<br />
that imputations are tailored to the specific type of<br />
variable that is be<strong>in</strong>g imputed. Categorical variables are<br />
imputed us<strong>in</strong>g logistic regression for b<strong>in</strong>ary variables<br />
2<br />
A mixed variable is a cont<strong>in</strong>uous variable with a significant number of observations<br />
hav<strong>in</strong>g a zero value. If one looked at a density plot of a mixed variable, there would be<br />
a spike at zero with the rest of the distribution tak<strong>in</strong>g on any number of shapes (e.g.,<br />
approximately normal, skewed).<br />
280 <strong>Gaps</strong> <strong>in</strong> <strong>Access</strong> <strong>and</strong> <strong>Persistence</strong> <strong>Study</strong>
<strong>and</strong> polychotomous regression for nom<strong>in</strong>al variables.<br />
Cont<strong>in</strong>uous variables are imputed us<strong>in</strong>g l<strong>in</strong>ear regression.<br />
Count variables are imputed us<strong>in</strong>g Poisson regression.<br />
Mixed variables are imputed us<strong>in</strong>g a two-stage process:<br />
the first stage imputes a b<strong>in</strong>ary value, <strong>and</strong> the second stage<br />
imputes a cont<strong>in</strong>uous value for the first-stage imputed<br />
values that were imputed as a value of one. For each of<br />
these types of models, one can also <strong>in</strong>clude restrictions<br />
on observations that will receive an imputed value <strong>and</strong><br />
bounds on the range of imputed values. The second<br />
advantage of the SRMI methodology is that it can use all<br />
of the available <strong>in</strong>formation <strong>in</strong> a dataset to impute each<br />
variable. That is, it takes advantage of all the variables<br />
<strong>in</strong> a dataset to produce the most <strong>in</strong>formed <strong>and</strong> realistic<br />
imputed values. It can iterate through the variables <strong>in</strong> the<br />
dataset several times to re<strong>in</strong>force the relationships among<br />
variables <strong>and</strong> improve the imputed values.<br />
As a prelim<strong>in</strong>ary step, about 80 ELS:2002 variables<br />
were selected for imputation procedures. The variables<br />
selected <strong>in</strong>cluded potential dependent <strong>and</strong> <strong>in</strong>dependent<br />
variables planned for the logistic regression model, as<br />
well as covariates that were not part of the model but<br />
were thought to be related to the variables with miss<strong>in</strong>g<br />
values. The 80 variables were assigned an appropriate<br />
“miss<strong>in</strong>g” code to be used <strong>in</strong> the imputation software<br />
so the software would recognize the data as miss<strong>in</strong>g<br />
<strong>and</strong> require imputation. Next, the variable type (i.e.,<br />
categorical, cont<strong>in</strong>uous, count, or mixed) was identified<br />
for each variable. Lastly, bounds were set on the imputed<br />
values to identify the range of the valid responses for<br />
each variable. After these steps were completed, the<br />
data were ready for imputation. Fifty-five variables that<br />
were orig<strong>in</strong>ally planned for use <strong>in</strong> the ELS:2002 logistic<br />
regression analysis required imputation. The percentage<br />
of miss<strong>in</strong>g values for these variables ranged from 0.02 to<br />
33.64 percent (see exhibit A).<br />
Appendix A<br />
Appendix A 281
Exhibit A. ELS:2002 variables requir<strong>in</strong>g imputation<br />
Variable<br />
name Variable label Type Count Skip Valid Miss<strong>in</strong>g<br />
Miss<strong>in</strong>g<br />
(%)<br />
Response<br />
(%)<br />
F2B01 Ever applied to postsecondary school Categorical 15,689 1,650 14,036 3 0.02 99.98<br />
F2A02 Type of high school credential Categorical 15,689 12,878 2,808 3 0.11 99.89<br />
received—diploma/certificate/GED<br />
F2PSEND Last period of postsecondary Categorical 15,689 5,155 10,513 21 0.20 99.80<br />
education (i.e., persistence)<br />
F2PSSTRT When started postsecondary Categorical 15,689 5,155 10,513 21 0.20 99.80<br />
education<br />
F2PS1FTP Enrollment <strong>in</strong>tensity at first Categorical 15,689 5,155 10,511 23 0.22 99.78<br />
postsecondary <strong>in</strong>stitution<br />
F2B22 Major declared/undeclared Categorical 15,689 7,114 8,551 24 0.28 99.72<br />
F2B18A Talk with faculty about academic Categorical 15,689 5,155 10,500 34 0.32 99.68<br />
matters outside of class<br />
F2B18B Meet with advisor about academic Categorical 15,689 5,155 10,492 42 0.40 99.60<br />
plans<br />
F1S15 Diploma or certificate most likely to Categorical 15,689 1,506 14,119 64 0.45 99.55<br />
receive<br />
F2B18G Participate <strong>in</strong> other extracurricular Categorical 15,689 5,155 10,480 54 0.51 99.49<br />
activities<br />
F2PS1REM Took math/writ<strong>in</strong>g/read<strong>in</strong>g remedial Categorical 15,689 1,542 14,072 75 0.53 99.47<br />
course at 1st postsec <strong>in</strong>stitution<br />
F2B18E Participate <strong>in</strong> <strong>in</strong>tramural or<br />
Categorical 15,689 5,155 10,471 63 0.60 99.40<br />
nonvarsity sports<br />
F2B18F Participate <strong>in</strong> varsity or <strong>in</strong>tercollegiate Categorical 15,689 5,155 10,470 64 0.61 99.39<br />
sports<br />
F1S14 Grade level (at first follow-up) Categorical 15,689 2,064 13,541 84 0.62 99.38<br />
F1S21C Took or plans to take SAT or ACT Categorical 15,689 2,064 13,447 178 1.31 98.69<br />
F1S65A How many friends dropped out of Count 15,689 826 14,634 229 1.54 98.46<br />
high school<br />
BYS37 Importance of good grades to student Categorical 15,689 884 14,545 260 1.76 98.24<br />
BYXTRACU Number of school-sponsored Count 15,689 884 14,526 279 1.88 98.12<br />
activities participated <strong>in</strong> 01–02<br />
F1WRKHRS F1 hours worked per week dur<strong>in</strong>g Mixed 15,689 826 14,566 297 2.00 98.00<br />
03–04 school year<br />
F1S65D How many friends plan to attend Count 15,689 826 14,557 306 2.06 97.94<br />
4-year college/university<br />
F1S65B How many friends plan to have fulltime<br />
Count 15,689 826 14,548 315 2.12 97.88<br />
job after high school<br />
F2B29A No longer enrolled due to completion Categorical 15,689 13,730 1,917 42 2.14 97.86<br />
of degree/certificate<br />
F2C31P Hours worked weekly dur<strong>in</strong>g 2005– Cont<strong>in</strong>uous 15,689 8,930 6,602 157 2.32 97.68<br />
2006 school year—categorical<br />
F1S65C How many friends plan to attend Count 15,689 826 14,501 362 2.44 97.56<br />
2-year community college or technical<br />
school<br />
F1RGP9 GPA for all 9th-grade courses Cont<strong>in</strong>uous 15,689 1,294 13,995 400 2.78 97.22<br />
F2C26P Hours worked weekly dur<strong>in</strong>g 2004– Cont<strong>in</strong>uous 15,689 8,938 6,515 236 3.50 96.50<br />
2005 school year—categorical<br />
BYS28 How much likes school Categorical 15,689 884 14,277 528 3.57 96.43<br />
See notes at end of exhibit.<br />
282 <strong>Gaps</strong> <strong>in</strong> <strong>Access</strong> <strong>and</strong> <strong>Persistence</strong> <strong>Study</strong>
Exhibit A. ELS:2002 variables requir<strong>in</strong>g imputation—Cont<strong>in</strong>ued<br />
Variable<br />
name Variable label Type Count Skip Valid Miss<strong>in</strong>g<br />
BYS57 Plans to cont<strong>in</strong>ue education after high<br />
school<br />
Miss<strong>in</strong>g<br />
(%)<br />
Response<br />
(%)<br />
Categorical 15,689 1,843 13,226 620 4.48 95.52<br />
BYS24B How many times cut/skip classes Count 15,689 884 14,039 766 5.17 94.83<br />
BYNSPORT BY number of <strong>in</strong>terscholastic sports Count 15,689 884 13,945 860 5.81 94.19<br />
participated <strong>in</strong> at V or JV level<br />
BYS33H Ever <strong>in</strong> dropout prevention program Categorical 15,689 884 13,935 870 5.88 94.12<br />
BYS33L Ever <strong>in</strong> program to help prepare for Categorical 15,689 884 13,911 894 6.04 93.96<br />
college<br />
BYS33I Ever <strong>in</strong> special education program Categorical 15,689 884 13,907 898 6.07 93.93<br />
BYS33K Ever <strong>in</strong> career academy Categorical 15,689 884 13,866 939 6.34 93.66<br />
BYS26 High school program-student selfreport<br />
Categorical 15,689 884 13,857 948 6.40 93.60<br />
BYS33G Ever <strong>in</strong> English as a Second Language Categorical 15,689 884 13,844 961 6.49 93.51<br />
program<br />
BYS33D Ever <strong>in</strong> a remedial English class Categorical 15,689 884 13,720 1,085 7.33 92.67<br />
BYS33E Ever <strong>in</strong> a remedial math class Categorical 15,689 884 13,685 1,120 7.57 92.44<br />
BYP46 10th-grader ever held back a grade Categorical 15,689 2,491 12,178 1,020 7.73 92.27<br />
BYS58 Type of school plans to attend Categorical 15,689 2,212 12,345 1,132 8.40 91.60<br />
F1SARACE Individual race variables Categorical 15,689 0 14,304 1,385 8.83 91.17<br />
F2HSATTM High school atta<strong>in</strong>ment <strong>in</strong>dicator Categorical 15,689 0 14,270 1,419 9.04 90.96<br />
(academic risk)<br />
BYS59A Has gone to counselor for college Categorical 15,689 2,212 12,220 1,257 9.33 90.67<br />
entrance <strong>in</strong>formation<br />
BYS59B Has gone to teacher for college Categorical 15,689 2,212 12,220 1,257 9.33 90.67<br />
entrance <strong>in</strong>formation<br />
BYS59C Has gone to coach for college Categorical 15,689 2,212 12,220 1,257 9.33 90.67<br />
entrance <strong>in</strong>formation<br />
BYP09 Number of sibl<strong>in</strong>gs who dropped out Count 15,689 3,233 11,208 1,248 10.02 89.98<br />
of high school<br />
BYS56 How far <strong>in</strong> school student th<strong>in</strong>ks will Categorical 15,689 884 13,096 1,709 11.54 88.46<br />
get<br />
F1RGPA Transcript reported cumulative GPA Cont<strong>in</strong>uous 15,689 1,294 12,550 1,845 12.82 87.18<br />
BYS86A How often discussed school courses Categorical 15,689 884 12,248 2,557 17.27 82.73<br />
with parents<br />
BYS86B How often discussed school activities Categorical 15,689 884 12,224 2,581 17.43 82.57<br />
with parents<br />
BYS86G How often discussed go<strong>in</strong>g to college Categorical 15,689 884 12,097 2,708 18.29 81.71<br />
with parents<br />
BYS75 How many hours usually works a Cont<strong>in</strong>uous 15,689 6,151 6,827 2,711 28.42 71.58<br />
week<br />
BYS90F Important to friends to f<strong>in</strong>ish high Categorical 15,689 884 10,334 4,471 30.20 69.80<br />
school<br />
BYS90H Important to friends to cont<strong>in</strong>ue Categorical 15,689 884 10,272 4,533 30.62 69.38<br />
education past high school<br />
BYS91 Number of close friends who dropped<br />
out<br />
Categorical 15,689 884 9,824 4,981 33.64 66.36<br />
NOTE: Count identifies the total number of observations. Skip identifies the number of observations that were legitimate skips. Valid<br />
<strong>in</strong>dicates the number of valid responses. Miss<strong>in</strong>g <strong>in</strong>dicates the number of miss<strong>in</strong>g responses. Miss<strong>in</strong>g (%) is the number of miss<strong>in</strong>g<br />
observations divided by the number of valid <strong>and</strong> miss<strong>in</strong>g observations. Response (%) is the number of valid responses divided by the<br />
number of valid <strong>and</strong> miss<strong>in</strong>g observations.<br />
SOURCE: U.S. Department of <strong>Education</strong>, National Center for <strong>Education</strong> Statistics, <strong>Education</strong> Longitud<strong>in</strong>al <strong>Study</strong> of 2002<br />
(ELS:2002), “Second Follow-up, 2006.”<br />
Appendix A<br />
Appendix A 283
SRMI was conducted <strong>in</strong>dependently for each of the five<br />
imputed datasets that were created for this project. Below<br />
is a brief description of the methodology used for creat<strong>in</strong>g<br />
each dataset.<br />
Let X be the matrix of variables that have no miss<strong>in</strong>g<br />
values. Also, let there be m variables with miss<strong>in</strong>g values<br />
ordered from the variable with the lowest percentage<br />
of miss<strong>in</strong>g values to the variable with the highest<br />
percentage of miss<strong>in</strong>g values. These variables are denoted<br />
by the vectors y 1<br />
, y 2<br />
, …, y m<br />
. There were five iterations<br />
of imputations with<strong>in</strong> each of the five imputed datasets.<br />
In the first iteration, y 1<br />
was regressed on X for the<br />
observations that had a valid value for y 1<br />
. The <strong>in</strong>formation<br />
produced from this regression was used to impute for<br />
the miss<strong>in</strong>g values of y 1<br />
to create y 1<br />
* ( y 1<br />
* <strong>in</strong>dicates that<br />
the y 1<br />
vector <strong>in</strong>cluded the imputed values). Next, y 2<br />
was<br />
regressed on X <strong>and</strong> y 1<br />
* <strong>and</strong> the <strong>in</strong>formation from this<br />
regression was used to impute the miss<strong>in</strong>g values of y 2<br />
(thus creat<strong>in</strong>g y 2<br />
*). This process cont<strong>in</strong>ued until y m<br />
was<br />
regressed on X, y 1<br />
*, …, y m-1<br />
*, <strong>and</strong> the miss<strong>in</strong>g values for<br />
y m<br />
were imputed, creat<strong>in</strong>g y m<br />
*. This completed the first<br />
iteration.<br />
For the second through fifth rounds of imputation, the<br />
same general process was followed except that every<br />
variable (<strong>in</strong>clud<strong>in</strong>g the imputed values for the imputed<br />
variables) other than the variable be<strong>in</strong>g imputed was used<br />
<strong>in</strong> the regression. For the variable requir<strong>in</strong>g imputation,<br />
the orig<strong>in</strong>al variable (<strong>in</strong>clud<strong>in</strong>g the miss<strong>in</strong>g values) is<br />
modeled. For example, to impute y i<br />
(the orig<strong>in</strong>al variable<br />
with miss<strong>in</strong>g values) <strong>in</strong> the second iteration, we regressed<br />
y i<br />
on X, y 1<br />
*, …, y i-1<br />
*, y i+1<br />
*, …, y m<br />
*, us<strong>in</strong>g the imputed<br />
values, y 1<br />
*, …, y i-1<br />
*, y i+1<br />
*, …, y m<br />
*, from the first iteration.<br />
For the third iteration, we regressed y i<br />
on X <strong>and</strong> the<br />
imputed values from the second round of imputation. For<br />
the fourth iteration, we regressed y i<br />
on X <strong>and</strong> the imputed<br />
values from the third round of imputation. F<strong>in</strong>ally, for<br />
the fifth iteration, we regressed y i<br />
on X <strong>and</strong> the imputed<br />
values from the fourth round of imputation. After the<br />
fifth iteration was completed, the imputed values, y 1<br />
*, …,<br />
y m<br />
*, from the fifth round of imputation were reta<strong>in</strong>ed for<br />
each of the five imputed datasets.<br />
Apply<strong>in</strong>g this methodology to the ELS:2002 dataset,<br />
IVEware was used to produce five files that <strong>in</strong>cluded<br />
the 55 variables selected for imputation <strong>and</strong> the other<br />
25 variables that did not require imputation. Once the<br />
imputation procedures were completed, quality checks<br />
were performed to ensure that the imputed data had the<br />
same format as the orig<strong>in</strong>al data. In addition, quality<br />
checks were developed specifically for both categorical<br />
<strong>and</strong> cont<strong>in</strong>uous variables. Distributions before <strong>and</strong> after<br />
imputation were visually reviewed to assess whether<br />
the imputed values were reasonable <strong>and</strong> to identify<br />
any significant deviations between the distributions.<br />
Furthermore, numeric checks were based on the<br />
percentages of each category for the categorical variables<br />
<strong>and</strong> on the quantiles represented by the m<strong>in</strong>imum value,<br />
deciles, <strong>and</strong> maximum value for cont<strong>in</strong>uous variables.<br />
Large deviations <strong>in</strong> the relative proportions of imputed<br />
<strong>and</strong> unimputed values with<strong>in</strong> categories or deviations<br />
for the imputed <strong>and</strong> unimputed densities for cont<strong>in</strong>uous<br />
variables would <strong>in</strong>dicate a variable that should be<br />
<strong>in</strong>vestigated. The quality control checks did not detect any<br />
concerns with the imputation procedures.<br />
One consideration <strong>in</strong> us<strong>in</strong>g SRMI is that it assumes that<br />
the dataset was generated from a simple r<strong>and</strong>om sample<br />
design. However, most complex survey designs <strong>in</strong>volve<br />
stratification, cluster<strong>in</strong>g, <strong>and</strong> differential weight<strong>in</strong>g.<br />
To account for this consideration, the survey design<br />
<strong>in</strong>formation—i.e., stratum <strong>and</strong> cluster (school)—<strong>and</strong> a<br />
weight were used <strong>in</strong> the imputation models.<br />
Glossary of variables used <strong>in</strong> regression<br />
analyses<br />
ELS:2002 variables<br />
When started postsecondary education (F2PSSTRT).<br />
First period of attendance at the student’s first attended<br />
postsecondary <strong>in</strong>stitution. For the logistic regression<br />
analysis, students were grouped <strong>in</strong>to two categories:<br />
“immediate postsecondary enrollment” if they enrolled <strong>in</strong><br />
their first “real” postsecondary <strong>in</strong>stitution by December<br />
2004 <strong>and</strong> “no postsecondary enrollment” if they either<br />
enrolled <strong>in</strong> their first “real” postsecondary <strong>in</strong>stitution after<br />
December 2004 or they had no postsecondary enrollment<br />
through 2006.<br />
First follow-up sex composite (F1SEX). For base-year<br />
students, this variable was constructed from the base-year<br />
student questionnaire or, where miss<strong>in</strong>g, from (<strong>in</strong> order of<br />
preference) the school roster or logical imputation based<br />
on first name.<br />
First follow-up student’s race/ethnicity composite<br />
(restricted) (F1RACE_R). This race/ethnicity variable<br />
<strong>in</strong>cludes seven categories: (1) American Indian or Alaska<br />
Native; (2) Asian or Pacific Isl<strong>and</strong>er, <strong>in</strong>clud<strong>in</strong>g Native<br />
Hawaiian; (3) Black or African American; (4) Hispanic,<br />
no race specified; (5) Hispanic, race specified; (6) more<br />
than one race; <strong>and</strong> (7) White. Categories 1, 2, 3, 6,<br />
<strong>and</strong> 7 exclude <strong>in</strong>dividuals of Hispanic or Lat<strong>in</strong>o orig<strong>in</strong>.<br />
For presentation <strong>in</strong> this report, categories 4 <strong>and</strong> 5 are<br />
comb<strong>in</strong>ed <strong>in</strong>to “Hispanic or Lat<strong>in</strong>o.” The ELS:2002<br />
race variables reflect new federal st<strong>and</strong>ards that require<br />
collect<strong>in</strong>g race separately from ethnicity <strong>and</strong> allow<br />
students to mark more than one choice for race. For<br />
base-year students, <strong>in</strong>formation on race/ethnicity was<br />
obta<strong>in</strong>ed from the base-year student questionnaire when<br />
available or (<strong>in</strong> order of preference) from the sampl<strong>in</strong>g<br />
roster, the parent questionnaire (if the parent respondent<br />
was a biological parent), or logical imputation based on<br />
other questionnaire items (e.g., surname, native language).<br />
For the logistic regression analysis, results for “American<br />
Indian or Alaska Native,” “Native Hawaiian/other Pacific<br />
Isl<strong>and</strong>er,” <strong>and</strong> “Other” were collapsed <strong>in</strong>to a s<strong>in</strong>gle “Other<br />
race” category due to small sample sizes.<br />
284 <strong>Gaps</strong> <strong>in</strong> <strong>Access</strong> <strong>and</strong> <strong>Persistence</strong> <strong>Study</strong>
First follow-up socioeconomic status composite,<br />
F1SES2. F1SES2 is a composite variable constructed<br />
from parent questionnaire data, when available, <strong>and</strong> from<br />
imputation or student substitutions, when not. SES is<br />
based on five equally weighted, st<strong>and</strong>ardized components:<br />
father’s/guardian’s education (F1FATHED), mother’s/<br />
guardian’s education (F1MOTHED), family <strong>in</strong>come<br />
(BYINCOME), father’s/guardian’s occupational prestige<br />
score (from F1OCCUFATH), <strong>and</strong> mother’s/guardian’s<br />
occupational prestige score (from F1OCCUMOTH).<br />
Father’s <strong>and</strong> mother’s education were based on parent<br />
reports when available; otherwise, on student reports. If<br />
still miss<strong>in</strong>g, they were imputed. Income was based on<br />
parent questionnaire <strong>in</strong>formation or imputed otherwise.<br />
The parent questionnaire was the preferred source of data<br />
for mother’s <strong>and</strong> father’s occupation. In the absence of<br />
parent questionnaire occupation data, student-supplied<br />
parent occupation <strong>in</strong>formation from the base year (for<br />
base-year respondents) was coded by project staff, if<br />
possible. Miss<strong>in</strong>g occupations were imputed.<br />
First follow-up family composition (F1FCOMP). This<br />
variable <strong>in</strong>dicates the student’s family composition <strong>and</strong><br />
was constructed us<strong>in</strong>g the reports of parents <strong>in</strong> 2002. It<br />
was coded <strong>in</strong>to four categories: mother <strong>and</strong> father, mother<br />
or father <strong>and</strong> guardian, s<strong>in</strong>gle parent (mother or father),<br />
<strong>and</strong> other. For the logistic regression analysis, students<br />
were grouped <strong>in</strong>to two categories: “two-parent/guardian<br />
household” <strong>and</strong> “s<strong>in</strong>gle-parent/guardian household.”<br />
Base-year mathematics st<strong>and</strong>ardized score<br />
(BYTXMSTD). The st<strong>and</strong>ardized T score provides a<br />
norm-referenced measurement of achievement: that is, an<br />
estimate of achievement relative to the population (spr<strong>in</strong>g<br />
2002 10th-graders) as a whole. It provides <strong>in</strong>formation<br />
on status compared to peers (as dist<strong>in</strong>guished from an<br />
IRT-estimated number-right score, which represents status<br />
with respect to achievement on a particular criterion set<br />
of test items). The transformation to a familiar metric<br />
with a mean of 50 <strong>and</strong> st<strong>and</strong>ard deviation of 10 facilitates<br />
comparisons <strong>in</strong> st<strong>and</strong>ard deviation units.<br />
GPA for all 9th-grade courses (F1RGP9). Students’<br />
9th-grade GPA was taken from high school transcript data<br />
<strong>and</strong> represents the GPA for all 9th-grade courses, based on<br />
a four-po<strong>in</strong>t scale (A = 4.0; F = 0.0).<br />
10th-grader ever held back a grade (BYP46). This<br />
variable, taken directly from the parent questionnaire,<br />
<strong>in</strong>dicates parents’ response to the question, “Was your<br />
tenth-grader ever held back a grade <strong>in</strong> school?”<br />
Base-year number of <strong>in</strong>terscholastic sports<br />
participated <strong>in</strong> at varsity or junior varsity level<br />
(BYNSPORT). This variable is constructed based on<br />
a set of eight <strong>in</strong>terscholastic sports <strong>and</strong> <strong>in</strong>dicates the<br />
number of these sports that the student participated<br />
<strong>in</strong> dur<strong>in</strong>g the 2001–02 school year, regardless of the<br />
level of participation (junior varsity or varsity). The<br />
eight sports used as <strong>in</strong>puts for this variable are baseball,<br />
softball, basketball, football, soccer, “other <strong>in</strong>terscholastic<br />
team sport,” “<strong>in</strong>dividual <strong>in</strong>terscholastic team sport,”<br />
<strong>and</strong> cheerlead<strong>in</strong>g/drill team. For the logistic regression<br />
analysis, students were grouped <strong>in</strong>to two categories:<br />
“participated <strong>in</strong> sports” <strong>and</strong> “did not participate <strong>in</strong><br />
sports.”<br />
Number of school-sponsored activities participated<br />
<strong>in</strong> dur<strong>in</strong>g 2001–02 (BYXTRACU). This variable is<br />
constructed based on a set of n<strong>in</strong>e school-sponsored<br />
activities <strong>and</strong> <strong>in</strong>dicates the number of these activities that<br />
the student participated <strong>in</strong> dur<strong>in</strong>g the 2001–02 school<br />
year. The n<strong>in</strong>e school-sponsored activities used as <strong>in</strong>puts<br />
for this variable are school b<strong>and</strong>/chorus, a school play or<br />
musical, student government, academic honor society,<br />
school yearbook or newspaper, school service clubs, school<br />
academic clubs, school hobby clubs, <strong>and</strong> school vocational<br />
clubs. For the logistic regression analysis, students<br />
were grouped <strong>in</strong>to three categories: “no extracurricular<br />
activities,” “one extracurricular activity,” <strong>and</strong> “two or<br />
more extracurricular activities.”<br />
How many times absent from school (BYS24C). This<br />
variable, taken directly from the student questionnaire,<br />
<strong>in</strong>dicates how many times the student was absent from<br />
school <strong>in</strong> the first semester or term of the school year:<br />
“never,” “1–2 times,” “3–6 times,” “7–9 times,” or “10<br />
or more times.” For the logistic regression analyses, the<br />
responses were collapsed <strong>in</strong>to three categories: “absent 0–2<br />
times,” “absent 3–6 times,” <strong>and</strong> “absent 7 or more times.”<br />
How many times cut/skip classes (BYS24B). This<br />
variable, taken directly from the student questionnaire,<br />
<strong>in</strong>dicates how many times the student cut or skipped class<br />
<strong>in</strong> the first semester or term of the school year: “never,”<br />
“1–2 times,” “3–6 times,” “7–9 times,” or “10 or more<br />
times.” For the logistic regression analysis, the responses<br />
were collapsed <strong>in</strong>to two categories: “never skipped class”<br />
<strong>and</strong> “skipped class at least once.”<br />
How often discussed school courses with parents<br />
(BYS86A). This variable <strong>in</strong>dicates students’ response to<br />
the survey question, “In the first semester or term of this<br />
school year, how often have you discussed the follow<strong>in</strong>g<br />
with either or both of your parents or guardians?<br />
a. Select<strong>in</strong>g courses or programs at school.” Response<br />
options were “never,” “sometimes,” <strong>and</strong> “often.” For the<br />
logistic regression analysis, all three response options were<br />
<strong>in</strong>cluded.<br />
How many hours usually works a week (BYS75).<br />
This student questionnaire variable is top-coded at 41<br />
hours or more. All students who had ever worked for<br />
pay were <strong>in</strong>structed to report the number of hours they<br />
usually work/worked each week. Variable is based on<br />
BYS72 (“Have you ever worked for pay/are you currently<br />
employed?”) <strong>and</strong> BYS75 (“How many hours do/did you<br />
work each week on your current or most recent job?”). For<br />
the logistic regression analysis, the data were collapsed<br />
<strong>in</strong>to “no hours,” “1 to 20 hours per week,” <strong>and</strong> “more than<br />
20 hours per week.”<br />
Appendix A<br />
Appendix A 285
Number of close friends who dropped out (BYS91).<br />
This variable <strong>in</strong>dicates students’ response to the survey<br />
question, “Altogether, how many of your close friends<br />
have dropped out of school before graduat<strong>in</strong>g? (Do not<br />
<strong>in</strong>clude those who have transferred to another school.).”<br />
Response options <strong>in</strong>clude “none,” “some,” “most,” or<br />
“all of them.” For the logistic regression analysis, the<br />
categories were collapsed <strong>in</strong>to “no friends dropped out<br />
of high school” <strong>and</strong> “one or more friends dropped out of<br />
high school.”<br />
BPS:04/09 variables<br />
Atta<strong>in</strong>ment or level of last <strong>in</strong>stitution enrolled <strong>in</strong><br />
through 2009 (PRLVL6Y). Indicates the highest<br />
degree atta<strong>in</strong>ed or, if no degree was atta<strong>in</strong>ed, the level<br />
of the <strong>in</strong>stitution where the student was enrolled <strong>in</strong><br />
the spr<strong>in</strong>g of 2009. Response options for this variable<br />
<strong>in</strong>clude “atta<strong>in</strong>ed bachelor’s degree,” “atta<strong>in</strong>ed associate’s<br />
degree,” “atta<strong>in</strong>ed certificate,” “no degree, enrolled at<br />
4-year,” “no degree, enrolled at less-than-4-year,” <strong>and</strong><br />
“no degree, not enrolled.” For the logistic regression<br />
analysis, the categories “atta<strong>in</strong>ed bachelor’s degree” <strong>and</strong><br />
“atta<strong>in</strong>ed associate’s degree” were collapsed <strong>in</strong>to “atta<strong>in</strong>ed<br />
a degree with<strong>in</strong> 6 years of postsecondary enrollment”<br />
<strong>and</strong> the categories “no degree, enrolled at 4-year,” “no<br />
degree, enrolled at less-than-4-year,” <strong>and</strong> “no degree, not<br />
enrolled” were collapsed <strong>in</strong>to “did not atta<strong>in</strong> a degree<br />
with<strong>in</strong> 6 years of postsecondary enrollment.”<br />
Gender (GENDER). Indicates the student’s sex.<br />
Race/ethnicity (RACE). This race/ethnicity variable<br />
<strong>in</strong>cludes eight categories: (1) White; (2) Black or<br />
African American; (3) Hispanic or Lat<strong>in</strong>o; (4) Asian; (5)<br />
American Indian or Alaska Native; (6) Native Hawaiian/<br />
other Pacific Isl<strong>and</strong>er; (7) Other; <strong>and</strong> (8) more than one<br />
race. For the logistic regression analysis, the results for<br />
“American Indian or Alaska Native,” “Native Hawaiian/<br />
other Pacific Isl<strong>and</strong>er,” “Other,” <strong>and</strong> “more than one race”<br />
were collapsed <strong>in</strong>to a s<strong>in</strong>gle “Other race” category due to<br />
small sample sizes.<br />
Parent’s highest level of education (PAREDUC).<br />
Indicates the highest level of education of either parent<br />
of the student dur<strong>in</strong>g the 2003–04 academic year.<br />
Response options for this variable <strong>in</strong>clude “don’t know,”<br />
“did not complete high school,” “high school diploma or<br />
equivalent,” “vocational or technical tra<strong>in</strong><strong>in</strong>g,” “less than<br />
2 years of college,” “associate’s degree,” “2 or more years<br />
of college but no degree,” “bachelor’s degree,” “master’s<br />
degree or equivalent,” “first-professional degree,” <strong>and</strong><br />
“doctoral degree or equivalent.” For the logistic regression,<br />
cases with values of “don’t know” were dropped from the<br />
model; the “did not complete high school,” “high school<br />
diploma or equivalent,” <strong>and</strong> “vocational or technical<br />
tra<strong>in</strong><strong>in</strong>g” categories were collapsed <strong>in</strong>to a “HS diploma<br />
or less <strong>and</strong> vocational/technical tra<strong>in</strong><strong>in</strong>g” category; the<br />
“less than 2 years of college,” “associate’s degree,” <strong>and</strong> “2<br />
or more years of college but no degree” categories were<br />
collapsed <strong>in</strong>to a “some college, less than bachelor’s degree”<br />
category; <strong>and</strong> the “bachelor’s degree,” “master’s degree<br />
or equivalent,” “first-professional degree,” <strong>and</strong> “doctoral<br />
degree or equivalent” categories were collapsed <strong>in</strong>to a<br />
“bachelor’s or higher degree” category.<br />
Income quartile <strong>in</strong> 2003–04 (INCGRP). Indicates the<br />
<strong>in</strong>come group of the student, based on total <strong>in</strong>come <strong>in</strong><br />
2002 for <strong>in</strong>dependent students or parents of dependent<br />
students. Income groups were determ<strong>in</strong>ed separately for<br />
dependent <strong>and</strong> <strong>in</strong>dependent students based on percentile<br />
rank<strong>in</strong>gs <strong>and</strong> then comb<strong>in</strong>ed <strong>in</strong>to one variable.<br />
Highest level of high school mathematics (HCMATH).<br />
Indicates the highest level of mathematics that the<br />
student completed or planned to take, accord<strong>in</strong>g to<br />
self-report<strong>in</strong>g on the st<strong>and</strong>ardized test questionnaire<br />
<strong>and</strong> student <strong>in</strong>terview. Response options for this variable<br />
<strong>in</strong>clude “none of these,” “algebra II,” “trigonometry/<br />
algebra II,” “pre-calculus,” <strong>and</strong> “calculus.” For the logistic<br />
regression analysis, the “algebra II” <strong>and</strong> “trigonometry/<br />
algebra II” categories were collapsed <strong>in</strong>to an “algebra<br />
II/trigonometry” category, <strong>and</strong> the “pre-calculus” <strong>and</strong><br />
“calculus” categories were collapsed <strong>in</strong>to a “pre-calculus/<br />
calculus” category.<br />
Earned any college level credits <strong>in</strong> high school<br />
(CRDHS04). Indicates whether the student earned any<br />
college credits while he/she was <strong>in</strong> high school.<br />
SAT or ACT exams taken (TETOOK). Indicates<br />
whether the student took the SAT or ACT college<br />
entrance exam. A student is considered to have taken an<br />
exam if the agency or <strong>in</strong>stitution reports a test score or the<br />
student reports <strong>in</strong> the student <strong>in</strong>terview hav<strong>in</strong>g taken the<br />
test. Response options for this variable <strong>in</strong>clude “did not<br />
take SAT or ACT,” “took only the SAT,” “took only the<br />
ACT,” <strong>and</strong> “took both the SAT <strong>and</strong> ACT.” For the logistic<br />
regression analysis, the categories were collapsed <strong>in</strong>to a<br />
“did not take SAT or ACT” <strong>and</strong> “took an SAT or ACT.”<br />
First <strong>in</strong>stitution control 2003–04 (FCONTROL).<br />
Indicates the control of the first <strong>in</strong>stitution (public, private<br />
nonprofit, or private for-profit) that the student attended<br />
dur<strong>in</strong>g the 2003–04 academic year.<br />
First <strong>in</strong>stitution level 2003–04 (FLEVEL). Indicates<br />
the level of the first <strong>in</strong>stitution that the student attended<br />
dur<strong>in</strong>g the 2003–04 academic year. Response options for<br />
this variable <strong>in</strong>clude “4-year,” “2-year,” <strong>and</strong> “less-than-2-<br />
year.” For the logistic regression analysis, the “2-year” <strong>and</strong><br />
“less-than-2-year” categories were collapsed <strong>in</strong>to a “lessthan-4-year”<br />
category.<br />
Major dur<strong>in</strong>g first year 2003–04 (MAJORS). Student’s<br />
major or field of study dur<strong>in</strong>g the 2003–04 academic<br />
year. For the logistic regression analysis, responses were<br />
collapsed <strong>in</strong>to two categories: “no major declared” <strong>and</strong><br />
“major declared.”<br />
286 <strong>Gaps</strong> <strong>in</strong> <strong>Access</strong> <strong>and</strong> <strong>Persistence</strong> <strong>Study</strong>
Remedial course 2004: Any taken (REMETOOK).<br />
Indicates whether the student took any remedial or<br />
developmental courses dur<strong>in</strong>g the 2003–04 academic<br />
year.<br />
Frequency 2004: Meet academic advisor (FREQ04C).<br />
Indicates whether or how often the student met with an<br />
advisor concern<strong>in</strong>g academic plans dur<strong>in</strong>g the 2003–04<br />
academic year. For the logistic regression analysis, the<br />
“sometimes” <strong>and</strong> “often” categories were collapsed <strong>in</strong>to a<br />
s<strong>in</strong>gle “yes” category that <strong>in</strong>dicated participation.<br />
Frequency 2004: School clubs (FREQ04E). Indicates<br />
whether or how often the student participated <strong>in</strong> school<br />
clubs dur<strong>in</strong>g the 2003–04 academic year. For the logistic<br />
regression analysis, the “sometimes” <strong>and</strong> “often” categories<br />
were collapsed <strong>in</strong>to a s<strong>in</strong>gle “yes” category that <strong>in</strong>dicated<br />
participation.<br />
Frequency 2004: School sports (FREQ04F). Indicates<br />
whether or how often the student participated <strong>in</strong> varsity,<br />
<strong>in</strong>tramural, or club sports dur<strong>in</strong>g the 2003–04 academic<br />
year. For the logistic regression analysis, the “sometimes”<br />
<strong>and</strong> “often” categories were collapsed <strong>in</strong>to a s<strong>in</strong>gle “yes”<br />
category that <strong>in</strong>dicated participation.<br />
Job 2004: hours worked per week (<strong>in</strong>clud<strong>in</strong>g work<br />
study) (JOBHOUR2). Indicates the average hours the<br />
student worked per week. For the logistic regression<br />
analysis, this cont<strong>in</strong>uous variable was categorized <strong>in</strong>to<br />
three groups: “not work<strong>in</strong>g,” “work<strong>in</strong>g less than 20 hours<br />
a week,” <strong>and</strong> “work<strong>in</strong>g 20 or more hours a week.”<br />
Attendance <strong>in</strong>tensity pattern through 2009<br />
(ENINPT6Y). Pattern of enrollment <strong>in</strong>tensity for all<br />
months enrolled through June 2009. Response options for<br />
this variable <strong>in</strong>clude “always full-time,” “always parttime,”<br />
<strong>and</strong> “mixed.” For the logistic regression analysis,<br />
the “always part-time” <strong>and</strong> “mixed” categories were<br />
collapsed <strong>in</strong>to a “not full-time” category.<br />
Stopouts number anywhere through 2009<br />
(STNUM6Y). Number of stopouts at all <strong>in</strong>stitutions<br />
attended, as of June 2009. A stopout is def<strong>in</strong>ed as a<br />
temporary withdrawal of 5 or more consecutive months<br />
from enrollment at a postsecondary <strong>in</strong>stitution.<br />
Number of transfers as of June 2009 (TFNUM6Y).<br />
Number of transfers between <strong>in</strong>stitutions between entry<br />
to postsecondary education <strong>and</strong> June 2009.<br />
Appendix A<br />
Appendix A 287
Appendix B<br />
Guide to Sources<br />
288 <strong>Higher</strong> <strong>Education</strong>: <strong>Gaps</strong> <strong>in</strong> <strong>Access</strong> <strong>and</strong> <strong>Persistence</strong> <strong>Study</strong>
Appendix B: GUIDE TO SOURCES<br />
National Center for <strong>Education</strong> Statistics<br />
(NCES) Data Sources<br />
Beg<strong>in</strong>n<strong>in</strong>g Postsecondary Students<br />
Longitud<strong>in</strong>al <strong>Study</strong> (BPS)<br />
The Beg<strong>in</strong>n<strong>in</strong>g Postsecondary Students Longitud<strong>in</strong>al<br />
<strong>Study</strong> (BPS) provides <strong>in</strong>formation on persistence,<br />
progress, <strong>and</strong> atta<strong>in</strong>ment from <strong>in</strong>itial time of entry<br />
<strong>in</strong>to postsecondary education through completion <strong>and</strong><br />
entry <strong>in</strong>to the workforce. BPS <strong>in</strong>cludes traditional <strong>and</strong><br />
nontraditional (e.g., older) students <strong>and</strong> is representative<br />
of all beg<strong>in</strong>n<strong>in</strong>g students <strong>in</strong> postsecondary education<br />
<strong>in</strong> a given year. Initially, these <strong>in</strong>dividuals are surveyed<br />
<strong>in</strong> the National Postsecondary Student Aid <strong>Study</strong><br />
(NPSAS) dur<strong>in</strong>g the year <strong>in</strong> which they first beg<strong>in</strong><br />
their postsecondary education. These same students<br />
are surveyed aga<strong>in</strong> 2 <strong>and</strong> 5 years later through BPS.<br />
By start<strong>in</strong>g with a cohort that has already entered<br />
postsecondary education <strong>and</strong> follow<strong>in</strong>g it for 6 years,<br />
BPS can determ<strong>in</strong>e to what extent students who start<br />
postsecondary education at various ages differ <strong>in</strong> their<br />
progress, persistence, <strong>and</strong> atta<strong>in</strong>ment. The first BPS<br />
was conducted <strong>in</strong> 1989–90, with follow-ups <strong>in</strong> 1992<br />
<strong>and</strong> 1994. The second BPS was conducted <strong>in</strong> 1995–96,<br />
with follow-ups <strong>in</strong> 1998 <strong>and</strong> 2001. The third BPS was<br />
conducted <strong>in</strong> 2003–04, with follow-ups <strong>in</strong> 2006 <strong>and</strong><br />
2009. The fourth BPS is scheduled for 2012, with<br />
follow-ups <strong>in</strong> 2014 <strong>and</strong> 2017.<br />
Further <strong>in</strong>formation on BPS may be obta<strong>in</strong>ed from<br />
Aurora D’Amico<br />
Sarah Crissey<br />
Postsecondary, Adult, <strong>and</strong> Career <strong>Education</strong> Division<br />
Postsecondary Longitud<strong>in</strong>al <strong>and</strong> Sample Studies Program<br />
National Center for <strong>Education</strong> Statistics<br />
1990 K Street NW<br />
Wash<strong>in</strong>gton, DC 20006<br />
aurora.damico@ed.gov<br />
sarah.crissey@ed.gov<br />
http://nces.ed.gov/surveys/bps<br />
Common Core of Data (CCD)<br />
The Common Core of Data (CCD) is the Department<br />
of <strong>Education</strong>’s primary database on public elementary<br />
<strong>and</strong> secondary education <strong>in</strong> the United States. It is a<br />
comprehensive, annual, national statistical database of<br />
all public elementary <strong>and</strong> secondary schools <strong>and</strong> school<br />
districts conta<strong>in</strong><strong>in</strong>g data designed to be comparable across<br />
all states. This database can be used to select samples for<br />
other NCES surveys <strong>and</strong> provide basic <strong>in</strong>formation <strong>and</strong><br />
descriptive statistics on public elementary <strong>and</strong> secondary<br />
schools <strong>and</strong> school<strong>in</strong>g <strong>in</strong> general. Some of the CCD’s<br />
component surveys date back to the 1930s. The <strong>in</strong>tegrated<br />
CCD was first implemented <strong>in</strong> the 1986–87 school year.<br />
The CCD collects statistical <strong>in</strong>formation annually from<br />
approximately 100,000 public elementary <strong>and</strong> secondary<br />
schools <strong>and</strong> approximately 18,000 public school districts<br />
(<strong>in</strong>clud<strong>in</strong>g supervisory unions <strong>and</strong> regional education<br />
service agencies) <strong>in</strong> the 50 states, the District of<br />
Columbia, Department of Defense dependents schools<br />
(DoDDS), <strong>and</strong> the outly<strong>in</strong>g areas. Three categories of<br />
<strong>in</strong>formation are collected <strong>in</strong> the CCD survey: general<br />
descriptive <strong>in</strong>formation on schools <strong>and</strong> school districts;<br />
data on students <strong>and</strong> staff; <strong>and</strong> fiscal data. The general<br />
descriptive <strong>in</strong>formation <strong>in</strong>cludes name, address, phone<br />
number, <strong>and</strong> type of locale; the data on students <strong>and</strong> staff<br />
<strong>in</strong>clude selected demographic characteristics; <strong>and</strong> the<br />
fiscal data perta<strong>in</strong> to revenues <strong>and</strong> current expenditures.<br />
The EDFacts data collection system is the primary<br />
collection tool for the CCD. NCES works collaboratively<br />
with the Department of <strong>Education</strong>’s Performance<br />
Information Management Service to develop the CCD<br />
collection procedures <strong>and</strong> data def<strong>in</strong>itions. Even though<br />
the CCD is a universe collection <strong>and</strong> thus not subject to<br />
sampl<strong>in</strong>g errors, nonsampl<strong>in</strong>g errors can occur. The two<br />
potential sources of nonsampl<strong>in</strong>g errors are nonresponse<br />
<strong>and</strong> <strong>in</strong>accurate report<strong>in</strong>g. NCES attempts to m<strong>in</strong>imize<br />
nonsampl<strong>in</strong>g errors through the use of annual tra<strong>in</strong><strong>in</strong>g of<br />
SEA coord<strong>in</strong>ators, extensive quality reviews, <strong>and</strong> survey<br />
edit<strong>in</strong>g procedures. In addition, each year, SEAs are given<br />
the opportunity to revise their state-level aggregates from<br />
the previous survey cycle.<br />
Further <strong>in</strong>formation about the CCD <strong>and</strong> its survey<br />
components is available at http://www.nces.ed.gov/ccd/.<br />
Early Childhood Longitud<strong>in</strong>al <strong>Study</strong>,<br />
K<strong>in</strong>dergarten Class of 1998–99 (ECLS-K)<br />
The Early Childhood Longitud<strong>in</strong>al <strong>Study</strong>, K<strong>in</strong>dergarten<br />
Class of 1998–99 (ECLS-K) was designed to provide<br />
detailed <strong>in</strong>formation on children’s early school<br />
experiences. The study began <strong>in</strong> the fall of 1998. A<br />
nationally representative sample of 21,260 children<br />
enrolled <strong>in</strong> 940 k<strong>in</strong>dergarten programs dur<strong>in</strong>g the<br />
1998–99 school year was selected to participate <strong>in</strong> the<br />
ECLS-K. The children attended both public <strong>and</strong> private<br />
k<strong>in</strong>dergartens, <strong>and</strong> full-day <strong>and</strong> part-day programs. The<br />
sample <strong>in</strong>cluded children from different racial/ethnic<br />
<strong>and</strong> socioeconomic backgrounds <strong>and</strong> oversamples of<br />
Asian <strong>and</strong> Pacific Isl<strong>and</strong>er children <strong>and</strong> private school<br />
k<strong>in</strong>dergartners. Base-year data were collected <strong>in</strong> the fall<br />
<strong>and</strong> spr<strong>in</strong>g of the k<strong>in</strong>dergarten year. Data were collected<br />
aga<strong>in</strong> <strong>in</strong> the fall of 1st grade <strong>in</strong> 1999 (from a 30 percent<br />
subsample of schools) <strong>and</strong> the spr<strong>in</strong>g of 1st grade <strong>in</strong> 2000,<br />
<strong>and</strong> then <strong>in</strong> the spr<strong>in</strong>g of 3rd grade <strong>in</strong> 2002, the spr<strong>in</strong>g of<br />
5th grade <strong>in</strong> 2004, <strong>and</strong> the spr<strong>in</strong>g of 8th grade <strong>in</strong> 2007.<br />
Appendix B<br />
Appendix B: Guide to Sources 289
From k<strong>in</strong>dergarten to 5th grade, the ECLS-K <strong>in</strong>cluded a<br />
direct child cognitive assessment that was adm<strong>in</strong>istered<br />
one-on-one with each child <strong>in</strong> the study. The assessment<br />
used a computer-assisted personal <strong>in</strong>terview (CAPI)<br />
approach <strong>and</strong> a two-stage adaptive test<strong>in</strong>g methodology.<br />
In the 8th grade, a two-stage adaptive paper-<strong>and</strong>pencil<br />
assessment was adm<strong>in</strong>istered <strong>in</strong> small groups. At<br />
k<strong>in</strong>dergarten <strong>and</strong> 1st grade, the assessment <strong>in</strong>cluded three<br />
cognitive doma<strong>in</strong>s—read<strong>in</strong>g, mathematics, <strong>and</strong> general<br />
knowledge. General knowledge was replaced by science<br />
at the 3rd, 5th, <strong>and</strong> 8th grades. Children’s height <strong>and</strong><br />
weight were measured at each data collection po<strong>in</strong>t, <strong>and</strong><br />
a direct measure of children’s psychomotor development<br />
was adm<strong>in</strong>istered <strong>in</strong> the fall of the k<strong>in</strong>dergarten year only.<br />
In addition to these measures, the ECLS-K collected<br />
<strong>in</strong>formation about children’s social skills <strong>and</strong> academic<br />
achievement through teacher reports, <strong>and</strong> through student<br />
reports at the 3rd, 5th, <strong>and</strong> 8th grades.<br />
A computer-assisted telephone <strong>in</strong>terview with the<br />
children’s parents/guardians was conducted at each data<br />
collection po<strong>in</strong>t. Parents/guardians were asked to provide<br />
key <strong>in</strong>formation about the ECLS-K sample children<br />
on subjects such as family demographics (e.g., family<br />
members, age, relation to child, race/ethnicity), family<br />
structure (e.g., household members <strong>and</strong> composition),<br />
parent <strong>in</strong>volvement, home educational activities (e.g.,<br />
read<strong>in</strong>g to the child), child health, parental education <strong>and</strong><br />
employment status, <strong>and</strong> the social skills <strong>and</strong> behaviors of<br />
their children.<br />
Data on the schools that children attended <strong>and</strong> their<br />
classrooms were collected through self-adm<strong>in</strong>istered<br />
questionnaires completed by school adm<strong>in</strong>istrators <strong>and</strong><br />
classroom teachers. Adm<strong>in</strong>istrators provided <strong>in</strong>formation<br />
about the school population, programs, <strong>and</strong> policies. At<br />
the classroom level, data were collected from the teachers<br />
on the composition of the classroom, teach<strong>in</strong>g practices,<br />
curriculum, <strong>and</strong> teacher qualifications <strong>and</strong> experience. In<br />
addition, special education teachers <strong>and</strong> related services<br />
staff provided reports on the services received by children<br />
with disabilities.<br />
New data are be<strong>in</strong>g collected on a 2011 ECLS-K cohort.<br />
The first data collection began dur<strong>in</strong>g the fall <strong>and</strong> spr<strong>in</strong>g<br />
of the 2010–11 school year. Follow-ups are planned for<br />
2011–12 <strong>and</strong> <strong>in</strong> the spr<strong>in</strong>g from 2013–2016. This study<br />
will be similar to the older ECLS-K cohort, but it will<br />
provide <strong>in</strong>sight <strong>in</strong>to the more recent education policy<br />
changes, such as the No Child Left Beh<strong>in</strong>d Act, the<br />
<strong>in</strong>crease <strong>in</strong> school choice, <strong>and</strong> the <strong>in</strong>crease <strong>in</strong> English<br />
language learners.<br />
Further <strong>in</strong>formation on the ECLS-K may be obta<strong>in</strong>ed<br />
from<br />
Chris Chapman<br />
Early Childhood, International, <strong>and</strong> Crosscutt<strong>in</strong>g Studies<br />
Division<br />
Early Childhood <strong>and</strong> Household Studies Program<br />
National Center for <strong>Education</strong> Statistics<br />
1990 K Street NW<br />
Wash<strong>in</strong>gton, DC 20006<br />
chris.chapman@ed.gov<br />
http://nces.ed.gov/ecls/k<strong>in</strong>dergarten.asp<br />
<strong>Education</strong> Longitud<strong>in</strong>al <strong>Study</strong> of 2002 (ELS:<br />
2002)<br />
The <strong>Education</strong> Longitud<strong>in</strong>al <strong>Study</strong> of 2002 (ELS: 2002)<br />
is a longitud<strong>in</strong>al survey that is monitor<strong>in</strong>g the transitions<br />
of a national probability sample of 10th-graders <strong>in</strong> public,<br />
Catholic, <strong>and</strong> other private schools. Survey waves follow<br />
both students <strong>and</strong> high school dropouts <strong>and</strong> monitor the<br />
transition of the cohort to postsecondary education, the<br />
labor force, <strong>and</strong> family formation.<br />
In the base year of the study, of 1,220 eligible contacted<br />
schools, 750 participated, for an overall weighted school<br />
participation rate of approximately 68 percent (62<br />
percent unweighted). Of 17,590 selected eligible students,<br />
15,360 participated, for an overall weighted student<br />
response rate of approximately 87 percent. (School <strong>and</strong><br />
student weighted response rates reflect use of the base<br />
weight [design weight] <strong>and</strong> do not <strong>in</strong>clude nonresponse<br />
adjustments.) Information for the study is obta<strong>in</strong>ed not<br />
just from students <strong>and</strong> their school records, but also from<br />
the students’ parents, their teachers, their librarians, <strong>and</strong><br />
the adm<strong>in</strong>istrators of their schools.<br />
The first follow-up was conducted <strong>in</strong> 2004, when most<br />
sample members were high school seniors. Base-year<br />
students who rema<strong>in</strong>ed <strong>in</strong> their base schools were<br />
resurveyed <strong>and</strong> tested <strong>in</strong> mathematics, along with a<br />
freshen<strong>in</strong>g sample to make the study representative of<br />
spr<strong>in</strong>g 2004 high school seniors nationwide. The study<br />
collected comparable <strong>in</strong>formation from students who<br />
dropped out, students who transferred to a different<br />
school, <strong>and</strong> students who graduated early.<br />
The second follow-up, completed <strong>in</strong> 2006, cont<strong>in</strong>ued<br />
to follow the sample of students <strong>in</strong>to postsecondary<br />
education, the workforce, or both. The next follow-up is<br />
scheduled for 2012.<br />
Further <strong>in</strong>formation on ELS: 2002 may be obta<strong>in</strong>ed from<br />
Elise Christopher<br />
Elementary/Secondary <strong>and</strong> Libraries Studies Division<br />
Elementary/Secondary Sample Survey Studies Program<br />
National Center for <strong>Education</strong> Statistics<br />
1990 K Street NW<br />
Wash<strong>in</strong>gton, DC 20006<br />
elise.christopher@ed.gov<br />
http://nces.ed.gov/surveys/els2002<br />
290 <strong>Gaps</strong> <strong>in</strong> <strong>Access</strong> <strong>and</strong> <strong>Persistence</strong> <strong>Study</strong>
High School Longitud<strong>in</strong>al <strong>Study</strong> of 2009<br />
(HSLS:09)<br />
The High School Longitud<strong>in</strong>al <strong>Study</strong> of 2009 (HSLS:09)<br />
is a nationally representative, longitud<strong>in</strong>al study of more<br />
than 21,000 9th-grade students <strong>in</strong> 944 schools who will<br />
be followed through their secondary <strong>and</strong> postsecondary<br />
years. The study focuses on underst<strong>and</strong><strong>in</strong>g students’<br />
trajectories from the beg<strong>in</strong>n<strong>in</strong>g of high school <strong>in</strong>to<br />
postsecondary education, the workforce, <strong>and</strong> beyond.<br />
Focused on but not limited to <strong>in</strong>formation on science,<br />
technology, eng<strong>in</strong>eer<strong>in</strong>g, <strong>and</strong> mathematics (STEM)<br />
education <strong>and</strong> careers, the HSLS:09 questionnaires are<br />
designed to provide data on mathematics <strong>and</strong> science<br />
education, the chang<strong>in</strong>g high school environment,<br />
<strong>and</strong> postsecondary education. This study features a<br />
new student assessment <strong>in</strong> algebra skills, reason<strong>in</strong>g,<br />
<strong>and</strong> problem solv<strong>in</strong>g <strong>and</strong> <strong>in</strong>cludes surveys of students,<br />
their parents, math <strong>and</strong> science teachers, <strong>and</strong> school<br />
adm<strong>in</strong>istrators, as well as a new survey of school<br />
counselors.<br />
The HSLS:09 student questionnaire <strong>in</strong>cludes <strong>in</strong>terest <strong>and</strong><br />
motivation items for measur<strong>in</strong>g key factors predict<strong>in</strong>g<br />
choice of postsecondary paths, <strong>in</strong>clud<strong>in</strong>g majors <strong>and</strong><br />
eventual careers. This study will explore the roles of<br />
different factors <strong>in</strong> the development of a student’s<br />
commitment to attend college <strong>and</strong> then to take the steps<br />
necessary to succeed <strong>in</strong> college (the right courses, courses<br />
<strong>in</strong> specific sequences, etc.). Questionnaires <strong>in</strong> this study<br />
will ask more questions of students <strong>and</strong> parents regard<strong>in</strong>g<br />
reasons for select<strong>in</strong>g specific colleges (e.g., academic<br />
programs, f<strong>in</strong>ancial aid <strong>and</strong> access prices, <strong>and</strong> campus<br />
environment). It will also look at levels of mis<strong>in</strong>formation<br />
that may complicate postsecondary decisions.<br />
HSLS:09 will be able to survey respondents dur<strong>in</strong>g the<br />
critical junior <strong>and</strong> senior years regard<strong>in</strong>g applications,<br />
acceptances, <strong>and</strong> rejections at colleges. A short computeradm<strong>in</strong>istered<br />
questionnaire will procure <strong>in</strong>formation<br />
on college acceptances <strong>and</strong> actual choices. In past<br />
longitud<strong>in</strong>al studies, this activity has been delayed to later<br />
follow-ups (2 years after high school).<br />
Public-use HSLS data were used for report <strong>in</strong>dicators<br />
when possible so that a wider audience could replicate the<br />
results. Restricted-use HSLS data were used for <strong>in</strong>dicators<br />
that were based on variables or samples that could not be<br />
analyzed us<strong>in</strong>g the public-use file.<br />
Further <strong>in</strong>formation on HSLS:09 may be obta<strong>in</strong>ed from<br />
Laura LoGerfo<br />
Project Officer for High School Longitud<strong>in</strong>al <strong>Study</strong> of<br />
2009<br />
Secondary Longitud<strong>in</strong>al & Transcript Studies-ESLSD<br />
1990 K Street NW<br />
Wash<strong>in</strong>gton, DC 20006<br />
laura.logerfo@ed.gov<br />
http://nces.ed.gov/surveys/hsls09<br />
High School Transcript <strong>Study</strong> (HSTS)<br />
High school transcript studies have been conducted by<br />
NCES as part of the Longitud<strong>in</strong>al Studies Program <strong>and</strong><br />
the National Assessment of <strong>Education</strong>al Progress (NAEP)<br />
High School Transcript Studies (HSTS) program s<strong>in</strong>ce<br />
1982. Each transcript study is associated with a major<br />
NCES data collection. For example, the first NCESsponsored<br />
transcript study was associated with the High<br />
School <strong>and</strong> Beyond (HS&B) first follow-up survey <strong>in</strong><br />
1982. The National Assessment of <strong>Education</strong> Progress<br />
(NAEP) collected transcript data <strong>in</strong> 1987, 1990, 1994,<br />
1998, 2000, 2005, <strong>and</strong> 2009.<br />
NCES high school transcript studies collect <strong>in</strong>formation<br />
that is conta<strong>in</strong>ed on the student high school record;<br />
this <strong>in</strong>formation <strong>in</strong>cludes courses taken while attend<strong>in</strong>g<br />
secondary school, <strong>in</strong>formation on credits earned, year <strong>and</strong><br />
term a specific course was taken, <strong>and</strong> f<strong>in</strong>al grades. When<br />
available, <strong>in</strong>formation on class rank <strong>and</strong> st<strong>and</strong>ardized<br />
scores is also collected. Once collected, <strong>in</strong>formation<br />
such as course name, credits earned, <strong>and</strong> course grades<br />
is transcribed <strong>and</strong> st<strong>and</strong>ardized (e.g., credits <strong>and</strong> credit<br />
hours are st<strong>and</strong>ardized to a common metric) <strong>and</strong> can be<br />
l<strong>in</strong>ked back to the student’s questionnaire or assessment<br />
data. For example, when transcript data are collected<br />
by NAEP, HSTS offers <strong>in</strong>formation on the relationship<br />
between student coursetak<strong>in</strong>g patterns <strong>and</strong> grade 12<br />
achievement data on NAEP assessments.<br />
Transcripts <strong>in</strong>clude <strong>in</strong>formation that is considered<br />
to be the official <strong>and</strong> fixed record regard<strong>in</strong>g student<br />
coursetak<strong>in</strong>g behavior. This <strong>in</strong>formation is considered to<br />
be more accurate than student self-report <strong>in</strong>formation <strong>and</strong><br />
can be used to exam<strong>in</strong>e coursetak<strong>in</strong>g patterns of students<br />
<strong>and</strong> to predict future education outcomes.<br />
The 2009 transcript study was conducted from late<br />
spr<strong>in</strong>g 2009 through January 2010, after the<br />
adm<strong>in</strong>istration of NAEP. Transcripts were collected for<br />
12th-grade students who graduated from high school<br />
by the end of the collection period. Most students also<br />
participated <strong>in</strong> the NAEP assessments earlier that same<br />
year.<br />
Further <strong>in</strong>formation on NAEP high school transcript<br />
studies may be obta<strong>in</strong>ed from<br />
Janis Brown<br />
Assessment Division<br />
Assessment Research, Development & Implementation<br />
Program<br />
National Center for <strong>Education</strong> Statistics<br />
1990 K Street NW<br />
Wash<strong>in</strong>gton, DC 20006<br />
janis.brown@ed.gov<br />
http://nces.ed.gov/surveys/hst<br />
Appendix B<br />
Appendix B: Guide to Sources 291
Integrated Postsecondary <strong>Education</strong> Data<br />
System (IPEDS)<br />
The Integrated Postsecondary <strong>Education</strong> Data System<br />
(IPEDS) surveys approximately 6,800 postsecondary<br />
<strong>in</strong>stitutions, <strong>in</strong>clud<strong>in</strong>g universities <strong>and</strong> colleges, as well as<br />
<strong>in</strong>stitutions offer<strong>in</strong>g technical <strong>and</strong> vocational education<br />
beyond the high school level. IPEDS, which began <strong>in</strong><br />
1986, replaced the <strong>Higher</strong> <strong>Education</strong> General Information<br />
Survey (HEGIS).<br />
IPEDS consists of eight <strong>in</strong>terrelated components that are<br />
collected over three collection periods (fall, w<strong>in</strong>ter, <strong>and</strong><br />
spr<strong>in</strong>g) each year. These components obta<strong>in</strong> <strong>in</strong>formation<br />
on who provides postsecondary education (<strong>in</strong>stitutions),<br />
who participates <strong>in</strong> it <strong>and</strong> completes it (students), what<br />
programs are offered <strong>and</strong> what programs are completed,<br />
<strong>and</strong> both the human <strong>and</strong> f<strong>in</strong>ancial resources <strong>in</strong>volved<br />
<strong>in</strong> the provision of <strong>in</strong>stitutionally based postsecondary<br />
education. Until 2000, these components <strong>in</strong>cluded<br />
<strong>in</strong>stitutional characteristics, fall enrollment, completions,<br />
salaries, f<strong>in</strong>ance, <strong>and</strong> fall staff. Beg<strong>in</strong>n<strong>in</strong>g <strong>in</strong> 2000, data<br />
were collected <strong>in</strong> the fall for <strong>in</strong>stitutional characteristics<br />
<strong>and</strong> completions; <strong>in</strong> the w<strong>in</strong>ter for employees by assigned<br />
position (EAP), salaries, <strong>and</strong> fall staff; <strong>and</strong> <strong>in</strong> the spr<strong>in</strong>g<br />
for enrollment, student f<strong>in</strong>ancial aid, f<strong>in</strong>ances, <strong>and</strong><br />
graduation rates. With the w<strong>in</strong>ter 2005–06 survey, the<br />
employees by assigned position, fall staff, <strong>and</strong> salaries<br />
components were merged <strong>in</strong>to the human resources<br />
component. In 2007–08, the enrollment component<br />
was broken <strong>in</strong>to two separate components: 12-month<br />
enrollment (collected <strong>in</strong> the fall) <strong>and</strong> fall enrollment<br />
(collected <strong>in</strong> the spr<strong>in</strong>g).<br />
IPEDS race/ethnicity data collection changed <strong>in</strong><br />
2008–09. The “Asian” race category is now separate<br />
from a “Native Hawaiian or Other Pacific Isl<strong>and</strong>er”<br />
category. Survey takers also have the option to identify<br />
themselves as be<strong>in</strong>g of “Two or more races.” To recognize<br />
that “Hispanic” refers to ethnicity, <strong>and</strong> not race, the new<br />
Hispanic category reads “Hispanics of any race.”<br />
Researchers can use IPEDS to analyze <strong>in</strong>formation on (1)<br />
enrollments of undergraduates, first-time freshmen, <strong>and</strong><br />
graduate <strong>and</strong> first-professional students by race/ethnicity<br />
<strong>and</strong> sex; (2) <strong>in</strong>stitutional revenue <strong>and</strong> expenditure patterns<br />
by source of <strong>in</strong>come <strong>and</strong> type of expense; (3) completions<br />
(awards) by level of program, level of award, race/<br />
ethnicity, <strong>and</strong> sex; (4) characteristics of postsecondary<br />
<strong>in</strong>stitutions, <strong>in</strong>clud<strong>in</strong>g tuition, room <strong>and</strong> board charges,<br />
<strong>and</strong> calendar systems; (5) status of career <strong>and</strong> technical<br />
education programs; <strong>and</strong> (6) other issues of <strong>in</strong>terest.<br />
Beg<strong>in</strong>n<strong>in</strong>g <strong>in</strong> 1993, the IPEDS survey completion became<br />
m<strong>and</strong>atory for all postsecondary <strong>in</strong>stitutions with a<br />
Program Participation Agreement (PPA) with the Office<br />
of Postsecondary <strong>Education</strong> (OPE), U.S. Department<br />
of <strong>Education</strong>—that is, <strong>in</strong>stitutions that participate<br />
<strong>in</strong> or are eligible to participate <strong>in</strong> any federal student<br />
f<strong>in</strong>ancial assistance program authorized by Title IV of<br />
the <strong>Higher</strong> <strong>Education</strong> Act of 1965, as amended (20 USC<br />
1094, Section 487 [a][17] <strong>and</strong> 34 CFR 668.14[b][19]).<br />
Such programs <strong>in</strong>clude Pell Gants <strong>and</strong> Stafford Loans<br />
given to students at 4-year <strong>and</strong> higher, 2-but-less-than<br />
4-year, <strong>and</strong> less than 2-year postsecondary <strong>in</strong>stitutions,<br />
<strong>in</strong>clud<strong>in</strong>g degree <strong>and</strong> non-degree grant<strong>in</strong>g <strong>in</strong>stitutions.<br />
For <strong>in</strong>stitutions not eligible to participate <strong>in</strong> Title IV<br />
programs, participation <strong>in</strong> the IPEDS is voluntary. Prior<br />
to 1993, only national-level estimates from a sample<br />
of <strong>in</strong>stitutions are available for private less-than-2-year<br />
<strong>in</strong>stitutions.<br />
Further <strong>in</strong>formation on IPEDS may be obta<strong>in</strong>ed from<br />
Jessica Shedd<br />
Postsecondary, Adult, <strong>and</strong> Career <strong>Education</strong> Division<br />
Postsecondary Institutional Studies Program<br />
National Center for <strong>Education</strong> Statistics<br />
1990 K Street NW<br />
Wash<strong>in</strong>gton, DC 20006<br />
jessica.shedd@ed.gov<br />
http://nces.ed.gov/ipeds<br />
National Assessment of <strong>Education</strong>al Progress<br />
(NAEP)<br />
The National Assessment of <strong>Education</strong>al Progress (NAEP)<br />
is a series of cross-sectional studies <strong>in</strong>itially implemented<br />
<strong>in</strong> 1969 to assess the educational achievement of U.S.<br />
students <strong>and</strong> monitor changes <strong>in</strong> those achievements.<br />
In the ma<strong>in</strong> national NAEP, a nationally representative<br />
sample of students is assessed at grades 4, 8, <strong>and</strong> 12 <strong>in</strong><br />
various academic subjects.<br />
The assessments are based on frameworks developed by<br />
the National Assessment Govern<strong>in</strong>g Board (NAGB). Items<br />
<strong>in</strong>clude both multiple-choice <strong>and</strong> constructed-response<br />
(requir<strong>in</strong>g written answers) items. Results are reported<br />
<strong>in</strong> two ways: by average score <strong>and</strong> by achievement<br />
level. Average scores are reported for the nation, for<br />
participat<strong>in</strong>g states <strong>and</strong> jurisdictions, <strong>and</strong> for subgroups<br />
of the population. Percentages of students meet<strong>in</strong>g certa<strong>in</strong><br />
achievement levels are also reported for these groups. The<br />
achievement levels, developed by NAGB, are at or above<br />
Basic, at or above Proficient, <strong>and</strong> at or above Advanced.<br />
From 1990 until 2001, ma<strong>in</strong> NAEP was conducted for<br />
states <strong>and</strong> other jurisdictions that chose to participate. In<br />
2002, under the provisions of the No Child Left Beh<strong>in</strong>d<br />
Act of 2001, all states began to participate <strong>in</strong> ma<strong>in</strong> NAEP<br />
<strong>and</strong> an aggregate of all state samples replaced the separate<br />
national sample.<br />
Mathematics assessments were adm<strong>in</strong>istered <strong>in</strong> 2000,<br />
2003, 2005, 2007, 2009, <strong>and</strong> 2011. In 2005, NAGB<br />
called for the development of a new mathematics<br />
framework. The revisions made to the mathematics<br />
framework for the 2005 assessment were <strong>in</strong>tended to<br />
reflect recent curricular emphases <strong>and</strong> better assess the<br />
specific objectives for students at each grade level.<br />
The revised mathematics framework focuses on two<br />
dimensions: mathematical content <strong>and</strong> cognitive dem<strong>and</strong>.<br />
292 <strong>Gaps</strong> <strong>in</strong> <strong>Access</strong> <strong>and</strong> <strong>Persistence</strong> <strong>Study</strong>
By consider<strong>in</strong>g these two dimensions for each item <strong>in</strong> the<br />
assessment, the framework ensures that NAEP assesses an<br />
appropriate balance of content, as well as a variety of ways<br />
of know<strong>in</strong>g <strong>and</strong> do<strong>in</strong>g mathematics.<br />
For grades 4 <strong>and</strong> 8, comparisons over time can be<br />
made among the assessments prior to <strong>and</strong> after the<br />
implementation of the 2005 framework. The changes<br />
to the grade 12 assessment were too drastic to allow<br />
the results to be directly compared with previous<br />
years. The changes to the grade 12 assessment <strong>in</strong>cluded<br />
add<strong>in</strong>g more questions on algebra, data analysis, <strong>and</strong><br />
probability to reflect changes <strong>in</strong> high school mathematics<br />
st<strong>and</strong>ards <strong>and</strong> coursework, as well as the merg<strong>in</strong>g of the<br />
measurement <strong>and</strong> geometry content areas. The report<strong>in</strong>g<br />
scale for grade 12 mathematics was changed from 0–500<br />
to 0–300. For more <strong>in</strong>formation regard<strong>in</strong>g the 2005<br />
mathematics framework revisions, see http://nces.ed.gov/<br />
nationsreportcard/mathematics/frameworkcomparison.<br />
asp.<br />
Read<strong>in</strong>g assessments were adm<strong>in</strong>istered <strong>in</strong> 2000,<br />
2002, 2003, 2005, 2007, 2009, <strong>and</strong> 2011. In 2009, a<br />
new framework was developed for the 4th-, 8th-, <strong>and</strong><br />
12th-grade NAEP read<strong>in</strong>g assessments.<br />
Both a content alignment study <strong>and</strong> a read<strong>in</strong>g trend or<br />
bridge study were conducted to determ<strong>in</strong>e if the “new”<br />
assessment was comparable to the “old” assessment.<br />
Overall, the results of the special analyses suggested that<br />
the old <strong>and</strong> new assessments were similar <strong>in</strong> terms of<br />
their item <strong>and</strong> scale characteristics <strong>and</strong> the results they<br />
produced for important demographic groups of students.<br />
Thus, it was determ<strong>in</strong>ed that the results of the 2009<br />
read<strong>in</strong>g assessment could still be compared to those from<br />
earlier assessment years, thereby ma<strong>in</strong>ta<strong>in</strong><strong>in</strong>g the trend<br />
l<strong>in</strong>es first established <strong>in</strong> 1992. For more <strong>in</strong>formation<br />
regard<strong>in</strong>g the 2009 read<strong>in</strong>g framework revisions,<br />
see http://nces.ed.gov/nationsreportcard/read<strong>in</strong>g/<br />
whatmeasure.asp.<br />
Further <strong>in</strong>formation on NAEP may be obta<strong>in</strong>ed from<br />
Sherran T. Osborne<br />
Assessment Operations<br />
Outreach & Information Dissem<strong>in</strong>ation<br />
National Center for <strong>Education</strong> Statistics<br />
1990 K Street, NW<br />
Wash<strong>in</strong>gton, DC 20006<br />
sherran.osborne@ed.gov<br />
http://nces.ed.gov/nationsreportcard<br />
National Household <strong>Education</strong> Surveys<br />
Program (NHES)<br />
The National Household <strong>Education</strong> Surveys Program<br />
(NHES) is a data collection system that is designed to<br />
address a wide range of education-related issues. Surveys<br />
have been conducted <strong>in</strong> 1991, 1993, 1995, 1996, 1999,<br />
2001, 2003, 2005, <strong>and</strong> 2007. Data collected for 2012 will<br />
be available <strong>in</strong> 2013. NHES targets specific populations<br />
for detailed data collection. It is <strong>in</strong>tended to provide<br />
more detailed data on the topics <strong>and</strong> populations of<br />
<strong>in</strong>terest than are collected through supplements to other<br />
household surveys.<br />
NHES: 2007 fielded two surveys: the Parent <strong>and</strong> Family<br />
Involvement <strong>in</strong> <strong>Education</strong>, <strong>and</strong> School Read<strong>in</strong>ess. For<br />
the surveys, <strong>in</strong>terviews were completed with parents of<br />
10,680 sampled children <strong>in</strong> k<strong>in</strong>dergarten through grade<br />
12, <strong>in</strong>clud<strong>in</strong>g 10,370 students enrolled <strong>in</strong> public or private<br />
schools <strong>and</strong> 310 homeschooled children.<br />
Further <strong>in</strong>formation on NHES may be obta<strong>in</strong>ed from<br />
Andrew Zukerberg<br />
Early Childhood, International, <strong>and</strong> Crosscutt<strong>in</strong>g Studies<br />
Division<br />
Early Childhood <strong>and</strong> Household Studies Program<br />
National Center for <strong>Education</strong> Statistics<br />
1990 K Street NW<br />
Wash<strong>in</strong>gton, DC 20006<br />
<strong>and</strong>rew.zukerberg@ed.gov<br />
http://nces.ed.gov/nhes<br />
National Postsecondary Student Aid <strong>Study</strong><br />
(NPSAS)<br />
The National Postsecondary Student Aid <strong>Study</strong><br />
(NPSAS) is a comprehensive nationwide study of how<br />
students <strong>and</strong> their families pay for postsecondary<br />
education. It covers nationally representative samples of<br />
undergraduates, graduates, <strong>and</strong> first-professional students<br />
<strong>in</strong> the 50 states, the District of Columbia, <strong>and</strong> Puerto<br />
Rico, <strong>in</strong>clud<strong>in</strong>g students attend<strong>in</strong>g less-than-2-year<br />
<strong>in</strong>stitutions, community colleges, 4-year colleges, <strong>and</strong><br />
major universities. Participants <strong>in</strong>clude students who do<br />
not receive aid as well as those who do receive f<strong>in</strong>ancial<br />
aid. The data collected by NPSAS provide <strong>in</strong>formation<br />
on the cost of postsecondary education, the distribution<br />
of f<strong>in</strong>ancial aid, <strong>and</strong> the characteristics of both aided <strong>and</strong><br />
non-aided students <strong>and</strong> their families. <strong>Study</strong> results are<br />
used to help guide future federal policy regard<strong>in</strong>g student<br />
f<strong>in</strong>ancial aid.<br />
The early NPSAS studies, which began dur<strong>in</strong>g the<br />
1986–87 school year, were conducted every 3 years, but<br />
from the 1999–2000 study to the present, NPSAS has<br />
been conducted every 4 years. The next cycle of NPSAS<br />
is scheduled for the 2011–12 school year. In the most<br />
recent study, NPSAS:08, about 114,000 undergraduate<br />
students <strong>and</strong> 14,000 graduate students enrolled <strong>in</strong><br />
postsecondary education dur<strong>in</strong>g the 2007–08 school<br />
year were selected from more than 1,730 postsecondary<br />
<strong>in</strong>stitutions. NPSAS:08 <strong>in</strong>cluded a new set of <strong>in</strong>strument<br />
items to obta<strong>in</strong> basel<strong>in</strong>e measures of the awareness of two<br />
new federal grants <strong>in</strong>troduced <strong>in</strong> 2006: the Academic<br />
Competitiveness Grant (ACG) <strong>and</strong> the National Science<br />
<strong>and</strong> Mathematics <strong>Access</strong> to Reta<strong>in</strong> Talent (SMART)<br />
grant.<br />
Appendix B<br />
Appendix B: Guide to Sources 293
Further <strong>in</strong>formation on NPSAS may be obta<strong>in</strong>ed from<br />
Aurora D’Amico<br />
Tracy Hunt-White<br />
Postsecondary, Adult, <strong>and</strong> Career <strong>Education</strong> Division<br />
Postsecondary Sample Survey Studies Program<br />
National Center for <strong>Education</strong> Statistics<br />
1990 K Street NW<br />
Wash<strong>in</strong>gton, DC 20006<br />
aurora.damico@ed.gov<br />
tracy.hunt-white@ed.gov<br />
http://nces.ed.gov/npsas<br />
Other Governmental Agency Data<br />
Sources<br />
Census Bureau<br />
American Community Survey (ACS)<br />
The Census Bureau <strong>in</strong>troduced the American Community<br />
Survey (ACS) <strong>in</strong> 1996. Fully implemented <strong>in</strong> 2005,<br />
it provides a large monthly sample of demographic,<br />
socioeconomic, <strong>and</strong> hous<strong>in</strong>g data comparable <strong>in</strong> content<br />
to the Long Forms of the Decennial Census up to <strong>and</strong><br />
<strong>in</strong>clud<strong>in</strong>g the 2000 long form. Aggregated over time,<br />
these data will serve as a replacement for the Long Form<br />
of the Decennial Census. The survey <strong>in</strong>cludes questions<br />
m<strong>and</strong>ated by federal law, federal regulations, <strong>and</strong> court<br />
decisions.<br />
S<strong>in</strong>ce 2005, the survey has been mailed to approximately<br />
250,000 addresses <strong>in</strong> the United States <strong>and</strong> Puerto Rico<br />
each month, or about 2.5 percent of the population<br />
annually. A larger proportion of addresses <strong>in</strong> small<br />
governmental units (e.g., American Indian reservations,<br />
small counties, <strong>and</strong> towns) also receive the survey. The<br />
monthly sample size is designed to approximate the<br />
ratio used <strong>in</strong> the 2000 Census, which requires more<br />
<strong>in</strong>tensive distribution <strong>in</strong> these areas. The ACS covers<br />
the U.S. resident population, which <strong>in</strong>cludes the entire<br />
civilian, non<strong>in</strong>stitutionalized population; <strong>in</strong>carcerated<br />
persons; <strong>in</strong>stitutionalized persons; <strong>and</strong> the active duty<br />
military who are <strong>in</strong> the United States. In 2006, the ACS<br />
began <strong>in</strong>terview<strong>in</strong>g residents <strong>in</strong> group quarter facilities.<br />
Institutionalized group quarters <strong>in</strong>clude adult <strong>and</strong> juvenile<br />
correctional facilities, nurs<strong>in</strong>g facilities, <strong>and</strong> other health<br />
care facilities. Non<strong>in</strong>stitutionalized group quarters <strong>in</strong>clude<br />
college <strong>and</strong> university hous<strong>in</strong>g, military barracks, <strong>and</strong><br />
other non<strong>in</strong>stitutional facilities such as workers <strong>and</strong><br />
religious group quarters <strong>and</strong> temporary shelters for the<br />
homeless.<br />
National-level data from the ACS are available from 2000<br />
onward. Annual results were available for areas with<br />
populations of 65,000 or more beg<strong>in</strong>n<strong>in</strong>g <strong>in</strong> the summer<br />
of 2006; for areas with populations of 20,000 or more<br />
<strong>in</strong> the summer of 2008; <strong>and</strong> for all areas—down to the<br />
census tract level. This schedule is based on the time it<br />
will take to collect data from a sample size large enough<br />
to produce accurate results for different size geographic<br />
units.<br />
Further <strong>in</strong>formation about the ACS is available at http://<br />
www.census.gov/acs/www/.<br />
Current Population Survey (CPS)<br />
The Current Population Survey (CPS) is a monthly<br />
survey of about 60,000 households conducted by the U.S.<br />
Census Bureau for the Bureau of Labor Statistics. The<br />
CPS is the primary source of <strong>in</strong>formation of labor force<br />
statistics for the U.S. non<strong>in</strong>stitutionalized population<br />
(e.g., excludes military personnel <strong>and</strong> their families<br />
liv<strong>in</strong>g on bases <strong>and</strong> <strong>in</strong>mates of <strong>in</strong>stitutions). In addition,<br />
supplemental questionnaires are used to provide further<br />
<strong>in</strong>formation about the U.S. population. Specifically, <strong>in</strong><br />
October, detailed questions regard<strong>in</strong>g school enrollment<br />
<strong>and</strong> school characteristics are asked. In March, detailed<br />
questions regard<strong>in</strong>g <strong>in</strong>come are asked.<br />
The current sample design, <strong>in</strong>troduced <strong>in</strong> July 2001,<br />
<strong>in</strong>cludes about 72,000 households. Each month about<br />
58,900 of the 72,000 households are eligible for <strong>in</strong>terview,<br />
<strong>and</strong> of those, 7 to 10 percent are not <strong>in</strong>terviewed because<br />
of temporary absence or unavailability. Information is<br />
obta<strong>in</strong>ed each month from those <strong>in</strong> the household who<br />
are 15 years of age <strong>and</strong> older <strong>and</strong> demographic data are<br />
collected for children 0–14 years of age. Prior to July<br />
2001, data were collected <strong>in</strong> the CPS from about 50,000<br />
dwell<strong>in</strong>g units. The samples are <strong>in</strong>itially selected based on<br />
the decennial census files <strong>and</strong> are periodically updated to<br />
reflect new hous<strong>in</strong>g construction.<br />
The estimation procedure employed for monthly CPS<br />
data <strong>in</strong>volves <strong>in</strong>flat<strong>in</strong>g weighted sample results to<br />
<strong>in</strong>dependent estimates of characteristics of the civilian<br />
non<strong>in</strong>stitutional population <strong>in</strong> the United States by age,<br />
sex, <strong>and</strong> race. These <strong>in</strong>dependent estimates are based on<br />
statistics from decennial censuses; statistics on births,<br />
deaths, immigration, <strong>and</strong> emigration; <strong>and</strong> statistics on the<br />
population <strong>in</strong> the armed services. Generalized st<strong>and</strong>ard<br />
error tables are provided <strong>in</strong> the Current Population Reports;<br />
methods for deriv<strong>in</strong>g st<strong>and</strong>ard errors can be found with<strong>in</strong><br />
the CPS technical documentation at http://www.census.<br />
gov/cps/methodology/techdocs.html. The CPS data are<br />
subject to both nonsampl<strong>in</strong>g <strong>and</strong> sampl<strong>in</strong>g errors.<br />
Beg<strong>in</strong>n<strong>in</strong>g <strong>in</strong> 2003, race/ethnicity questions exp<strong>and</strong>ed<br />
to <strong>in</strong>clude <strong>in</strong>formation on people of two or more races.<br />
Pacific Isl<strong>and</strong>er/Native Hawaiian data is collected<br />
separately from Asian data. The questions have also been<br />
worded to make it clear that self-reported data on race/<br />
ethnicity should reflect the race/ethnicity with which the<br />
responder identifies, rather than what may be written <strong>in</strong><br />
official documentation.<br />
October Supplement<br />
Each year, the Annual Social <strong>and</strong> Economic (ASEC)<br />
Supplement <strong>and</strong> October supplemental questionnaires<br />
conta<strong>in</strong> questions of relevance to education policy. The<br />
ASEC Supplement, formerly known as the March CPS<br />
Supplement, is a primary source of detailed <strong>in</strong>formation<br />
on <strong>in</strong>come <strong>and</strong> work experience <strong>in</strong> the United States. The<br />
294 <strong>Gaps</strong> <strong>in</strong> <strong>Access</strong> <strong>and</strong> <strong>Persistence</strong> <strong>Study</strong>
October Supplement rout<strong>in</strong>ely gathers data on school<br />
enrollment, school characteristics, <strong>and</strong> educational<br />
atta<strong>in</strong>ment for elementary, secondary, <strong>and</strong> postsecondary<br />
education. Related data are also collected about<br />
preschool<strong>in</strong>g <strong>and</strong> the general adult population. NCES<br />
funds additional items on education-related topics such as<br />
language proficiency, disabilities, computer use <strong>and</strong> access,<br />
student mobility, <strong>and</strong> private school tuition. Responses are<br />
collected for all household members age 3 <strong>and</strong> over.<br />
Further <strong>in</strong>formation on CPS may be obta<strong>in</strong>ed from<br />
<strong>Education</strong> <strong>and</strong> Social Stratification Branch<br />
Population Division<br />
Census Bureau<br />
U.S. Department of Commerce<br />
4600 Silver Hill Road<br />
Wash<strong>in</strong>gton, DC 20233<br />
http://www.census.gov/cps<br />
Centers for Disease Control <strong>and</strong> Prevention<br />
(CDC)<br />
Youth Risk Behavior Surveillance System<br />
(YRBSS)<br />
The Youth Risk Behavior Surveillance System (YRBSS)<br />
was created <strong>in</strong> 1991 to monitor six types of health-risk<br />
behaviors that lead to death <strong>and</strong> disability among young<br />
adults: tobacco use, alcohol <strong>and</strong> other drug use, physical<br />
<strong>in</strong>activity, sexual risk behaviors, unhealthy diet behaviors,<br />
<strong>and</strong> behaviors that contribute to un<strong>in</strong>tentional <strong>in</strong>juries<br />
<strong>and</strong> violence. Obesity <strong>and</strong> asthma among youth <strong>and</strong><br />
young adults are also measured. Surveys are conducted<br />
every 2 years, usually <strong>in</strong> the spr<strong>in</strong>g semester.<br />
The system <strong>in</strong>cludes a national school-based survey<br />
conducted by the Centers for Disease Control <strong>and</strong><br />
Prevention (CDC), as well as state, territorial, tribal, <strong>and</strong><br />
local surveys conducted by state, territorial, <strong>and</strong> local<br />
health <strong>and</strong> education agencies <strong>and</strong> tribal governments.<br />
Each survey takes one class period to complete,<br />
approximately 10 m<strong>in</strong>utes to distribute materials <strong>and</strong> give<br />
directions <strong>and</strong> 35 m<strong>in</strong>utes to record responses. Permission<br />
is obta<strong>in</strong>ed from parents before adm<strong>in</strong>ister<strong>in</strong>g this<br />
anonymous, voluntary survey. States <strong>and</strong> local agencies<br />
can add or delete questions from the core questionnaire to<br />
meet their policy or programmatic needs.<br />
Local, territorial, <strong>and</strong> jurisdictional data from YRBSS<br />
surveys are weighted to represent all public school<br />
students <strong>in</strong> grades 9 through 12 <strong>in</strong> the respective<br />
jurisdiction. National data are collected from a separate<br />
scientific sample of students <strong>and</strong> are representative of<br />
students from all 50 states <strong>and</strong> the District of Columbia.<br />
Sample size varies accord<strong>in</strong>g to area, district, or school<br />
adm<strong>in</strong>ister<strong>in</strong>g the survey. Methodological studies were<br />
conducted <strong>in</strong> 1991 <strong>and</strong> 1999 to assess the validity of<br />
the self-reported behaviors <strong>and</strong> personal <strong>in</strong>formation.<br />
Research <strong>in</strong>dicates that student-reported data is just as<br />
credible as that gathered from adults.<br />
Further <strong>in</strong>formation on the YRBSS may be obta<strong>in</strong>ed from<br />
U.S. Department of Health <strong>and</strong> Human Service<br />
Division of Adolescent <strong>and</strong> School Health<br />
4770 Buford Highway, NE<br />
Atlanta, GA 30341<br />
(800) 232-4636<br />
cdc<strong>in</strong>fo@cdc.gov<br />
http://www.cdc.gov/HealthyYouth/yrbs/<strong>in</strong>dex.htm<br />
National Center for Health Statistics<br />
National Health Interview Survey (NHIS)<br />
The ma<strong>in</strong> objective of the NHIS is to monitor the health<br />
of the United States population through the collection<br />
<strong>and</strong> analysis of data on a broad range of health topics. A<br />
major strength of this survey lies <strong>in</strong> the ability to display<br />
these health characteristics by many demographic <strong>and</strong><br />
socioeconomic characteristics.<br />
The NHIS covers the civilian non<strong>in</strong>stitutionalized<br />
population resid<strong>in</strong>g <strong>in</strong> the United States at the time<br />
of the <strong>in</strong>terview. The NHIS is a cross-sectional<br />
household <strong>in</strong>terview survey. Sampl<strong>in</strong>g <strong>and</strong> <strong>in</strong>terview<strong>in</strong>g<br />
are cont<strong>in</strong>uous throughout each year. The sampl<strong>in</strong>g<br />
plan follows a multistage area probability design that<br />
permits the representative sampl<strong>in</strong>g of households <strong>and</strong><br />
non<strong>in</strong>stitutional group quarters (e.g., college dormitories).<br />
The sampl<strong>in</strong>g plan is redesigned after every decennial<br />
census. The current sampl<strong>in</strong>g plan was implemented <strong>in</strong><br />
2006. It has many similarities to the previous sampl<strong>in</strong>g<br />
plan, which was <strong>in</strong> place from 1995 to 2005. The first<br />
stage of the current sampl<strong>in</strong>g plan consists of a sample<br />
of 428 primary sampl<strong>in</strong>g units (PSU’s) drawn from<br />
approximately 1,900 geographically def<strong>in</strong>ed PSU’s that<br />
cover the 50 States <strong>and</strong> the District of Columbia. A PSU<br />
consists of a county, a small group of contiguous counties,<br />
or a metropolitan statistical area.<br />
The revised NHIS questionnaire, implemented s<strong>in</strong>ce 1997,<br />
has Core questions <strong>and</strong> Supplements. The Core questions<br />
rema<strong>in</strong> largely unchanged from year to year <strong>and</strong> allow for<br />
trends analysis <strong>and</strong> for data from more than one year to<br />
be pooled to <strong>in</strong>crease sample size for analytic purposes.<br />
The Core conta<strong>in</strong>s four major components: Household,<br />
Family, Sample Adult, <strong>and</strong> Sample Child.<br />
The Household component collects limited demographic<br />
<strong>in</strong>formation on all of the <strong>in</strong>dividuals liv<strong>in</strong>g <strong>in</strong> a particular<br />
house. The Family component verifies <strong>and</strong> collects<br />
additional demographic <strong>in</strong>formation on each member<br />
from each family <strong>in</strong> the house <strong>and</strong> collects data on<br />
topics <strong>in</strong>clud<strong>in</strong>g health status <strong>and</strong> limitations, <strong>in</strong>juries,<br />
healthcare access <strong>and</strong> utilization, health <strong>in</strong>surance, <strong>and</strong><br />
<strong>in</strong>come <strong>and</strong> assets. The Family Core component allows<br />
the NHIS to serve as a sampl<strong>in</strong>g frame for additional<br />
<strong>in</strong>tegrated surveys as needed.<br />
Data are collected through a personal household <strong>in</strong>terview<br />
conducted by <strong>in</strong>terviewers employed <strong>and</strong> tra<strong>in</strong>ed by<br />
the U.S. Bureau of the Census accord<strong>in</strong>g to procedures<br />
specified by the NCHS.<br />
Appendix B: Guide to Sources 295<br />
Appendix B
Further <strong>in</strong>formation on the NHIS may be obta<strong>in</strong>ed from<br />
Information Dissem<strong>in</strong>ation Staff<br />
National Center for Health Statistics<br />
Centers for Disease Control <strong>and</strong> Prevention<br />
3311 Toledo Road, Room 5407<br />
Hyattsville, MD 20782-2003<br />
(800) 232-4636<br />
nhis@cdc.gov<br />
http://www.cdc.gov/nchs/nhis.htm<br />
Other Organization Sources<br />
American College Test<strong>in</strong>g Program<br />
ACT assessment<br />
The ACT assessment is designed to measure educational<br />
development <strong>in</strong> the areas of English, mathematics, social<br />
studies, <strong>and</strong> natural sciences. The ACT assessment is<br />
taken by college-bound high school students <strong>and</strong> by<br />
all graduat<strong>in</strong>g seniors <strong>in</strong> Colorado <strong>and</strong> Ill<strong>in</strong>ois. The<br />
test results are used to predict how well students might<br />
perform <strong>in</strong> college.<br />
Prior to the 1984–85 school year, national norms were<br />
based on a 10-percent sample of the students tak<strong>in</strong>g the<br />
test. S<strong>in</strong>ce then, national norms are based on the test<br />
scores of all students tak<strong>in</strong>g the test. Beg<strong>in</strong>n<strong>in</strong>g with<br />
1984–85, these norms have been based on the most recent<br />
ACT scores available from students scheduled to graduate<br />
<strong>in</strong> the spr<strong>in</strong>g of the year. Duplicate test records are no<br />
longer used to produce national figures.<br />
Separate ACT st<strong>and</strong>ard scores are computed for English,<br />
mathematics, science reason<strong>in</strong>g, <strong>and</strong>, as of October<br />
1989, read<strong>in</strong>g. ACT st<strong>and</strong>ard scores are reported for each<br />
subject area on a scale from 1 to 36. In 2010, the national<br />
composite score (the simple average of the four ACT<br />
st<strong>and</strong>ard scores 21.0, with a st<strong>and</strong>ard deviation of 5.2. The<br />
tests emphasize reason<strong>in</strong>g, analysis, problem solv<strong>in</strong>g, <strong>and</strong><br />
the <strong>in</strong>tegration of learn<strong>in</strong>g from various sources, as well as<br />
the application of these proficiencies to the k<strong>in</strong>ds of tasks<br />
college students are expected to perform.<br />
It should be noted that graduat<strong>in</strong>g students who take<br />
the ACT assessment are not necessarily representative<br />
of graduat<strong>in</strong>g students nationally. Students who live <strong>in</strong><br />
the Midwest, Rocky Mounta<strong>in</strong>s, Pla<strong>in</strong>s, <strong>and</strong> South are<br />
overrepresented among ACT-tested students as compared<br />
to graduat<strong>in</strong>g students nationally. These students more<br />
often attend public colleges <strong>and</strong> universities, which<br />
require the ACT assessment more often than the SAT test.<br />
Further <strong>in</strong>formation on the ACT may be obta<strong>in</strong>ed from<br />
ACT<br />
500 ACT Drive<br />
P.O. Box 168<br />
Iowa City, IA 52243<br />
http://www.act.org<br />
College Entrance Exam<strong>in</strong>ation Board<br />
Advanced Placement Exam (AP)<br />
The Advanced Placement (AP) program is a curriculum<br />
sponsored by the College Board that offers high school<br />
students the opportunity to take college-level courses <strong>in</strong><br />
a high school sett<strong>in</strong>g. A student tak<strong>in</strong>g an AP course <strong>in</strong><br />
high school can earn college credit for participation by<br />
atta<strong>in</strong><strong>in</strong>g a certa<strong>in</strong> m<strong>in</strong>imum score on the AP exam <strong>in</strong><br />
that subject area.<br />
The AP program offers courses <strong>in</strong> 34 subjects. Although<br />
nearly 60 percent of U.S. high schools <strong>in</strong> the United States<br />
offer AP courses, the College Board does not require<br />
students to take an AP course before tak<strong>in</strong>g an AP exam.<br />
AP exams are offered once a year <strong>in</strong> May. Most of the<br />
exams take 2 to 3 hours to complete. The scores for all AP<br />
exams range from 1 to 5, with 5 be<strong>in</strong>g the highest score.<br />
Over 90 percent of the nation’s colleges <strong>and</strong> universities<br />
have an AP policy grant<strong>in</strong>g <strong>in</strong>com<strong>in</strong>g students credit,<br />
placement, or both, for qualify<strong>in</strong>g AP exam scores.<br />
SAT<br />
The Admissions Test<strong>in</strong>g Program of the College Board<br />
is made up of a number of college admissions tests,<br />
<strong>in</strong>clud<strong>in</strong>g the Prelim<strong>in</strong>ary Scholastic Assessment Test<br />
(PSAT) <strong>and</strong> the Scholastic Assessment Test, now known<br />
as the SAT. High school students participate <strong>in</strong> the test<strong>in</strong>g<br />
program as sophomores, juniors, or seniors—some more<br />
than once dur<strong>in</strong>g these 3 years. If they have taken the<br />
tests more than once, only the most recent scores are<br />
tabulated. The PSAT <strong>and</strong> SAT report sub-scores <strong>in</strong> the<br />
areas of mathematics <strong>and</strong> verbal ability.<br />
The SAT results are not representative of high school<br />
students or college-bound students nationally, s<strong>in</strong>ce<br />
the sample is self-selected (i.e., taken by students who<br />
need the results to apply to a particular college or<br />
university). Public colleges <strong>in</strong> many states, particularly <strong>in</strong><br />
the Midwest, parts of the South, <strong>and</strong> the West, require<br />
ACT scores rather than SAT scores. The proportion of<br />
students tak<strong>in</strong>g the SAT <strong>in</strong> these states is very low <strong>and</strong><br />
is <strong>in</strong>appropriate for comparison. In recent years, more<br />
than 1.4 million high school students have taken the SAT<br />
exam<strong>in</strong>ation annually. About 3 million students took the<br />
exam<strong>in</strong>ation <strong>in</strong> 2010. The latest version of the SAT, which<br />
<strong>in</strong>cludes a writ<strong>in</strong>g component, was first adm<strong>in</strong>istered <strong>in</strong><br />
March 2005.<br />
Further <strong>in</strong>formation on the AP <strong>and</strong> SAT can be obta<strong>in</strong>ed<br />
from<br />
College Entrance Exam<strong>in</strong>ation Board<br />
45 Columbus Ave.<br />
New York, NY 10023<br />
http://www.collegeboard.org/<br />
296 <strong>Gaps</strong> <strong>in</strong> <strong>Access</strong> <strong>and</strong> <strong>Persistence</strong> <strong>Study</strong>
This page <strong>in</strong>tentionally left blank.<br />
Appendix B<br />
Appendix B 297