Higher Education: Gaps in Access and Persistence Study
Higher Education: Gaps in Access and Persistence Study
Higher Education: Gaps in Access and Persistence Study

You also want an ePaper? Increase the reach of your titles
YUMPU automatically turns print PDFs into web optimized ePapers that Google loves.
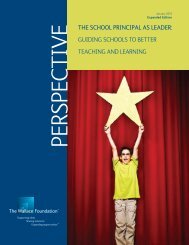
Figure 2.<br />
(Figure 6-2) Percentage of students <strong>in</strong> low- <strong>and</strong> high-poverty public elementary <strong>and</strong> secondary schools, by<br />
race/ethnicity <strong>and</strong> sex: School year 2010–11<br />
Percent<br />
60<br />
50<br />
40<br />
30<br />
20<br />
10<br />
0<br />
24 24<br />
33 33<br />
9 9<br />
Low-poverty schools<br />
13 13<br />
38 39 14 14<br />
Total 1 White Black Hispanic Asian Pacific<br />
Isl<strong>and</strong>er<br />
11 11<br />
American<br />
Indian/<br />
Alaska<br />
Native<br />
25 25<br />
Two or<br />
more<br />
races<br />
2020<br />
6 6<br />
42 41<br />
High-poverty schools<br />
38 38<br />
15 14<br />
19 19<br />
31 31<br />
16<br />
15<br />
Total 1 White Black Hispanic Asian Pacific American Two or<br />
Isl<strong>and</strong>er Indian/<br />
Alaska<br />
Native<br />
more<br />
races<br />
Executive Summary<br />
Race/ethnicity<br />
Male<br />
Female<br />
1<br />
Total <strong>in</strong>cludes other racial/ethnic groups not shown separately <strong>in</strong> the figure.<br />
NOTE: Low-poverty schools are those where 25 percent or fewer students were eligible for free or reduced-price lunch; high-poverty schools are those where<br />
more than 75 percent of students were eligible for free or reduced-price lunch. Race categories exclude persons of Hispanic ethnicity.<br />
SOURCE: U.S. Department of <strong>Education</strong>, National Center for <strong>Education</strong> Statistics, Common Core of Data (CCD), “Public Elementary/Secondary School<br />
Universe Survey,” 2010–11.<br />
Alaska Native school. Other racial/ethnic patterns<br />
<strong>in</strong>clude higher enrollment at high-poverty schools for<br />
Black (41 percent), Hispanic (38 percent), <strong>and</strong> American<br />
Indian/Alaska Native students (31 percent) than for<br />
Pacific Isl<strong>and</strong>er (19 percent), two or more races<br />
(16 percent), Asian (15 percent), <strong>and</strong> White students<br />
(6 percent).<br />
Adequate Yearly Progress <strong>and</strong> Special<br />
Schools<br />
In 2008–09, some 60 percent of public school students<br />
attended a school that met adequate yearly progress<br />
(AYP), an <strong>in</strong>dividual state’s measure toward achiev<strong>in</strong>g<br />
state academic st<strong>and</strong>ards based on criteria conta<strong>in</strong>ed <strong>in</strong><br />
the Elementary <strong>and</strong> Secondary <strong>Education</strong> Act (ESEA)<br />
Reauthorization. No measurable differences <strong>in</strong> school<br />
AYP status were found between males <strong>and</strong> females (overall<br />
or by race/ethnicity). However, racial/ethnic differences<br />
were observed. <strong>Higher</strong> percentages of Black (46 percent),<br />
Hispanic (48 percent), Asian/Pacific Isl<strong>and</strong>er (40 percent),<br />
<strong>and</strong> American Indian/Alaska Native students (40 percent)<br />
than White students (33 percent) attended schools that<br />
did not meet AYP. The percentage of students attend<strong>in</strong>g<br />
schools that did not meet AYP was similar for males<br />
<strong>and</strong> females (both overall <strong>and</strong> with<strong>in</strong> each racial/ethnic<br />
group), although it did vary by race/ethnicity.<br />
In 2010–11, nearly all students (98 percent) <strong>in</strong> public<br />
elementary <strong>and</strong> secondary schools <strong>in</strong> the United States<br />
attended regular public schools, 1 percent attended<br />
alternative schools, 1 <strong>and</strong> less than 1 percent each attended<br />
special education schools <strong>and</strong> vocational education<br />
schools. About 4 percent each of students attended charter<br />
1<br />
An alternative school is a public elementary/secondary school that (1) addresses<br />
needs of students that typically cannot be met <strong>in</strong> a regular school, (2) provides<br />
nontraditional education, (3) serves as an adjunct to a regular school, or (4) falls<br />
outside the categories of regular, special education, or vocational education.<br />
schools <strong>and</strong> magnet schools, most of which were also<br />
classified as regular schools. At alternative schools end<strong>in</strong>g<br />
<strong>in</strong> grade 12, males enrolled at higher rates than females<br />
did both overall <strong>and</strong> with<strong>in</strong> each racial/ethnic group<br />
studied.<br />
High School Guidance Counsel<strong>in</strong>g<br />
In 2009, about 48 percent of 9th-graders had high school<br />
guidance counselors who reported that the counsel<strong>in</strong>g<br />
program’s primary goal was to help students plan <strong>and</strong><br />
prepare for postsecondary education, <strong>and</strong> 35 percent had<br />
counselors who reported that the primary goal was to<br />
help students improve their achievement <strong>in</strong> high school.<br />
No measurable differences were found between male <strong>and</strong><br />
female 9th-graders (overall or with<strong>in</strong> racial/ethnic groups)<br />
for either of the primary counsel<strong>in</strong>g goals. However, a<br />
higher percentage of Asian 9th-graders (60 percent) than<br />
Black (44 percent), Hispanic (41 percent), <strong>and</strong> American<br />
Indian/Alaska Native 9th-graders (29 percent) had<br />
counselors who reported that the primary counsel<strong>in</strong>g<br />
program goal was help<strong>in</strong>g students plan <strong>and</strong> prepare<br />
for postsecondary education. Among male 9th-graders,<br />
higher percentages of Asians (56 percent) <strong>and</strong> Whites<br />
(51 percent) than Hispanics (38 percent) attended schools<br />
<strong>in</strong> which the counsel<strong>in</strong>g program’s primary goal was<br />
postsecondary plann<strong>in</strong>g <strong>and</strong> preparation.<br />
Student Behaviors <strong>and</strong> Afterschool<br />
Activities<br />
Retention, Suspension, <strong>and</strong> Expulsion<br />
Accord<strong>in</strong>g to parent reports, <strong>in</strong> 2009, some 13 percent<br />
of 9th-grade students had been reta<strong>in</strong>ed <strong>in</strong> any of grades<br />
k<strong>in</strong>dergarten through 9. In 2009, a higher percentage of<br />
males than females had been reta<strong>in</strong>ed <strong>in</strong> any grade. Also,<br />
Executive Summary vii