National Meteorological Library and Archive Fact sheet 15 - Met Office
National Meteorological Library and Archive Fact sheet 15 - Met Office
National Meteorological Library and Archive Fact sheet 15 - Met Office

You also want an ePaper? Increase the reach of your titles
YUMPU automatically turns print PDFs into web optimized ePapers that Google loves.
At each radar location an on-site computer carries out aerial elevation control <strong>and</strong> digital signal processing.<br />
The raw data is then sent to the Radarnet IV Central Processing at Exeter where the following processing<br />
is carried out:<br />
• Correction for attenuation by intervening rain<br />
• Correction to range attenuation<br />
• Elimination of ground clutter<br />
• Conversion of radar reflectivity to rainfall rate<br />
• Conversion from polar cells to <strong>National</strong> Grid Cartesian cells<br />
The radar network is then linked to a central computer at the <strong>Met</strong> <strong>Office</strong> Headquarters in Exeter. Each<br />
radar is owned by a consortium of agencies, such as the Environment Agency, with the <strong>Met</strong> <strong>Office</strong><br />
providing the technical <strong>and</strong> operational support.<br />
Each radar completes a series of scans about a vertical axis between four <strong>and</strong> eight low-elevation angles<br />
every 5 minutes (typically between 0.5 <strong>and</strong> 4.0 degrees, depending on the height of surrounding hills).<br />
Each scan gives good, quantitative data (1 <strong>and</strong> 2 km resolutions) out to a range of about 75 km <strong>and</strong> useful<br />
qualitative data (5 km resolution) to 255 km.<br />
• 5 km resolution data provides a good overall picture of the extent of precipitation at a national/regional<br />
scale.<br />
• 2 km data coverage extends over 85% of Engl<strong>and</strong> <strong>and</strong> Wales <strong>and</strong> shows more detailed distribution of<br />
precipitation intensities. It is suitable for more dem<strong>and</strong>ing rainfall monitoring <strong>and</strong> hydrological<br />
applications.<br />
• 1 km resolution provides the most detailed information, down to the scale of individual convective<br />
clouds. It is designed to assist real-time monitoring of small urban catchments <strong>and</strong> sewer systems.<br />
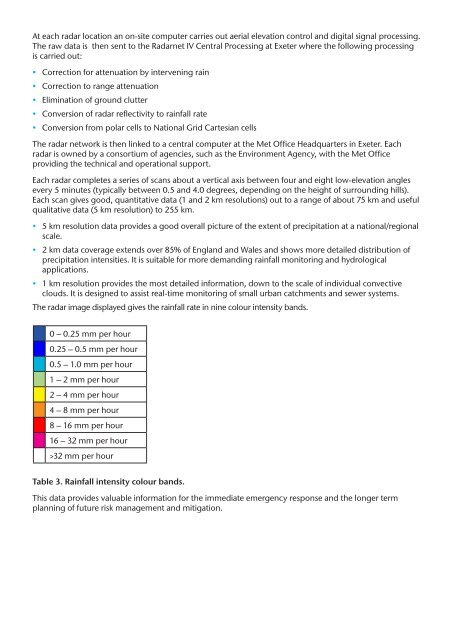
The radar image displayed gives the rainfall rate in nine colour intensity b<strong>and</strong>s.<br />
0 – 0.25 mm per hour<br />
0.25 – 0.5 mm per hour<br />
0.5 – 1.0 mm per hour<br />
1 – 2 mm per hour<br />
2 – 4 mm per hour<br />
4 – 8 mm per hour<br />
8 – 16 mm per hour<br />
16 – 32 mm per hour<br />
>32 mm per hour<br />
Table 3. Rainfall intensity colour b<strong>and</strong>s.<br />
This data provides valuable information for the immediate emergency response <strong>and</strong> the longer term<br />
planning of future risk management <strong>and</strong> mitigation.