rapid assessment of drinking-water quality in the republic of tajikistan
rapid assessment of drinking-water quality in the republic of tajikistan
rapid assessment of drinking-water quality in the republic of tajikistan

Create successful ePaper yourself
Turn your PDF publications into a flip-book with our unique Google optimized e-Paper software.
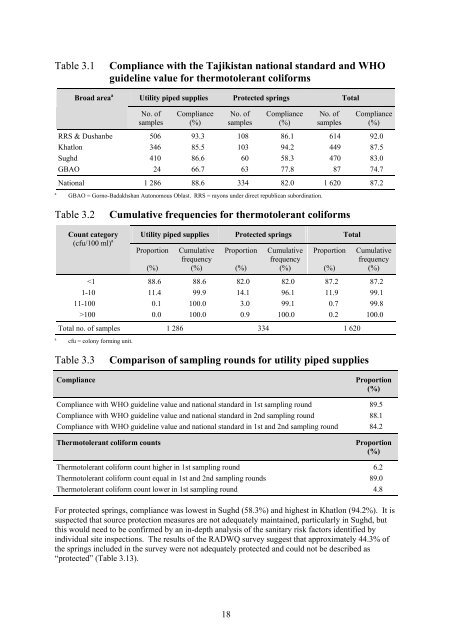
Table 3.1<br />
Compliance with <strong>the</strong> Tajikistan national standard and WHO<br />
guidel<strong>in</strong>e value for <strong>the</strong>rmotolerant coliforms<br />
Broad area a Utility piped supplies Protected spr<strong>in</strong>gs Total<br />
No. <strong>of</strong><br />
samples<br />
Compliance<br />
(%)<br />
No. <strong>of</strong><br />
samples<br />
Compliance<br />
(%)<br />
No. <strong>of</strong><br />
samples<br />
Compliance<br />
(%)<br />
RRS & Dushanbe 506 93.3 108 86.1 614 92.0<br />
Khatlon 346 85.5 103 94.2 449 87.5<br />
Sughd 410 86.6 60 58.3 470 83.0<br />
GBAO 24 66.7 63 77.8 87 74.7<br />
National 1 286 88.6 334 82.0 1 620 87.2<br />
a<br />
GBAO = Gorno-Badakhshan Autonomous Oblast. RRS = rayons under direct <strong>republic</strong>an subord<strong>in</strong>ation.<br />
Table 3.2<br />
Cumulative frequencies for <strong>the</strong>rmotolerant coliforms<br />
a<br />
Count category<br />
(cfu/100 ml) a<br />
Utility piped supplies Protected spr<strong>in</strong>gs Total<br />
Proportion<br />
(%)<br />
Cumulative<br />
frequency<br />
(%)<br />
Proportion<br />
(%)<br />
Cumulative<br />
frequency<br />
(%)<br />
Proportion<br />
(%)<br />
Cumulative<br />
frequency<br />
(%)<br />
100 0.0 100.0 0.9 100.0 0.2 100.0<br />
Total no. <strong>of</strong> samples 1 286 334 1 620<br />
cfu = colony form<strong>in</strong>g unit.<br />
Table 3.3<br />
Compliance<br />
Comparison <strong>of</strong> sampl<strong>in</strong>g rounds for utility piped supplies<br />
Proportion<br />
(%)<br />
Compliance with WHO guidel<strong>in</strong>e value and national standard <strong>in</strong> 1st sampl<strong>in</strong>g round 89.5<br />
Compliance with WHO guidel<strong>in</strong>e value and national standard <strong>in</strong> 2nd sampl<strong>in</strong>g round 88.1<br />
Compliance with WHO guidel<strong>in</strong>e value and national standard <strong>in</strong> 1st and 2nd sampl<strong>in</strong>g round 84.2<br />
Thermotolerant coliform counts<br />
Proportion<br />
(%)<br />
Thermotolerant coliform count higher <strong>in</strong> 1st sampl<strong>in</strong>g round 6.2<br />
Thermotolerant coliform count equal <strong>in</strong> 1st and 2nd sampl<strong>in</strong>g rounds 89.0<br />
Thermotolerant coliform count lower <strong>in</strong> 1st sampl<strong>in</strong>g round 4.8<br />
For protected spr<strong>in</strong>gs, compliance was lowest <strong>in</strong> Sughd (58.3%) and highest <strong>in</strong> Khatlon (94.2%). It is<br />
suspected that source protection measures are not adequately ma<strong>in</strong>ta<strong>in</strong>ed, particularly <strong>in</strong> Sughd, but<br />
this would need to be confirmed by an <strong>in</strong>-depth analysis <strong>of</strong> <strong>the</strong> sanitary risk factors identified by<br />
<strong>in</strong>dividual site <strong>in</strong>spections. The results <strong>of</strong> <strong>the</strong> RADWQ survey suggest that approximately 44.3% <strong>of</strong><br />
<strong>the</strong> spr<strong>in</strong>gs <strong>in</strong>cluded <strong>in</strong> <strong>the</strong> survey were not adequately protected and could not be described as<br />
“protected” (Table 3.13).<br />
18