rapid assessment of drinking-water quality in the republic of tajikistan
rapid assessment of drinking-water quality in the republic of tajikistan
rapid assessment of drinking-water quality in the republic of tajikistan

Create successful ePaper yourself
Turn your PDF publications into a flip-book with our unique Google optimized e-Paper software.
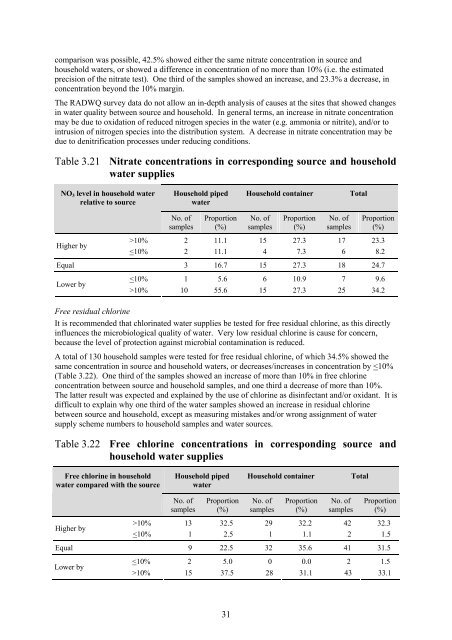
comparison was possible, 42.5% showed ei<strong>the</strong>r <strong>the</strong> same nitrate concentration <strong>in</strong> source and<br />
household <strong>water</strong>s, or showed a difference <strong>in</strong> concentration <strong>of</strong> no more than 10% (i.e. <strong>the</strong> estimated<br />
precision <strong>of</strong> <strong>the</strong> nitrate test). One third <strong>of</strong> <strong>the</strong> samples showed an <strong>in</strong>crease, and 23.3% a decrease, <strong>in</strong><br />
concentration beyond <strong>the</strong> 10% marg<strong>in</strong>.<br />
The RADWQ survey data do not allow an <strong>in</strong>-depth analysis <strong>of</strong> causes at <strong>the</strong> sites that showed changes<br />
<strong>in</strong> <strong>water</strong> <strong>quality</strong> between source and household. In general terms, an <strong>in</strong>crease <strong>in</strong> nitrate concentration<br />
may be due to oxidation <strong>of</strong> reduced nitrogen species <strong>in</strong> <strong>the</strong> <strong>water</strong> (e.g. ammonia or nitrite), and/or to<br />
<strong>in</strong>trusion <strong>of</strong> nitrogen species <strong>in</strong>to <strong>the</strong> distribution system. A decrease <strong>in</strong> nitrate concentration may be<br />
due to denitrification processes under reduc<strong>in</strong>g conditions.<br />
Table 3.21 Nitrate concentrations <strong>in</strong> correspond<strong>in</strong>g source and household<br />
<strong>water</strong> supplies<br />
NO 3 level <strong>in</strong> household <strong>water</strong><br />
relative to source<br />
Household piped<br />
<strong>water</strong><br />
Household conta<strong>in</strong>er<br />
Total<br />
No. <strong>of</strong><br />
samples<br />
Proportion<br />
(%)<br />
No. <strong>of</strong><br />
samples<br />
Proportion<br />
(%)<br />
No. <strong>of</strong><br />
samples<br />
Proportion<br />
(%)<br />
Higher by<br />
>10% 2 11.1 15 27.3 17 23.3<br />