Undrained Load Capacity of Torpedo Anchors in ... - laceo - UFRJ
Undrained Load Capacity of Torpedo Anchors in ... - laceo - UFRJ
Undrained Load Capacity of Torpedo Anchors in ... - laceo - UFRJ

You also want an ePaper? Increase the reach of your titles
YUMPU automatically turns print PDFs into web optimized ePapers that Google loves.
total vertical load unable to pull the anchor out. On the<br />
contrary, for <strong>in</strong>cl<strong>in</strong>ations higher than 45°, a small amount <strong>of</strong><br />
soil is mobilized, but the reduction <strong>in</strong> the surround<strong>in</strong>g soil<br />
stiffness and the high vertical loads are enough to pull the<br />
anchor out and well characterize its load capacity.<br />
It is worth mention<strong>in</strong>g that the differences between the<br />
observed failure mechanisms make the determ<strong>in</strong>ation <strong>of</strong> the<br />
anchor hold capacity a difficult task. On the one hand, for<br />
<strong>in</strong>cl<strong>in</strong>ations higher than 45°, the failure is clear and the hold<br />
capacity is well determ<strong>in</strong>ed. On the other hand, for <strong>in</strong>cl<strong>in</strong>ations<br />
lower than 45°, the failure is not clear and a criterion should be<br />
established to determ<strong>in</strong>e the load capacity. One possible<br />
criterion would be the maximum total displacement reached.<br />
However, Figs. 12 to 14 po<strong>in</strong>t a significant variation <strong>of</strong> the<br />
maxima displacements achieved <strong>in</strong> each analysis. When<br />
horizontal loads are applied, displacements <strong>of</strong> about 25cm are<br />
verified, while, when vertical loads are applied, these values<br />
may be as low as 5cm. Hence, this seems to be not a suitable<br />
choice and more studies must be performed to tackle this issue.<br />
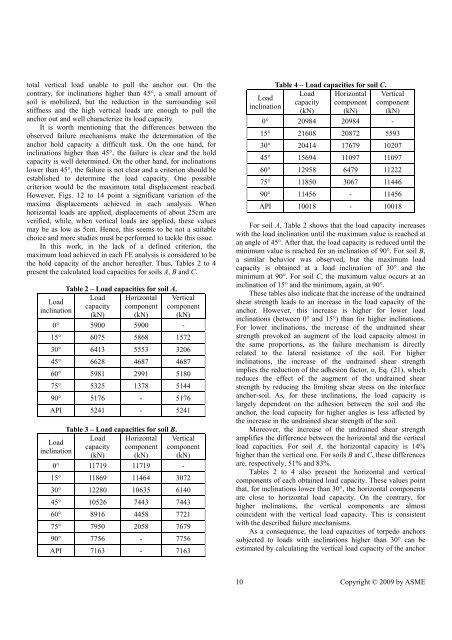
In this work, <strong>in</strong> the lack <strong>of</strong> a def<strong>in</strong>ed criterion, the<br />
maximum load achieved <strong>in</strong> each FE analysis is considered to be<br />
the hold capacity <strong>of</strong> the anchor hereafter. Thus, Tables 2 to 4<br />
present the calculated load capacities for soils A, B and C.<br />
<strong>Load</strong><br />
<strong>in</strong>cl<strong>in</strong>ation<br />
Table 2 – <strong>Load</strong> capacities for soil A.<br />
<strong>Load</strong> Horizontal<br />
capacity component<br />
(kN) (kN)<br />
Vertical<br />
component<br />
(kN)<br />
0° 5900 5900 -<br />
15° 6075 5868 1572<br />
30° 6413 5553 3206<br />
45° 6628 4687 4687<br />
60° 5981 2991 5180<br />
75° 5325 1378 5144<br />
90° 5176 - 5176<br />
API 5241 - 5241<br />
<strong>Load</strong><br />
<strong>in</strong>cl<strong>in</strong>ation<br />
Table 3 – <strong>Load</strong> capacities for soil B.<br />
<strong>Load</strong> Horizontal<br />
capacity component<br />
(kN) (kN)<br />
Vertical<br />
component<br />
(kN)<br />
0° 11719 11719 -<br />
15° 11869 11464 3072<br />
30° 12280 10635 6140<br />
45° 10526 7443 7443<br />
60° 8916 4458 7721<br />
75° 7950 2058 7679<br />
90° 7756 - 7756<br />
API 7163 - 7163<br />
<strong>Load</strong><br />
<strong>in</strong>cl<strong>in</strong>ation<br />
Table 4 – <strong>Load</strong> capacities for soil C.<br />
<strong>Load</strong> Horizontal<br />
capacity component<br />
(kN) (kN)<br />
Vertical<br />
component<br />
(kN)<br />
0° 20984 20984 -<br />
15° 21608 20872 5593<br />
30° 20414 17679 10207<br />
45° 15694 11097 11097<br />
60° 12958 6479 11222<br />
75° 11850 3067 11446<br />
90° 11456 - 11456<br />
API 10018 - 10018<br />
For soil A, Table 2 shows that the load capacity <strong>in</strong>creases<br />
with the load <strong>in</strong>cl<strong>in</strong>ation until the maximum value is reached at<br />
an angle <strong>of</strong> 45°. After that, the load capacity is reduced until the<br />
m<strong>in</strong>imum value is reached for an <strong>in</strong>cl<strong>in</strong>ation <strong>of</strong> 90°. For soil B,<br />
a similar behavior was observed, but the maximum load<br />
capacity is obta<strong>in</strong>ed at a load <strong>in</strong>cl<strong>in</strong>ation <strong>of</strong> 30° and the<br />
m<strong>in</strong>imum at 90°. For soil C, the maximum value occurs at an<br />
<strong>in</strong>cl<strong>in</strong>ation <strong>of</strong> 15° and the m<strong>in</strong>imum, aga<strong>in</strong>, at 90°.<br />
These tables also <strong>in</strong>dicate that the <strong>in</strong>crease <strong>of</strong> the undra<strong>in</strong>ed<br />
shear strength leads to an <strong>in</strong>crease <strong>in</strong> the load capacity <strong>of</strong> the<br />
anchor. However, this <strong>in</strong>crease is higher for lower load<br />
<strong>in</strong>cl<strong>in</strong>ations (between 0° and 15°) than for higher <strong>in</strong>cl<strong>in</strong>ations.<br />
For lower <strong>in</strong>cl<strong>in</strong>ations, the <strong>in</strong>crease <strong>of</strong> the undra<strong>in</strong>ed shear<br />
strength provoked an augment <strong>of</strong> the load capacity almost <strong>in</strong><br />
the same proportions, as the failure mechanism is directly<br />
related to the lateral resistance <strong>of</strong> the soil. For higher<br />
<strong>in</strong>cl<strong>in</strong>ations, the <strong>in</strong>crease <strong>of</strong> the undra<strong>in</strong>ed shear strength<br />
implies the reduction <strong>of</strong> the adhesion factor, α, Eq. (21), which<br />
reduces the effect <strong>of</strong> the augment <strong>of</strong> the undra<strong>in</strong>ed shear<br />
strength by reduc<strong>in</strong>g the limit<strong>in</strong>g shear stress on the <strong>in</strong>terface<br />
anchor-soil. As, for these <strong>in</strong>cl<strong>in</strong>ations, the load capacity is<br />
largely dependent on the adhesion between the soil and the<br />
anchor, the load capacity for higher angles is less affected by<br />
the <strong>in</strong>crease <strong>in</strong> the undra<strong>in</strong>ed shear strength <strong>of</strong> the soil.<br />
Moreover, the <strong>in</strong>crease <strong>of</strong> the undra<strong>in</strong>ed shear strength<br />
amplifies the difference between the horizontal and the vertical<br />
load capacities. For soil A, the horizontal capacity is 14%<br />
higher than the vertical one. For soils B and C, these differences<br />
are, respectively, 51% and 83%.<br />
Tables 2 to 4 also present the horizontal and vertical<br />
components <strong>of</strong> each obta<strong>in</strong>ed load capacity. These values po<strong>in</strong>t<br />
that, for <strong>in</strong>cl<strong>in</strong>ations lower than 30°, the horizontal components<br />
are close to horizontal load capacity. On the contrary, for<br />
higher <strong>in</strong>cl<strong>in</strong>ations, the vertical components are almost<br />
co<strong>in</strong>cident with the vertical load capacity. This is consistent<br />
with the described failure mechanisms.<br />
As a consequence, the load capacities <strong>of</strong> torpedo anchors<br />
subjected to loads with <strong>in</strong>cl<strong>in</strong>ations higher than 30° can be<br />
estimated by calculat<strong>in</strong>g the vertical load capacity <strong>of</strong> the anchor<br />
10 Copyright © 2009 by ASME