Undrained Load Capacity of Torpedo Anchors in ... - laceo - UFRJ
Undrained Load Capacity of Torpedo Anchors in ... - laceo - UFRJ
Undrained Load Capacity of Torpedo Anchors in ... - laceo - UFRJ

You also want an ePaper? Increase the reach of your titles
YUMPU automatically turns print PDFs into web optimized ePapers that Google loves.
varies from 0 to 0.90m. The self-weight <strong>of</strong> the anchor was kept<br />
constant and equals to 850kN.<br />
Although the undra<strong>in</strong>ed shear strengths were different, all<br />
the scenarios have the same anchor penetration. A study based<br />
on the theoretical model presented by True [11] was conducted<br />
only for soil B and the four flukes anchor. The penetration<br />
achieved by the top <strong>of</strong> the anchor was equal to 16m and this<br />
value was used <strong>in</strong> all analyses.<br />
Moreover, <strong>in</strong> the performed analyses, the extension cone<br />
approximation, Eq.(14), is employed.<br />
Several FE meshes were developed. In average, they have<br />
53770 nodes, 93830 elements lead<strong>in</strong>g to a problem with<br />
161310 degrees <strong>of</strong> freedom.<br />
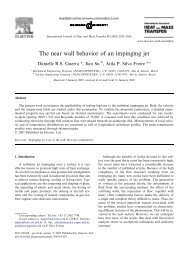
Results<br />
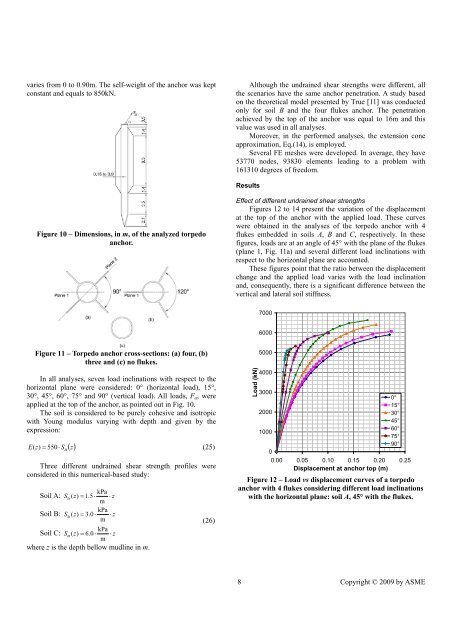
Figure 10 – Dimensions, <strong>in</strong> m, <strong>of</strong> the analyzed torpedo<br />
anchor.<br />
Effect <strong>of</strong> different undra<strong>in</strong>ed shear strengths<br />
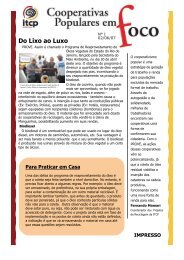
Figures 12 to 14 present the variation <strong>of</strong> the displacement<br />
at the top <strong>of</strong> the anchor with the applied load. These curves<br />
were obta<strong>in</strong>ed <strong>in</strong> the analyses <strong>of</strong> the torpedo anchor with 4<br />
flukes embedded <strong>in</strong> soils A, B and C, respectively. In these<br />
figures, loads are at an angle <strong>of</strong> 45° with the plane <strong>of</strong> the flukes<br />
(plane 1, Fig. 11a) and several different load <strong>in</strong>cl<strong>in</strong>ations with<br />
respect to the horizontal plane are accounted.<br />
These figures po<strong>in</strong>t that the ratio between the displacement<br />
change and the applied load varies with the load <strong>in</strong>cl<strong>in</strong>ation<br />
and, consequently, there is a significant difference between the<br />
vertical and lateral soil stiffness.<br />
7000<br />
6000<br />
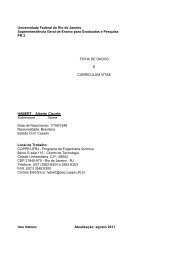
Figure 11 – <strong>Torpedo</strong> anchor cross-sections: (a) four, (b)<br />
three and (c) no flukes.<br />
In all analyses, seven load <strong>in</strong>cl<strong>in</strong>ations with respect to the<br />
horizontal plane were considered: 0° (horizontal load), 15°,<br />
30°, 45°, 60°, 75° and 90° (vertical load). All loads, F a , were<br />
applied at the top <strong>of</strong> the anchor, as po<strong>in</strong>ted out <strong>in</strong> Fig. 10.<br />
The soil is considered to be purely cohesive and isotropic<br />
with Young modulus vary<strong>in</strong>g with depth and given by the<br />
expression:<br />
() z<br />
E( z)<br />
= 550⋅ S<br />
(25)<br />
u<br />
Three different undra<strong>in</strong>ed shear strength pr<strong>of</strong>iles were<br />
considered <strong>in</strong> this numerical-based study:<br />
kPa<br />
Soil A: S u ( z)<br />
= 1.5⋅<br />
⋅ z<br />
m<br />
kPa<br />
Soil B: S u ( z)<br />
= 3.0 ⋅ ⋅ z<br />
m<br />
kPa<br />
Soil C: S u ( z)<br />
= 6.0 ⋅ ⋅ z<br />
m<br />
where z is the depth bellow mudl<strong>in</strong>e <strong>in</strong> m.<br />
(26)<br />
<strong>Load</strong> (kN)<br />
5000<br />
4000<br />
3000<br />
0°<br />
15°<br />
2000<br />
30°<br />
45°<br />
60°<br />
1000<br />
75°<br />
90°<br />
0<br />
0.00 0.05 0.10 0.15 0.20 0.25<br />
Displacement at anchor top (m)<br />
Figure 12 – <strong>Load</strong> vs displacement curves <strong>of</strong> a torpedo<br />
anchor with 4 flukes consider<strong>in</strong>g different load <strong>in</strong>cl<strong>in</strong>ations<br />
with the horizontal plane: soil A, 45° with the flukes.<br />
8 Copyright © 2009 by ASME