Adaptation to climate change in the countries of - Mekong River ...
Adaptation to climate change in the countries of - Mekong River ...
Adaptation to climate change in the countries of - Mekong River ...

Create successful ePaper yourself
Turn your PDF publications into a flip-book with our unique Google optimized e-Paper software.
3. Exist<strong>in</strong>g knowledge <strong>of</strong> national <strong>climate</strong> <strong>change</strong><br />
3.1 Cambodia<br />
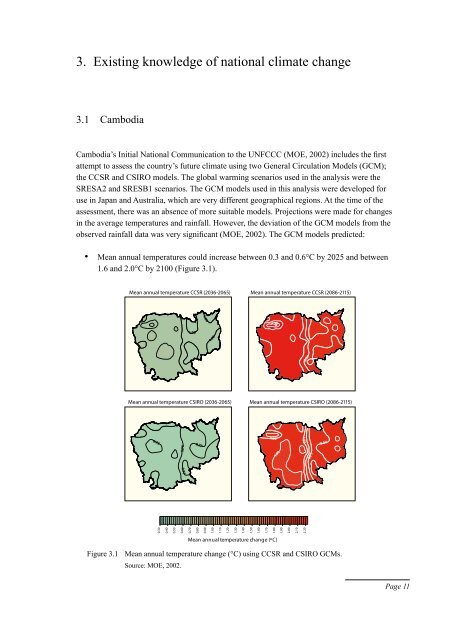
Cambodia’s Initial National Communication <strong>to</strong> <strong>the</strong> UNFCCC (MOE, 2002) <strong>in</strong>cludes <strong>the</strong> first<br />
attempt <strong>to</strong> assess <strong>the</strong> country’s future <strong>climate</strong> us<strong>in</strong>g two General Circulation Models (GCM);<br />
<strong>the</strong> CCSR and CSIRO models. The global warm<strong>in</strong>g scenarios used <strong>in</strong> <strong>the</strong> analysis were <strong>the</strong><br />
SRESA2 and SRESB1 scenarios. The GCM models used <strong>in</strong> this analysis were developed for<br />
use <strong>in</strong> Japan and Australia, which are very different geographical regions. At <strong>the</strong> time <strong>of</strong> <strong>the</strong><br />
assessment, <strong>the</strong>re was an absence <strong>of</strong> more suitable models. Projections were made for <strong>change</strong>s<br />
<strong>in</strong> <strong>the</strong> average temperatures and ra<strong>in</strong>fall. However, <strong>the</strong> deviation <strong>of</strong> <strong>the</strong> GCM models from <strong>the</strong><br />
observed ra<strong>in</strong>fall data was very significant (MOE, 2002). The GCM models predicted:<br />
• Mean annual temperatures could <strong>in</strong>crease between 0.3 and 0.6°C by 2025 and between<br />
1.6 and 2.0°C by 2100 (Figure 3.1).<br />
Mean annual temperature CCSR (2036-2065) Mean annual temperature CCSR (2086-2115)<br />
0.30<br />
0.40<br />
0.50<br />
0.60<br />
1.00<br />
0.70<br />
0.80<br />
1.00<br />
0.90<br />
1.00<br />
Mean annual temperature CSIRO (2036-2065) Mean annual temperature CSIRO (2086-2115)<br />
0.73<br />
0.75<br />
0.77<br />
0.77<br />
1.00<br />
Figure 3.1 Mean annual temperature <strong>change</strong> (°C) us<strong>in</strong>g CCSR and CSIRO GCMs.<br />
Source: MOE, 2002.<br />
1.10<br />
1.20<br />
1.30<br />
1.40<br />
1.50<br />
1.60<br />
1.70<br />
2.50<br />
1.92<br />
1.80<br />
Mean annual temperature <strong>change</strong> (ºC)<br />
1.90<br />
1.90<br />
2.00<br />
2.10<br />
2.50<br />
1.92<br />
2.20<br />
1.98<br />
2.00<br />
Page 11