Adaptation to climate change in the countries of - Mekong River ...
Adaptation to climate change in the countries of - Mekong River ...
Adaptation to climate change in the countries of - Mekong River ...
You also want an ePaper? Increase the reach of your titles
YUMPU automatically turns print PDFs into web optimized ePapers that Google loves.
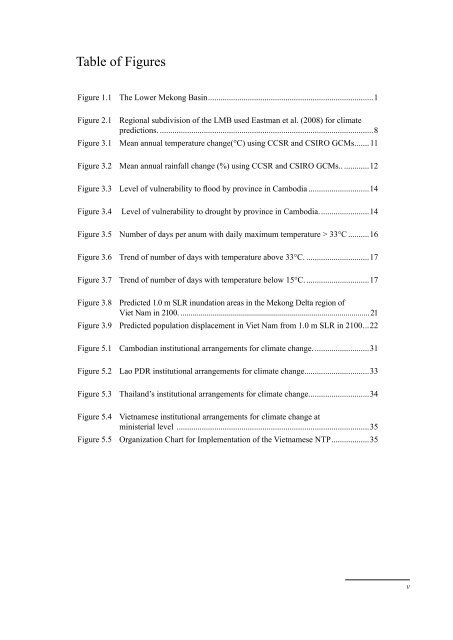
Table <strong>of</strong> Figures<br />
Figure 1.1 The Lower <strong>Mekong</strong> Bas<strong>in</strong> ...............................................................................1<br />
Figure 2.1 Regional subdivision <strong>of</strong> <strong>the</strong> LMB used Eastman et al. (2008) for <strong>climate</strong><br />
predictions. ......................................................................................................8<br />
Figure 3.1 Mean annual temperature <strong>change</strong>(°C) us<strong>in</strong>g CCSR and CSIRO GCMs.. .....11<br />
Figure 3.2 Mean annual ra<strong>in</strong>fall <strong>change</strong> (%) us<strong>in</strong>g CCSR and CSIRO GCMs.. ............12<br />
Figure 3.3 Level <strong>of</strong> vulnerability <strong>to</strong> flood by prov<strong>in</strong>ce <strong>in</strong> Cambodia .............................14<br />
Figure 3.4 Level <strong>of</strong> vulnerability <strong>to</strong> drought by prov<strong>in</strong>ce <strong>in</strong> Cambodia. .......................14<br />
Figure 3.5 Number <strong>of</strong> days per anum with daily maximum temperature > 33°C ..........16<br />
Figure 3.6 Trend <strong>of</strong> number <strong>of</strong> days with temperature above 33°C. ..............................17<br />
Figure 3.7 Trend <strong>of</strong> number <strong>of</strong> days with temperature below 15°C. ..............................17<br />
Figure 3.8 Predicted 1.0 m SLR <strong>in</strong>undation areas <strong>in</strong> <strong>the</strong> <strong>Mekong</strong> Delta region <strong>of</strong><br />
Viet Nam <strong>in</strong> 2100. ..............................................................................................21<br />
Figure 3.9 Predicted population displacement <strong>in</strong> Viet Nam from 1.0 m SLR <strong>in</strong> 2100. ..22<br />
Figure 5.1 Cambodian <strong>in</strong>stitutional arrangements for <strong>climate</strong> <strong>change</strong>. ..........................31<br />
Figure 5.2 Lao PDR <strong>in</strong>stitutional arrangements for <strong>climate</strong> <strong>change</strong>...............................33<br />
Figure 5.3 Thailand’s <strong>in</strong>stitutional arrangements for <strong>climate</strong> <strong>change</strong>. ............................34<br />
Figure 5.4 Vietnamese <strong>in</strong>stitutional arrangements for <strong>climate</strong> <strong>change</strong> at<br />
m<strong>in</strong>isterial level ............................................................................................35<br />
Figure 5.5 Organization Chart for Implementation <strong>of</strong> <strong>the</strong> Vietnamese NTP ..................35<br />
v


