Annual Report 2010 - CDON Group
Annual Report 2010 - CDON Group
Annual Report 2010 - CDON Group

Create successful ePaper yourself
Turn your PDF publications into a flip-book with our unique Google optimized e-Paper software.
46 <strong>CDON</strong> <strong>Group</strong> AB<br />
<strong>Annual</strong> report <strong>2010</strong><br />
<strong>CDON</strong> <strong>Group</strong> AB<br />
<strong>Annual</strong> report <strong>2010</strong><br />
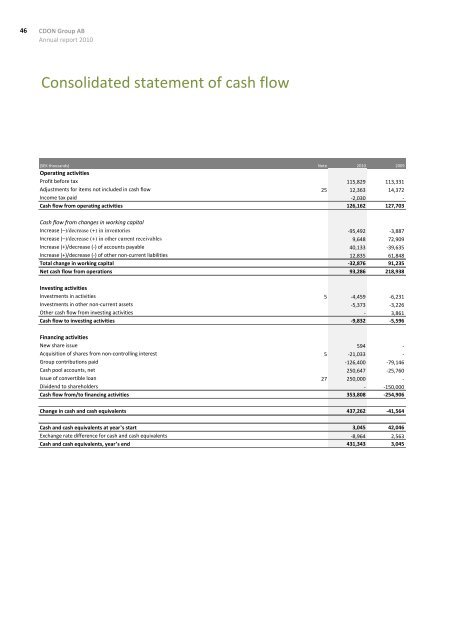
Consolidated statement of cash flow<br />
(SEK thousands) Note <strong>2010</strong> 2009<br />
Operating activities<br />
Profit before tax 115,829 113,331<br />
Adjustments for items not included in cash flow 25 12,363 14,372<br />
Income tax paid -2,030 -<br />
Cash flow from operating activities 126,162 127,703<br />
Cash flow from changes in working capital<br />
Increase (–)/decrease (+) in inventories -95,492 -3,887<br />
Increase (–)/decrease (+) in other current receivables 9,648 72,909<br />
Increase (+)/decrease (-) of accounts payable 40,133 -39,635<br />
Increase (+)/decrease (-) of other non-current liabilities 12,835 61,848<br />
Total change in working capital -32,876 91,235<br />
Net cash flow from operations 93,286 218,938<br />
Investing activities<br />
Investments in activities 5 -4,459 -6,231<br />
Investments in other non-current assets -5,373 -3,226<br />
Other cash flow from investing activities - 3,861<br />
Cash flow to investing activities -9,832 -5,596<br />
Financing activities<br />
New share issue 594 -<br />
Acquisition of shares from non-controlling interest 5 -21,033 -<br />
<strong>Group</strong> contributions paid -126,400 -79,146<br />
Cash pool accounts, net 250,647 -25,760<br />
Issue of convertible loan 27 250,000 -<br />
Dividend to shareholders - -150,000<br />
Cash flow from/to financing activities 353,808 -254,906<br />
Change in cash and cash equivalents 437,262 -41,564<br />
Cash and cash equivalents at year’s start 3,045 42,046<br />
Exchange rate difference for cash and cash equivalents -8,964 2,563<br />
Cash and cash equivalents, year’s end 431,343 3,045