Annual Report 2010 - CDON Group
Annual Report 2010 - CDON Group
Annual Report 2010 - CDON Group

Create successful ePaper yourself
Turn your PDF publications into a flip-book with our unique Google optimized e-Paper software.
6 <strong>CDON</strong> <strong>Group</strong> AB AB<br />
<strong>Annual</strong> report <strong>2010</strong><br />
Årsredovisning <strong>CDON</strong> <strong>Group</strong> AB <strong>2010</strong><br />
Årsredovisning <strong>2010</strong><br />
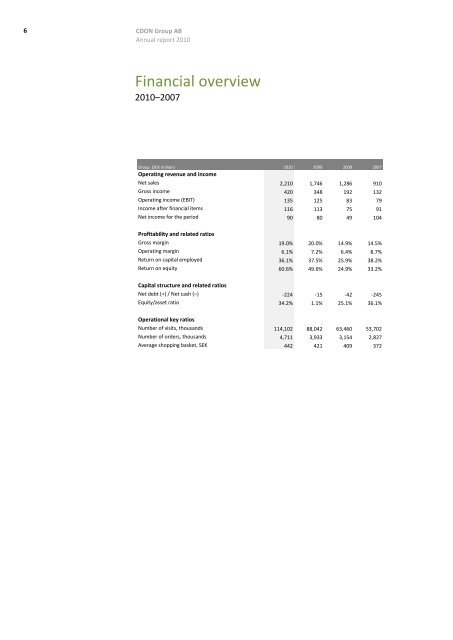
Financial overview<br />
Financial overview<br />
<strong>2010</strong>–2007<br />
<strong>2010</strong>–2007<br />
<strong>Group</strong> (SEK million) <strong>2010</strong> 2009 2008 2007<br />
Operating revenue and income<br />
<strong>Group</strong> (SEK million)<br />
Net sales<br />
Operating revenue and income<br />
Gross income<br />
Net sales<br />
Operating income (EBIT)<br />
Gross income<br />
Income after financial items<br />
Operating income (EBIT)<br />
Net income for the period<br />
Income after financial items<br />
<strong>2010</strong><br />
2,210<br />
420<br />
2,210<br />
135<br />
420<br />
116<br />
135<br />
90<br />
116<br />
2009<br />
1,746<br />
348<br />
1,746<br />
125<br />
348<br />
113<br />
125<br />
80<br />
113<br />
2008<br />
1,286<br />
192<br />
1,286<br />
83<br />
192<br />
75<br />
83<br />
49<br />
75<br />
2007<br />
910<br />
132<br />
910<br />
79<br />
132<br />
91<br />
79<br />
104<br />
91<br />
Net income for the period<br />
Profitability and related ratios<br />
90 80 49 104<br />
Gross margin<br />
Profitability and related ratios<br />
Operating margin<br />
Gross margin<br />
Return on capital employed<br />
Operating margin<br />
Return on equity<br />
Return on capital employed<br />
19.0%<br />
6.1%<br />
19.0%<br />
36.1%<br />
6.1%<br />
60.6%<br />
36.1%<br />
20.0%<br />
7.2%<br />
20.0%<br />
37.5%<br />
7.2%<br />
49.6%<br />
37.5%<br />
14.9%<br />
6.4%<br />
14.9%<br />
25.9%<br />
6.4%<br />
24.9%<br />
25.9%<br />
14.5%<br />
8.7%<br />
14.5%<br />
38.2%<br />
8.7%<br />
33.2%<br />
38.2%<br />
Return on equity<br />
Capital structure and related ratios<br />
60.6% 49.6% 24.9% 33.2%<br />
Net debt (+) / Net cash (–)<br />
Capital structure and related ratios<br />
Equity/asset ratio<br />
Net debt (+) / Net cash (–)<br />
-224<br />
34.2%<br />
-224<br />
-15<br />
1.1%<br />
-15<br />
-42<br />
25.1%<br />
-42<br />
-245<br />
36.1%<br />
-245<br />
Equity/asset ratio<br />
Operational key ratios<br />
34.2% 1.1% 25.1% 36.1%<br />
Number of visits, thousands<br />
Operational key ratios<br />
Number of orders, thousands<br />
Number of visits, thousands<br />
Average shopping basket, SEK<br />
Number of orders, thousands<br />
114,102<br />
4,711<br />
114,102<br />
442<br />
4,711<br />
88,042<br />
3,933<br />
88,042<br />
421<br />
3,933<br />
63,460<br />
3,154<br />
63,460<br />
409<br />
3,154<br />
53,702<br />
2,827<br />
53,702<br />
372<br />
2,827<br />
Average shopping basket, SEK 442 421 409 372