Tourism Risk Management - Sustainable Tourism Online
Tourism Risk Management - Sustainable Tourism Online
Tourism Risk Management - Sustainable Tourism Online

You also want an ePaper? Increase the reach of your titles
YUMPU automatically turns print PDFs into web optimized ePapers that Google loves.
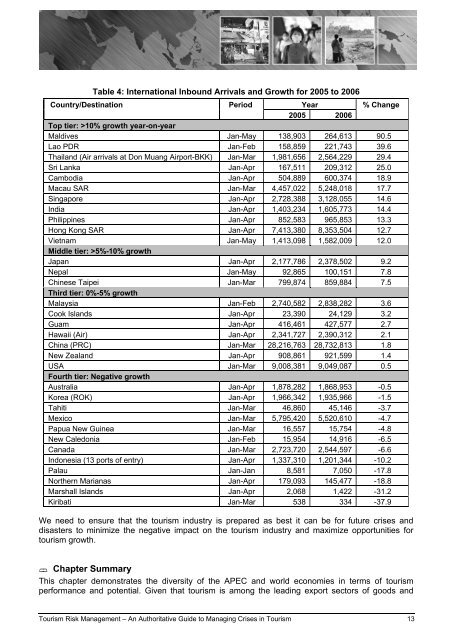
Table 4: International Inbound Arrivals and Growth for 2005 to 2006<br />
Country/Destination Period Year % Change<br />
2005 2006<br />
Top tier: >10% growth year-on-year<br />
Maldives Jan-May 138,903 264,613 90.5<br />
Lao PDR Jan-Feb 158,859 221,743 39.6<br />
Thailand (Air arrivals at Don Muang Airport-BKK) Jan-Mar 1,981,656 2,564,229 29.4<br />
Sri Lanka Jan-Apr 167,511 209,312 25.0<br />
Cambodia Jan-Apr 504,889 600,374 18.9<br />
Macau SAR Jan-Mar 4,457,022 5,248,018 17.7<br />
Singapore Jan-Apr 2,728,388 3,128,055 14.6<br />
India Jan-Apr 1,403,234 1,605,773 14.4<br />
Philippines Jan-Apr 852,583 965,853 13.3<br />
Hong Kong SAR Jan-Apr 7,413,380 8,353,504 12.7<br />
Vietnam Jan-May 1,413,098 1,582,009 12.0<br />
Middle tier: >5%-10% growth<br />
Japan Jan-Apr 2,177,786 2,378,502 9.2<br />
Nepal Jan-May 92,865 100,151 7.8<br />
Chinese Taipei Jan-Mar 799,874 859,884 7.5<br />
Third tier: 0%-5% growth<br />
Malaysia Jan-Feb 2,740,582 2,838,282 3.6<br />
Cook Islands Jan-Apr 23,390 24,129 3.2<br />
Guam Jan-Apr 416,461 427,577 2.7<br />
Hawaii (Air) Jan-Apr 2,341,727 2,390,312 2.1<br />
China (PRC) Jan-Mar 28,216,763 28,732,813 1.8<br />
New Zealand Jan-Apr 908,861 921,599 1.4<br />
USA Jan-Mar 9,008,381 9,049,087 0.5<br />
Fourth tier: Negative growth<br />
Australia Jan-Apr 1,878,282 1,868,953 -0.5<br />
Korea (ROK) Jan-Apr 1,966,342 1,935,966 -1.5<br />
Tahiti Jan-Mar 46,860 45,146 -3.7<br />
Mexico Jan-Mar 5,795,420 5,520,610 -4.7<br />
Papua New Guinea Jan-Mar 16,557 15,754 -4.8<br />
New Caledonia Jan-Feb 15,954 14,916 -6.5<br />
Canada Jan-Mar 2,723,720 2,544,597 -6.6<br />
Indonesia (13 ports of entry) Jan-Apr 1,337,310 1,201,344 -10.2<br />
Palau Jan-Jan 8,581 7,050 -17.8<br />
Northern Marianas Jan-Apr 179,093 145,477 -18.8<br />
Marshall Islands Jan-Apr 2,068 1,422 -31.2<br />
Kiribati Jan-Mar 538 334 -37.9<br />
We need to ensure that the tourism industry is prepared as best it can be for future crises and<br />
disasters to minimize the negative impact on the tourism industry and maximize opportunities for<br />
tourism growth.<br />
Chapter Summary<br />
This chapter demonstrates the diversity of the APEC and world economies in terms of tourism<br />
performance and potential. Given that tourism is among the leading export sectors of goods and<br />
<strong>Tourism</strong> <strong>Risk</strong> <strong>Management</strong> – An Authoritative Guide to Managing Crises in <strong>Tourism</strong> 13