Annual Report for 2012-13 - Mangalore Refinery and ...
Annual Report for 2012-13 - Mangalore Refinery and ...
Annual Report for 2012-13 - Mangalore Refinery and ...

Create successful ePaper yourself
Turn your PDF publications into a flip-book with our unique Google optimized e-Paper software.
<strong>Annual</strong> <strong>Report</strong> <strong>2012</strong>-<strong>13</strong><br />
ANNEXURE - II<br />
1. Economy Overview<br />
MANAGEMENT DISCUSSION AND ANALYSIS REPORT<br />
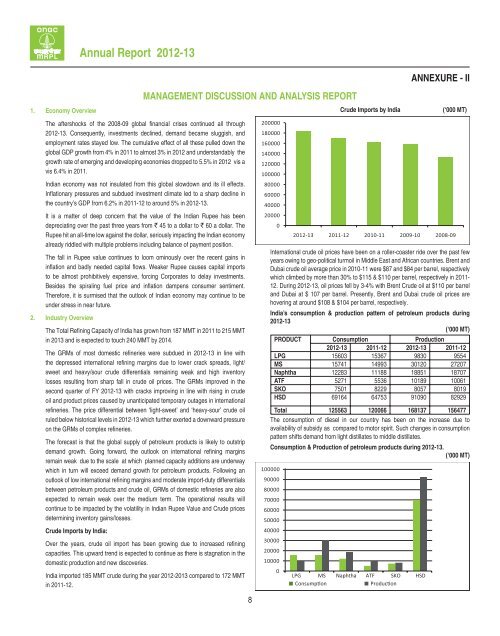
Crude Imports by India<br />
(Â000 MT)<br />
The aftershocks of the 2008-09 global fi nancial crises continued all through<br />
<strong>2012</strong>-<strong>13</strong>. Consequently, investments declined, dem<strong>and</strong> became sluggish, <strong>and</strong><br />
employment rates stayed low. The cumulative effect of all these pulled down the<br />
global GDP growth from 4% in 2011 to almost 3% in <strong>2012</strong> <strong>and</strong> underst<strong>and</strong>ably the<br />
growth rate of emerging <strong>and</strong> developing economies dropped to 5.5% in <strong>2012</strong> vis a<br />
vis 6.4% in 2011.<br />
Indian economy was not insulated from this global slowdown <strong>and</strong> its ill effects.<br />
Infl ationary pressures <strong>and</strong> subdued investment climate led to a sharp decline in<br />
the country’s GDP from 6.2% in 2011-12 to around 5% in <strong>2012</strong>-<strong>13</strong>.<br />
It is a matter of deep concern that the value of the Indian Rupee has been<br />
depreciating over the past three years from ` 45 to a dollar to ` 60 a dollar. The<br />
Rupee hit an all-time low against the dollar, seriously impacting the Indian economy<br />
already riddled with multiple problems including balance of payment position.<br />
The fall in Rupee value continues to loom ominously over the recent gains in<br />
infl ation <strong>and</strong> badly needed capital fl ows. Weaker Rupee causes capital imports<br />
to be almost prohibitively expensive, <strong>for</strong>cing Corporates to delay investments.<br />
Besides the spiraling fuel price <strong>and</strong> infl ation dampens consumer sentiment.<br />
There<strong>for</strong>e, it is surmised that the outlook of Indian economy may continue to be<br />
under stress in near future.<br />
2. Industry Overview<br />
The Total Refi ning Capacity of India has grown from 187 MMT in 2011 to 215 MMT<br />
in 20<strong>13</strong> <strong>and</strong> is expected to touch 240 MMT by 2014.<br />
The GRMs of most domestic refi neries were subdued in <strong>2012</strong>-<strong>13</strong> in line with<br />
the depressed international refi ning margins due to lower crack spreads, light/<br />
sweet <strong>and</strong> heavy/sour crude differentials remaining weak <strong>and</strong> high inventory<br />
losses resulting from sharp fall in crude oil prices. The GRMs improved in the<br />
second quarter of FY <strong>2012</strong>-<strong>13</strong> with cracks improving in line with rising in crude<br />
oil <strong>and</strong> product prices caused by unanticipated temporary outages in international<br />
refi neries. The price differential between ‘light-sweet’ <strong>and</strong> ‘heavy-sour’ crude oil<br />
ruled below historical levels in <strong>2012</strong>-<strong>13</strong> which further exerted a downward pressure<br />
on the GRMs of complex refi neries.<br />
The <strong>for</strong>ecast is that the global supply of petroleum products is likely to outstrip<br />
dem<strong>and</strong> growth. Going <strong>for</strong>ward, the outlook on international refi ning margins<br />
remain weak due to the scale at which planned capacity additions are underway<br />
which in turn will exceed dem<strong>and</strong> growth <strong>for</strong> petroleum products. Following an<br />
outlook of low international refi ning margins <strong>and</strong> moderate import-duty differentials<br />
between petroleum products <strong>and</strong> crude oil, GRMs of domestic refi neries are also<br />
expected to remain weak over the medium term. The operational results will<br />
continue to be impacted by the volatility in Indian Rupee Value <strong>and</strong> Crude prices<br />
determining inventory gains/losses.<br />
Crude Imports by India:<br />
Over the years, crude oil import has been growing due to increased refi ning<br />
capacities. This upward trend is expected to continue as there is stagnation in the<br />
domestic production <strong>and</strong> new discoveries.<br />
India imported 185 MMT crude during the year <strong>2012</strong>-20<strong>13</strong> compared to 172 MMT<br />
in 2011-12.<br />
200000<br />
180000<br />
160000<br />
140000<br />
120000<br />
100000<br />
80000<br />
60000<br />
40000<br />
20000<br />
0<br />
<strong>2012</strong>-<strong>13</strong> 2011-12 2010-11 2009-10 2008-09<br />
International crude oil prices have been on a roller-coaster ride over the past few<br />
years owing to geo-political turmoil in Middle East <strong>and</strong> African countries. Brent <strong>and</strong><br />
Dubai crude oil average price in 2010-11 were $87 <strong>and</strong> $84 per barrel, respectively<br />
which climbed by more than 30% to $115 & $110 per barrel, respectively in 2011-<br />
12. During <strong>2012</strong>-<strong>13</strong>, oil prices fell by 3-4% with Brent Crude oil at $110 per barrel<br />
<strong>and</strong> Dubai at $ 107 per barrel. Presently, Brent <strong>and</strong> Dubai crude oil prices are<br />
hovering at around $108 & $104 per barrel, respectively.<br />
IndiaÊs consumption & production pattern of petroleum products during<br />
<strong>2012</strong>-<strong>13</strong><br />
(Â000 MT)<br />
PRODUCT Consumption Production<br />
<strong>2012</strong>-<strong>13</strong> 2011-12 <strong>2012</strong>-<strong>13</strong> 2011-12<br />
LPG 15603 15367 9830 9554<br />
MS 15741 14993 30120 27207<br />
Naphtha 12283 11188 18851 18707<br />
ATF 5271 5536 10189 10061<br />
SKO 7501 8229 8057 8019<br />
HSD 69164 64753 91090 82929<br />
Total 125563 120066 168<strong>13</strong>7 156477<br />
The consumption of diesel in our country has been on the increase due to<br />
availability of subsidy as compared to motor spirit. Such changes in consumption<br />
pattern shifts dem<strong>and</strong> from light distillates to middle distillates.<br />
Consumption & Production of petroleum products during <strong>2012</strong>-<strong>13</strong>.<br />
(Â000 MT)<br />
100000<br />
90000<br />
80000<br />
70000<br />
60000<br />
50000<br />
40000<br />
30000<br />
20000<br />
10000<br />
0<br />
LPG MS Naphtha ATF SKO HSD<br />
Consumpon<br />
Producon<br />
8