Annual Report for 2012-13 - Mangalore Refinery and ...
Annual Report for 2012-13 - Mangalore Refinery and ...
Annual Report for 2012-13 - Mangalore Refinery and ...

Create successful ePaper yourself
Turn your PDF publications into a flip-book with our unique Google optimized e-Paper software.
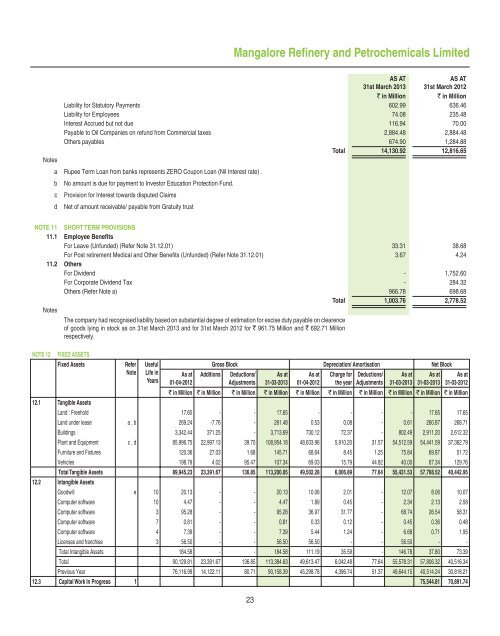
<strong>Mangalore</strong> <strong>Refinery</strong> <strong>and</strong> Petrochemicals Limited<br />
AS AT<br />
31st March 20<strong>13</strong><br />
AS AT<br />
31st March <strong>2012</strong><br />
` in Million ` in Million<br />
Liability <strong>for</strong> Statutory Payments 602.99 636.46<br />
Liability <strong>for</strong> Employees 74.08 235.48<br />
Interest Accrued but not due 116.94 70.00<br />
Payable to Oil Companies on refund from Commercial taxes 2,884.48 2,884.48<br />
Others payables 674.90 1,284.88<br />
Total 14,<strong>13</strong>0.92 12,816.65<br />
Notes<br />
a Rupee Term Loan from banks represents ZERO Coupon Loan (Nil Interest rate) .<br />
b No amount is due <strong>for</strong> payment to Investor Education Protection Fund.<br />
c Provision <strong>for</strong> Interest towards disputed Claims<br />
d Net of amount receivable/ payable from Gratuity trust<br />
NOTE 11 SHORT TERM PROVISIONS<br />
11.1 Employee Benefits<br />
For Leave (Unfunded) (Refer Note 31.12.01) 33.31 38.68<br />
For Post retirement Medical <strong>and</strong> Other Benefi ts (Unfunded) (Refer Note 31.12.01) 3.67 4.24<br />
11.2 Others<br />
For Dividend - 1,752.60<br />
For Corporate Dividend Tax - 284.32<br />
Others (Refer Note a) 966.78 698.68<br />
Total 1,003.76 2,778.52<br />
Notes<br />
The company had recognised liability based on substantial degree of estimation <strong>for</strong> excise duty payable on clearence<br />
of goods lying in stock as on 31st March 20<strong>13</strong> <strong>and</strong> <strong>for</strong> 31st March <strong>2012</strong> <strong>for</strong> ` 961.75 Million <strong>and</strong> ` 692.71 Million<br />
respectively.<br />
NOTE 12<br />
FIXED ASSETS<br />
Fixed Assets<br />
Refer<br />
Note<br />
Useful<br />
Life in<br />
Years<br />
As at<br />
01-04-<strong>2012</strong><br />
Additions<br />
Gross Block Depreciation/ Amortisation Net Block<br />
Deductions/<br />
Adjustments<br />
23<br />
As at<br />
31-03-20<strong>13</strong><br />
As at<br />
01-04-<strong>2012</strong><br />
Charge <strong>for</strong><br />
the year<br />
Deductions/<br />
Adjustments<br />
As at<br />
31-03-20<strong>13</strong><br />
As at<br />
31-03-20<strong>13</strong><br />
As at<br />
31-03-<strong>2012</strong><br />
` in Million ` in Million ` in Million ` in Million ` in Million ` in Million ` in Million ` in Million ` in Million ` in Million<br />
12.1 Tangible Assets<br />
L<strong>and</strong> : Freehold 17.65 - - 17.65 - - - - 17.65 17.65<br />
L<strong>and</strong> under lease a , b 269.24 -7.76 - 261.48 0.53 0.08 - 0.61 260.87 268.71<br />
Buildings 3,342.44 371.25 - 3,7<strong>13</strong>.69 730.12 72.37 - 802.49 2,911.20 2,612.32<br />
Plant <strong>and</strong> Equipment c , d 85,996.75 22,997.<strong>13</strong> 39.70 108,954.18 48,633.96 5,910.20 31.57 54,512.59 54,441.59 37,362.79<br />
Furniture <strong>and</strong> Fixtures 120.36 27.03 1.68 145.71 68.64 8.45 1.25 75.84 69.87 51.72<br />
Vehicles 198.79 4.02 95.47 107.34 69.03 15.79 44.82 40.00 67.34 129.76<br />
Total Tangible Assets 89,945.23 23,391.67 <strong>13</strong>6.85 1<strong>13</strong>,200.05 49,502.28 6,006.89 77.64 55,431.53 57,768.52 40,442.95<br />
12.2 Intangible Assets<br />
Goodwill e 10 20.<strong>13</strong> - - 20.<strong>13</strong> 10.06 2.01 - 12.07 8.06 10.07<br />
Computer software 10 4.47 - - 4.47 1.89 0.45 - 2.34 2.<strong>13</strong> 2.58<br />
Computer software 3 95.28 - - 95.28 36.97 31.77 - 68.74 26.54 58.31<br />
Computer software 7 0.81 - - 0.81 0.33 0.12 - 0.45 0.36 0.48<br />
Computer software 4 7.39 - - 7.39 5.44 1.24 - 6.68 0.71 1.95<br />
Licenses <strong>and</strong> franchise 3 56.50 - - 56.50 56.50 - - 56.50 - -<br />
Total Intangible Assets 184.58 - - 184.58 111.19 35.59 - 146.78 37.80 73.39<br />
Total 90,129.81 23,391.67 <strong>13</strong>6.85 1<strong>13</strong>,384.63 49,6<strong>13</strong>.47 6,042.48 77.64 55,578.31 57,806.32 40,516.34<br />
Previous Year 76,116.99 14,122.11 80.71 90,158.39 45,298.78 4,396.74 51.37 49,644.15 40,514.24 30,818.21<br />
12.3 Capital Work In Progress f 75,544.81 70,891.74