Investor Presentation - Li Ning
Investor Presentation - Li Ning
Investor Presentation - Li Ning

Create successful ePaper yourself
Turn your PDF publications into a flip-book with our unique Google optimized e-Paper software.
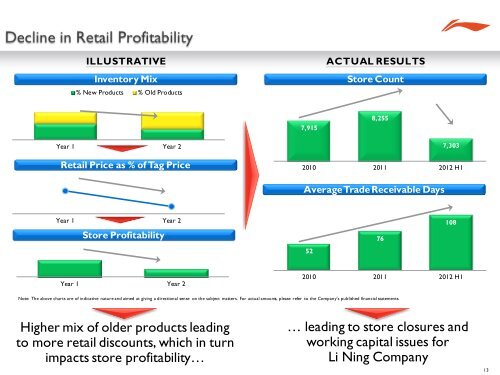
ILLUSTRATIVE<br />
Inventory Mix<br />
% New Products % Old Products<br />
ACTUAL RESULTS<br />
Store Count<br />
7,915<br />
8,255<br />
Year 1 Year 2<br />
Retail Price as % of Tag Price<br />
7,303<br />
2010 2011 2012 H1<br />
Average Trade Receivable Days<br />
Year 1 Year 2<br />
Store Profitability<br />
52<br />
76<br />
108<br />
Year 1 Year 2<br />
2010 2011 2012 H1<br />
Note: The above charts are of indicative nature and aimed at giving a directional sense on the subject matters. For actual amounts, please refer to the Company's published financial statements.<br />
Higher mix of older products leading<br />
to more retail discounts, which in turn<br />
impacts store profitability…<br />
… leading to store closures and<br />
working capital issues for<br />
<strong>Li</strong> <strong>Ning</strong> Company<br />
13