DRAFT TECHNICAL AND VOCATIONAL EDUCATION AND ...
DRAFT TECHNICAL AND VOCATIONAL EDUCATION AND ...
DRAFT TECHNICAL AND VOCATIONAL EDUCATION AND ...

Create successful ePaper yourself
Turn your PDF publications into a flip-book with our unique Google optimized e-Paper software.
13<br />
3.0 THE LABOUR MARKET IN GHANA<br />
As Nakanishi (2006) aptly described it in relation to NVTI graduates, the labour market in<br />
Ghana is a “difficult labour market.” The labour absorption capacity of the market is low and<br />
not growing fast enough to cope with the hundreds of thousands of graduates entering the<br />
market at various levels of the educational system. Sub-section 3.1 presents facts and figures<br />
that describe the labour market situation in Ghana.<br />
3.1 Facts and Figures<br />
As pointed out by the Institute of Statistical, Social and Economic Research (2008, p. 152),<br />
“Employment and unemployment data in Ghana are either soft or non-existent and this makes<br />
the analysis of employment difficult.” Tables 3.1 to 3.4 and Appendices C1 – C10 give some<br />
insights into the labour market situation in Ghana. The data in the tables point to the<br />
following conclusions:<br />
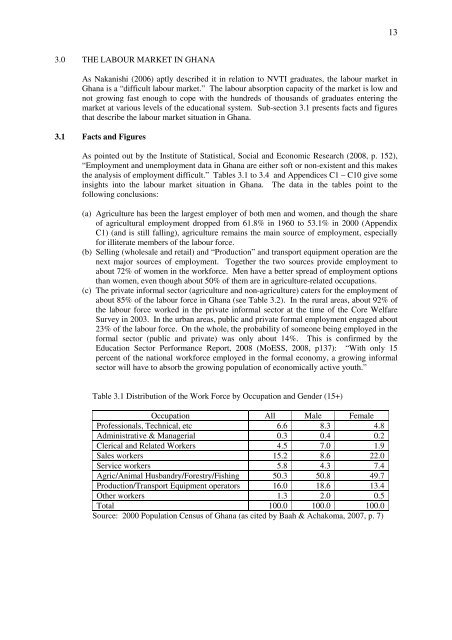
(a) Agriculture has been the largest employer of both men and women, and though the share<br />
of agricultural employment dropped from 61.8% in 1960 to 53.1% in 2000 (Appendix<br />
C1) (and is still falling), agriculture remains the main source of employment, especially<br />
for illiterate members of the labour force.<br />
(b) Selling (wholesale and retail) and “Production” and transport equipment operation are the<br />
next major sources of employment. Together the two sources provide employment to<br />
about 72% of women in the workforce. Men have a better spread of employment options<br />
than women, even though about 50% of them are in agriculture-related occupations.<br />
(c) The private informal sector (agriculture and non-agriculture) caters for the employment of<br />
about 85% of the labour force in Ghana (see Table 3.2). In the rural areas, about 92% of<br />
the labour force worked in the private informal sector at the time of the Core Welfare<br />
Survey in 2003. In the urban areas, public and private formal employment engaged about<br />
23% of the labour force. On the whole, the probability of someone being employed in the<br />
formal sector (public and private) was only about 14%. This is confirmed by the<br />
Education Sector Performance Report, 2008 (MoESS, 2008, p137): “With only 15<br />
percent of the national workforce employed in the formal economy, a growing informal<br />
sector will have to absorb the growing population of economically active youth.”<br />
Table 3.1 Distribution of the Work Force by Occupation and Gender (15+)<br />
Occupation All Male Female<br />
Professionals, Technical, etc 6.6 8.3 4.8<br />
Administrative & Managerial 0.3 0.4 0.2<br />
Clerical and Related Workers 4.5 7.0 1.9<br />
Sales workers 15.2 8.6 22.0<br />
Service workers 5.8 4.3 7.4<br />
Agric/Animal Husbandry/Forestry/Fishing 50.3 50.8 49.7<br />
Production/Transport Equipment operators 16.0 18.6 13.4<br />
Other workers 1.3 2.0 0.5<br />
Total 100.0 100.0 100.0<br />
Source: 2000 Population Census of Ghana (as cited by Baah & Achakoma, 2007, p. 7)