November 2009 - Nordea Bank Lietuva
November 2009 - Nordea Bank Lietuva
November 2009 - Nordea Bank Lietuva

You also want an ePaper? Increase the reach of your titles
YUMPU automatically turns print PDFs into web optimized ePapers that Google loves.
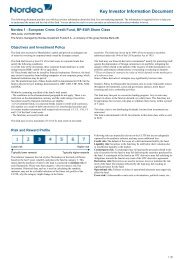
European Alpha Fund<br />
30 <strong>November</strong> <strong>2009</strong><br />
Performance in %<br />
Cumulative Fund Benchmark*<br />
Year to date<br />
27.38<br />
23.90<br />
1 month<br />
1.26<br />
1.13<br />
3 months<br />
1.26<br />
1.11<br />
1 year<br />
26.13<br />
19.04<br />
3 years<br />
-<br />
-<br />
5 years<br />
-<br />
-<br />
Since launch<br />
-35.80<br />
-30.81<br />
Discrete Year<br />
2008<br />
2007<br />
2006<br />
2005<br />
2004<br />
Fund<br />
-48.41<br />
-<br />
-<br />
-<br />
-<br />
Benchmark*<br />
-43.65<br />
-<br />
-<br />
-<br />
-<br />
Performance (in base currency, indexed at 100)<br />
110<br />
100<br />
90<br />
80<br />
70<br />
60<br />
50<br />
40<br />
13/11/2007 13/03/2008 13/07/2008 13/11/2008 13/03/<strong>2009</strong> 13/07/<strong>2009</strong> 13/11/<strong>2009</strong><br />
European Alpha Fund<br />
MSCI Europe - Net Return Index²<br />
Key Figures**<br />
Annualised return in %<br />
Volatility in %<br />
Alpha in %<br />
Beta<br />
Sharpe ratio<br />
Correlation<br />
Information ratio<br />
Tracking error in %<br />
Fund<br />
-<br />
-<br />
-<br />
-<br />
-<br />
-<br />
-<br />
-<br />
Benchmark*<br />
-<br />
-<br />
-<br />
-<br />
-<br />
Fund Data<br />
Share class<br />
Fund category<br />
Last NAV<br />
AUM (Million EUR)<br />
Minimum investment (EUR)<br />
- Front end fee in %<br />
- Annual management fee in %<br />
- Launch date<br />
BP<br />
Accumulating<br />
6.42<br />
83.64<br />
50<br />
5.00<br />
1.50<br />
13/11/2007<br />
Base currency<br />
ISIN<br />
Sedol<br />
WKN<br />
Bloomberg ticker<br />
Number of holdings<br />
Manager<br />
²Source: Datastream/Bloomberg<br />
EUR<br />
LU0326853404<br />
B28QGJ4<br />
A0M5ME<br />
NOALBPE LX<br />
71<br />
Richard E. Robinson<br />
Performances are in EUR<br />
*MSCI Europe - Net Return Index<br />
**Annualized 3 year data<br />
Asset Allocation in %<br />
Country<br />
Fund<br />
United Kingdom 32.93<br />
Norway 14.85<br />
Germany 14.18<br />
France 10.09<br />
Netherlands 5.69<br />
Sweden 4.63<br />
Spain 3.92<br />
Denmark 3.83<br />
Other 10.59<br />
Net Liquid Assets -0.75<br />
Sector<br />
Fund<br />
Industrials 30.15<br />
Energy 24.76<br />
Materials 14.43<br />
Financials 7.71<br />
Consumer Discretionary 7.14<br />
Health Care 5.65<br />
Consumer Staples 5.04<br />
Utilities 2.85<br />
Other 2.97<br />
Net Liquid Assets -0.75<br />
Top Holdings in %<br />
Security Name Country<br />
Sector Weight<br />
Renewable Energy Norway<br />
Industrials<br />
2.32<br />
Tullow Oil United Kingdom<br />
Energy<br />
2.24<br />
Prudential United Kingdom<br />
Financials<br />
1.94<br />
Amec Ord United Kingdom<br />
Energy<br />
1.90<br />
Afren PLC United Kingdom<br />
Energy<br />
1.86<br />
Centamin Egypt Australia<br />
Materials<br />
1.76<br />
Skanska B Sweden<br />
Industrials<br />
1.76<br />
Kingfisher United Kingdom<br />
Consumer Discretionary<br />
1.72<br />
Regal Petroleum United Kingdom<br />
Energy<br />
1.71<br />
Fresenius Medical Care Germany<br />
Health Care<br />
1.68<br />
Investment Strategy<br />
The fund focus is on the quality and attractiveness of individual sectors and companies rather than on the outlook for particular European countries. To achieve its objective, the<br />
fund applies an investment approach that uses a top-down analysis consisting of concrete ‘gorilla’ views. These mega-trends reflect long- and mid-term views, which not only take<br />
into account macroeconomic factors but also allow the identification of the most promising sub-sectors or “equity clusters” with the highest growth potential within each gorilla<br />
view. These equity clusters are then actively traded to ensure that portfolio allocation is quickly adapted to grasp opportunities as they arise and defend against threats, thus<br />
creating superior long-term performance.