November 2009 - Nordea Bank Lietuva
November 2009 - Nordea Bank Lietuva
November 2009 - Nordea Bank Lietuva

You also want an ePaper? Increase the reach of your titles
YUMPU automatically turns print PDFs into web optimized ePapers that Google loves.
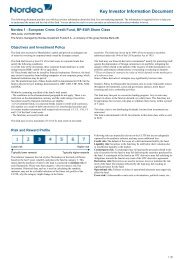
African Equity Fund<br />
30 <strong>November</strong> <strong>2009</strong><br />
Performance in %<br />
Cumulative Fund Benchmark*<br />
Year to date<br />
17.76<br />
-<br />
1 month<br />
-3.04<br />
-<br />
3 months<br />
-1.71<br />
-<br />
1 year<br />
-<br />
-<br />
3 years<br />
-<br />
-<br />
5 years<br />
-<br />
-<br />
Since launch<br />
14.70<br />
-<br />
Discrete Year<br />
2008<br />
2007<br />
2006<br />
2005<br />
2004<br />
Fund<br />
-<br />
-<br />
-<br />
-<br />
-<br />
Benchmark*<br />
-<br />
-<br />
-<br />
-<br />
-<br />
Performance (in base currency, indexed at 100)<br />
125<br />
120<br />
115<br />
110<br />
105<br />
100<br />
95<br />
90<br />
85<br />
80<br />
75<br />
17/11/2008 17/01/<strong>2009</strong> 17/03/<strong>2009</strong> 17/05/<strong>2009</strong> 17/07/<strong>2009</strong> 17/09/<strong>2009</strong> 17/11/<strong>2009</strong><br />
African Equity Fund<br />
Key Figures**<br />
Annualised return in %<br />
Volatility in %<br />
Alpha in %<br />
Beta<br />
Sharpe ratio<br />
Correlation<br />
Information ratio<br />
Tracking error in %<br />
Fund<br />
-<br />
-<br />
-<br />
-<br />
-<br />
-<br />
-<br />
-<br />
Benchmark*<br />
-<br />
-<br />
-<br />
-<br />
-<br />
Fund Data<br />
Share class<br />
Fund category<br />
Last NAV<br />
AUM (Million EUR)<br />
Minimum investment (EUR)<br />
- Front end fee in %<br />
- Annual management fee in %<br />
- Launch date<br />
BP<br />
Accumulating<br />
11.47<br />
8.29<br />
50<br />
5.00<br />
1.95<br />
17/11/2008<br />
Base currency<br />
ISIN<br />
Sedol<br />
WKN<br />
Bloomberg ticker<br />
Number of holdings<br />
Manager<br />
EUR<br />
LU0390856663<br />
B3FJZJ6<br />
A0RASM<br />
NAFEBPE LX<br />
68<br />
Richard Middleton<br />
Performances are in EUR<br />
*No benchmark<br />
**Annualized 3 year data<br />
Asset Allocation in %<br />
Country<br />
Fund<br />
South Africa 46.35<br />
Nigeria 17.58<br />
Egypt 12.89<br />
Zambia 6.45<br />
Kenya 5.41<br />
Mauritius 4.22<br />
Morocco 3.81<br />
United Kingdom 1.85<br />
Other 1.40<br />
Net Liquid Assets 0.00<br />
Sector<br />
Fund<br />
Financials 37.54<br />
Industrials 16.70<br />
Telecommunication Services 11.86<br />
Materials 11.78<br />
Consumer Discretionary 8.24<br />
Consumer Staples 7.63<br />
Health Care 2.87<br />
Energy 1.67<br />
Other 1.67<br />
Net Liquid Assets 0.00<br />
Top Holdings in %<br />
Security Name Country<br />
Sector Weight<br />
Celtel Zambia Zambia<br />
Telecommunication Services<br />
3.51<br />
First City Monument <strong>Bank</strong> Nigeria<br />
Financials<br />
3.29<br />
Safaricom Kenya<br />
Telecommunication Services<br />
3.11<br />
Zambeef Products Zambia<br />
Consumer Staples<br />
2.93<br />
Access <strong>Bank</strong> Nigeria<br />
Financials<br />
2.80<br />
Guaranty Trust <strong>Bank</strong> Nigeria<br />
Financials<br />
2.76<br />
Orascom Construction Industries Egypt<br />
Industrials<br />
2.73<br />
Standard <strong>Bank</strong> South Africa<br />
Financials<br />
2.70<br />
Sabmiller South Africa<br />
Consumer Staples<br />
2.38<br />
Investec Group South Africa<br />
Financials<br />
2.18<br />
Investment Strategy<br />
The fund selects companies whose earnings are set to grow faster than the market and are driven by domestic economical growth. Sizes and industries differ, however focus is<br />
on large innovative companies concentrating on their core business as well as new future growth businesses. Initial allocation is foreseen to be approximately 50% invested in<br />
South-African equities and approximately 50 % in other African equities. Exposure to Pan-African equities will be increased according to market development and liquidity.